iBankCoin
Joined Nov 11, 2007
1,458 Blog Posts

Don’t Think, Buy GLD

Had you bought this low RSI2 setup over the history of the [[GLD]] ETF, you would have had a winning trade 25 out of 34 trades, or 73.5%.

Sell when RSI2 > 80.

Choose a stop based on whatever you want, but obviously, the 200 day average and the trendline must not be violated.

Comments »

The Daily Breakout: Bonus Edition

So what is so special about this edition of the daily breakout? I want to discuss a strategy for setting effective stops, as well as some position sizing. This strategy has been very effective in the current, extremely volatile, market environment.

First, lets look at some breakouts. Some of these have broken out, and have completed the first pullback to test the pivot point. Others are brand new breakouts.
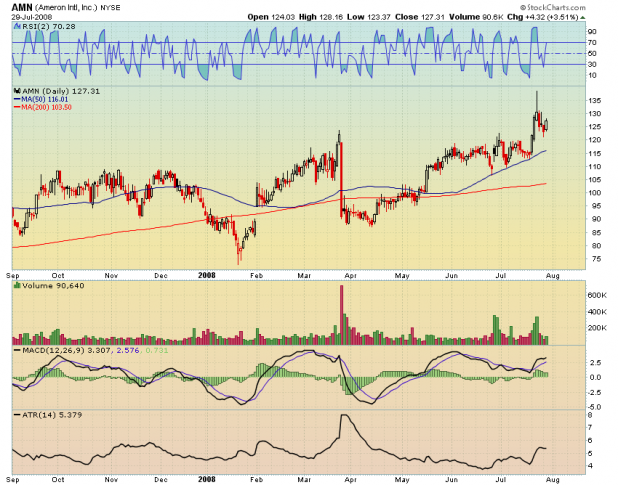
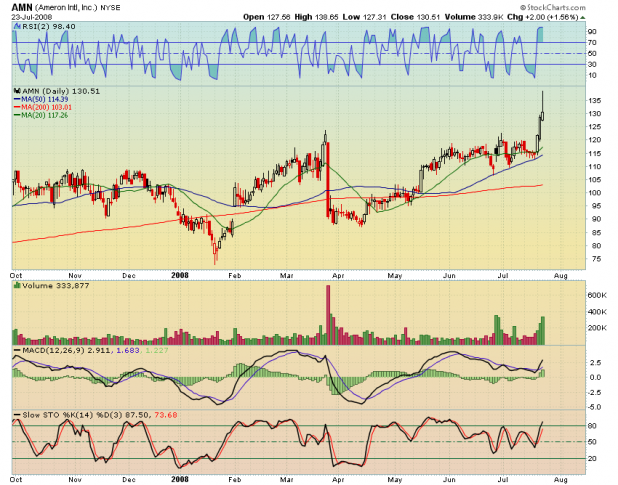
[[AMN]] Ameron International Corporation had a nice breakout on good volume, and has pulled back to complete what appears to be a successful test of the pivot point.
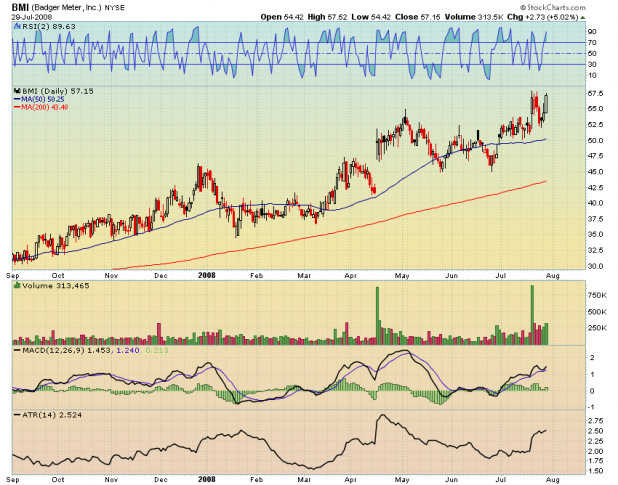
[[BMI]] Badger Meter, Inc. broke out, tested the pivot, and is moving up on great volume.
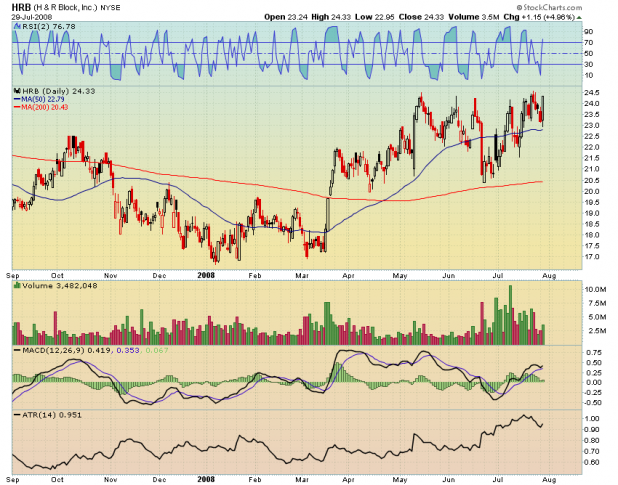
[[HRB]] H&R Block, Inc. continues to punch the noses of short-sellers. In a perfect world, I would have wanted better volume today. Other than that, being long a financial stock that is fixin’ to make new highs is hot.
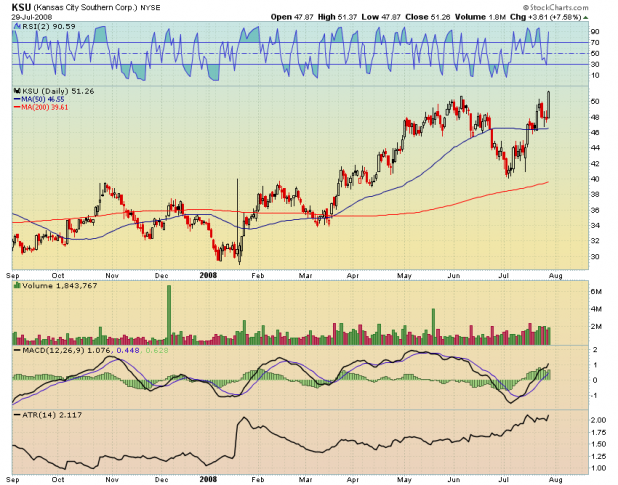
[[KSU]] Kansas City Southern and [[NSC]] Norfolk Southern Corp. continue to make new highs, on volume.
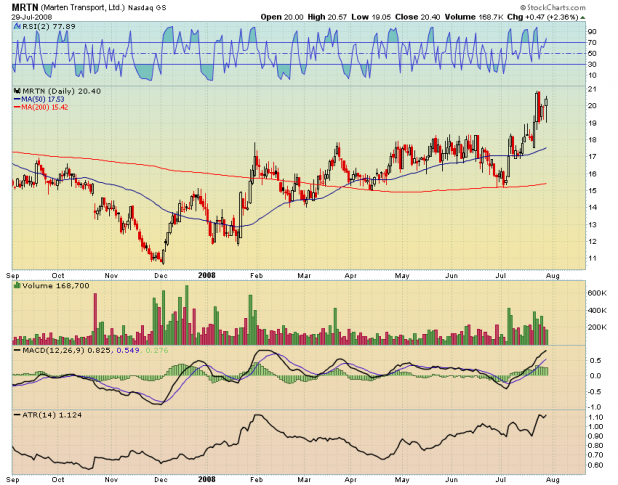
[[MRTN]] Marten Transport, Ltd has come close to testing its pivot point. I think this stock is great way to play falling oil.
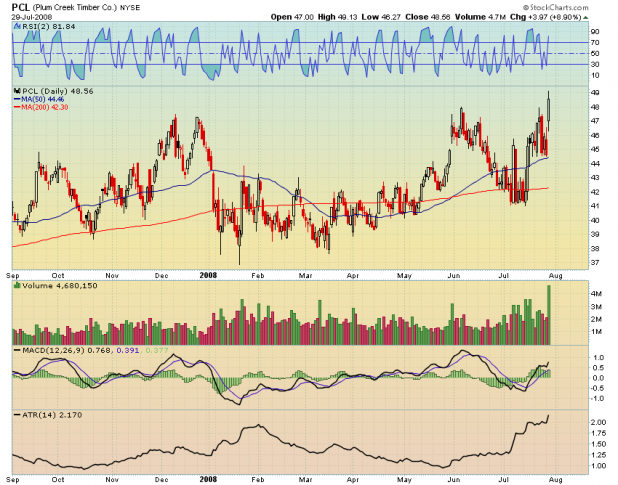
[[PCL]] Plum Creek Timber Co. Inc. I’m not sure what is driving this one, but the volume on the move is spectacular.
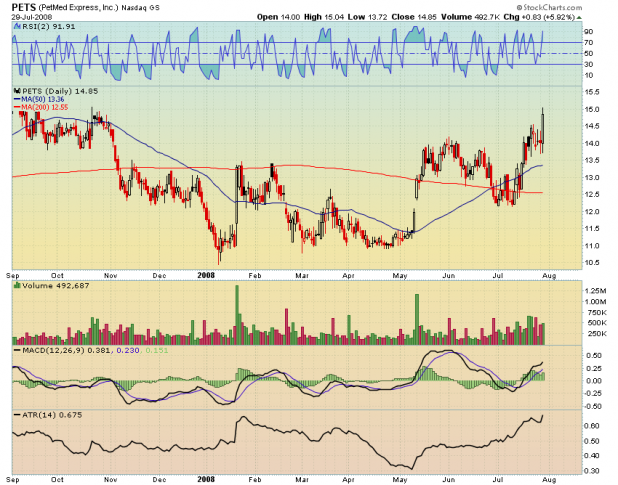
[[PETS]] PetMed Express, Inc. It is hard to believe that this stock is breaking out, considering the retail environment. People will treat their dogs better than their own children, so maybe it has some staying power. 17% of the float is sold short.
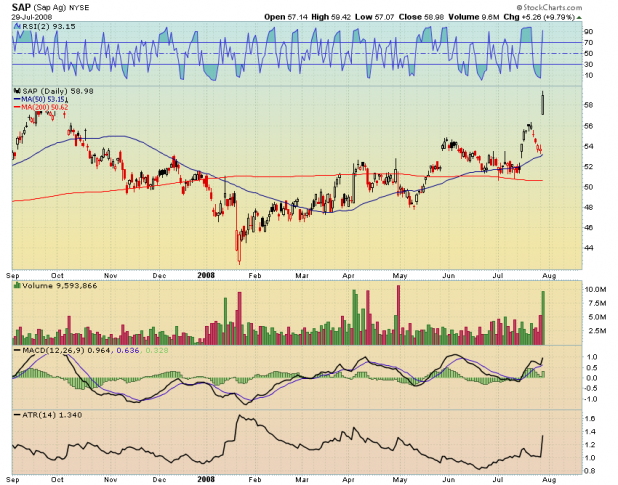
[[SAP]] SAP AG (ADR) Wow…

Now, let me suggest a method for setting stops on these breakouts.

I assume that many people are getting shaken out of what would be successful trades. One way to avoid this is to have a stop based on volatility, not risk to capital. If you have been setting stops based only on risk to capital, I bet this environment has been rather painful for your trades.

Some of you may have noticed that I did not include Stochastics, but instead included Average True Range (ATR), at the bottom of each chart. ATR will be our proxy for volatility. The reason for using volatility for determining stops is that the more volatile the stock, the looser, or larger your stop should be from your entry point.

Take another look at the chart of PCL. It is easy to see that the stock has been very volatile. The ATR is $2.17, meaning PCL has averaged a range of 2.17 points, over the last 14 days. Lets add a multiplier. The larger the multiplier, the larger your stop will be from your entry point. I have been using a multiplier of 2.5-3.0.

With PCL’s ATR of 2.17, a 2.5 x ATR stop would be 5.42 points from the entry. Had you purchased PCL at today’s close of $48.56, your stop would be placed at $43.14. A stop at this level looks good as it is well beneath recent support at the 50 day average. This ATR-based stop will give your trade room to breathe.

Now, Let’s Protect Your Capital

Now that you have determined the level for your stop, lets determine the size of your position. In order to do this, you must decide what percent of your total capital you want to risk on this trade. If you have 25K, and you want to risk 1%, then you are risking 250 bucks each trade. Now divide your risk, 250 bucks, by the ATR and multiplier. 250/(ATR*2.5)

For PCL, 250/(2.17*2.5) = 46.12 Therefore, your position size will be 46 shares. Now you buy 46 shares, set your stop at $43.14, and if your stop gets hit, you have lost 1% of your capital.

Why ATR Stops and Position Sizing are Crucial in this Market

2 Reasons: The first is that you have to give these trades room to move. Everything is volatile right now. You can’t set stops the same way you did 2 years ago, or they’ll get hit before your trade moves in the right direction.

Secondly, in my experience, volatility raises fear and decreases confidence. Using this system for setting stops and determining position size will have you buying smaller positions on volatile stocks and larger positions on less volatile stocks. This will enable you to have more confidence in your trades by decreasing the likelihood that a few stocks will cause a gut-wrenching swing in your equity. This method also allows for strict control over risk. If you experience 10 losses in a row, your total drawdown will only be 10%.

As with most things, this is only the tip of the iceberg in terms of developing a system for trading breakouts. I highly encourage you to check out IBD Index, which is simply the best damn blog on the internet for developing systems for trading breakouts.

Comments »

Quick Alert from Mr. 40 Hr. Work Week

Going into today, I was long the following names for my breakout strategy…

[[AMN]] [[BMI]] [[GIS]] [[MRTN]] [[PGI]] [[HRB]] [[CVD]]

I also bought a little [[DDM]] on the open, as part of another strategy.

That is all.

Back to work.

Comments »

Reader Request: BOOM

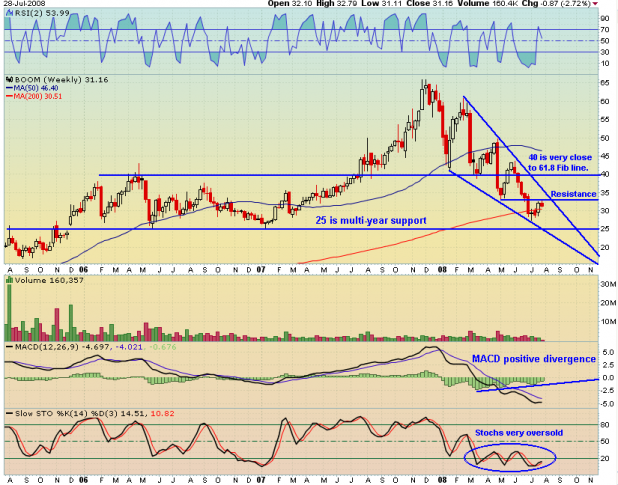
The 3-year weekly chart of [[BOOM]] shows a stock that has been brutalized. The stock has undercut the base from which it broke out in July of 2007. The breakdown has been a series of waterfalls with each subsequent fall getting smaller than the previous. The stock has been a dream for the talented trader as almost every gap down has been bought until the gap fills, and then the process starts all over.

The weekly chart shows that the downward momentum is slowing. The MACD is showing a clear positive divergence. The stock bounced near multi-year support at $25.00. Unless there is some evil lurking in the BOOM’s balance sheet, or in the industry, I can’t see that the sellers have a lot of juice left here.

I would not be surprised if the Doji printed 4 weeks ago represents the bottom, or at the very least, the beginning of a new basing process.

Long-term resistance is in the area of 40, which is also in the same area as the 61.8 Fib. line.

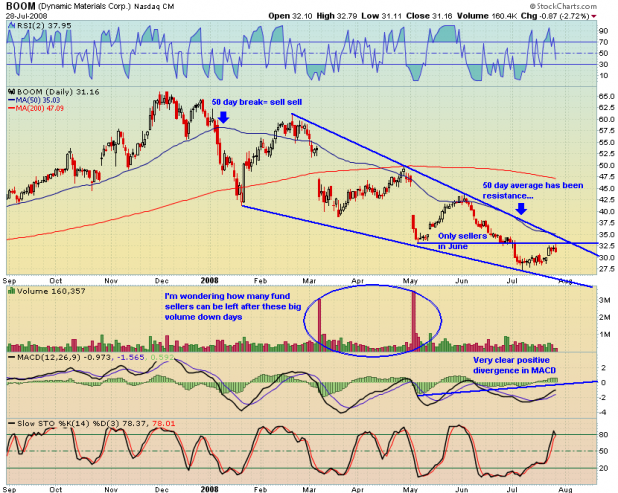
The daily chart shows that BOOM has been sold off everytime it approaches its 50 day moving average. This is normal. A bullish recovery would be evidenced by BOOM re-taking this average and holding above it.

The MACD on the daily is very bullish. Should it lead the weekly MACD (which I expect it will), it does point to a possible change from downside momentum to stabilization, or even some upside improvment.

In the very short-term, I would like to see BOOM hold 30. However, I will not be convinced that the Bears have lost control of this stock until it clears resistance at 33, as it moves to break above the 50 day moving average.

Overall, this stock is a good example of what happens when funds accumulate, hold, and then begin distributing shares. It can take a long time for all the positions to be unwound. It appears to me that this cycle is near an end. BOOM may languish for eternity as funds move to new names, or the cycle may begin anew if BOOM’s fundamentals warrant a new round of accumulation.

Comments »

Technical Analysis of the Dow Jones Industrial Average

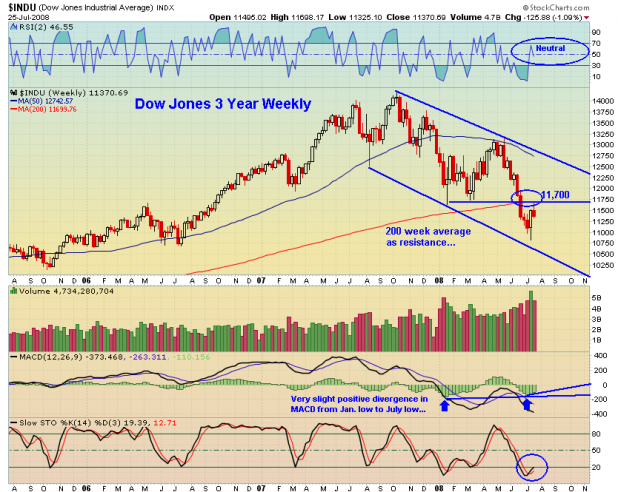
Looking at the 3-year weekly Dow Jones chart, we see the index closed the week in the middle of a 10-month declining channel. It is still beneath the 200 week moving average. It was this area, 11,700, that saw the rejection of the index after the recent short squeeze. I expect this area to maintain strong resistance.

The RSI is neutral, while the Stochastics seem to be giving a buy signal. MACD is moving up towards the zero line, with July’s low showing a very slight positive divergence from January’s low.

The weekly perspective leads me to think that the Dow will continue ambling up towards the upper channel line. Momentum seems to be switching in the favor of the bulls.

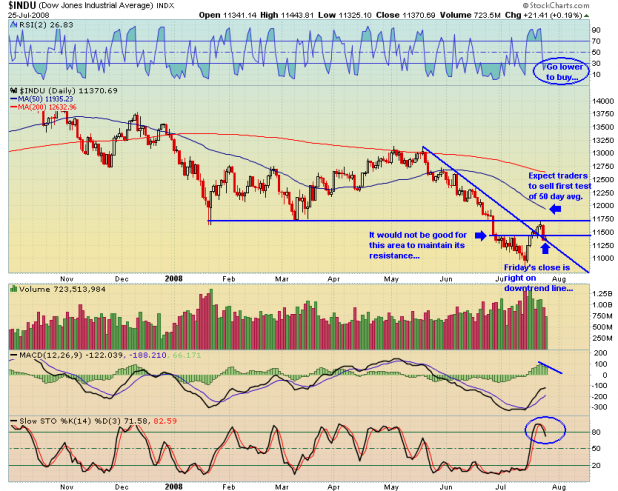
The daily chart finds the Dow closing right at the downtrend line, and just beneath July’s resistance. Both the MACD and Stochastics are suggesting the short-term, upside momentum is slowing. The daily chart shows that the Dow was rejected dead-on at the January and March lows. Remember, this area also corresponds to the 200 week moving average. Volume has declined as the Dow pulled back.

The only short-term, definitively bullish factor I can determine is the RSI(2) reading is nearing a buy signal.

Overall, the technicals are not really giving any clear signals as to near-term direction. The safe bet is to follow the trend, which obviously is down. However, there still stands a significant likelihood that the July lows will continue to be viewed as a bottom, meaning more money will flow into the markets. I suspect there will still be some shorts unwinding positions, should any strength become apparent. Should the Dow continue making its way upward, it will pay to be cautious with long positions as the index approaches 11,700.

Comments »

System Trading is Easy

I received man-sized gains today. Obviously, all one has to do is design a system, test the system, and then trade it. Any monkey could do it.

My positions going into today’s trading were

[[DXD]] [[TWM]] [[MZZ]] [[SDS]] [[FXP]]

This particular strategy account is now sitting at a new YTD high.

Just in case you missed it, this post is a follow-up to System Trading Is Hard.

Comments »

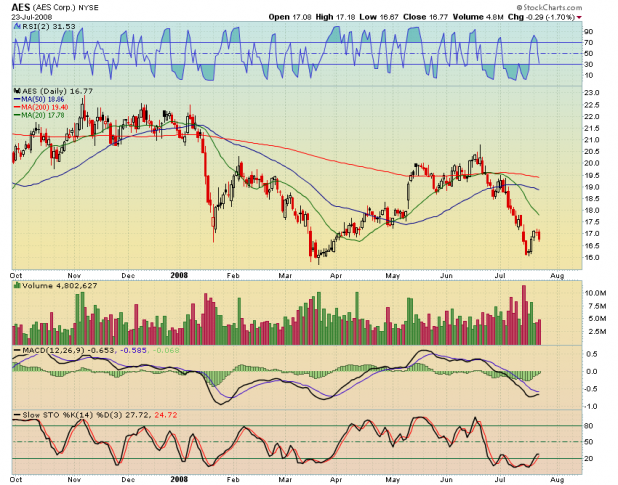
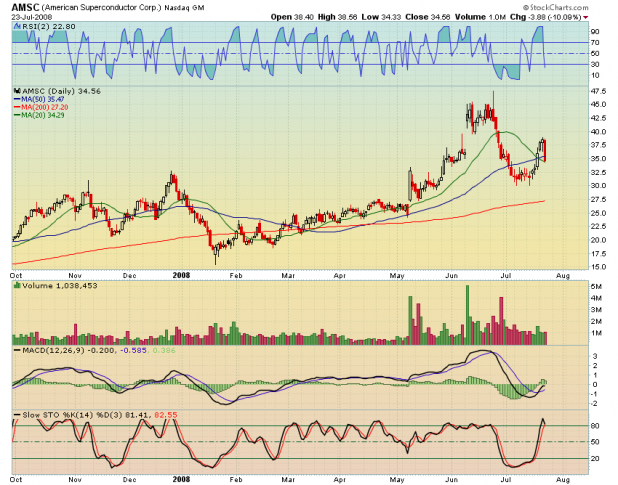
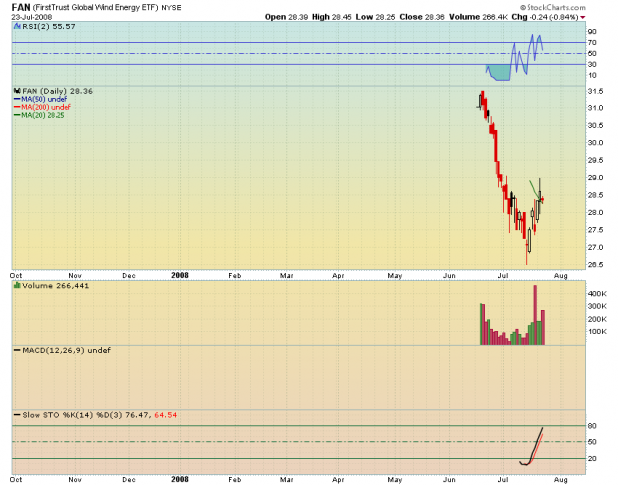
Let T. Boone Blow You

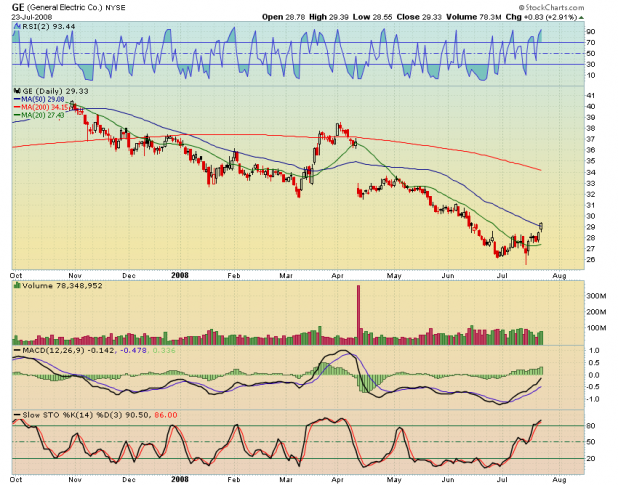
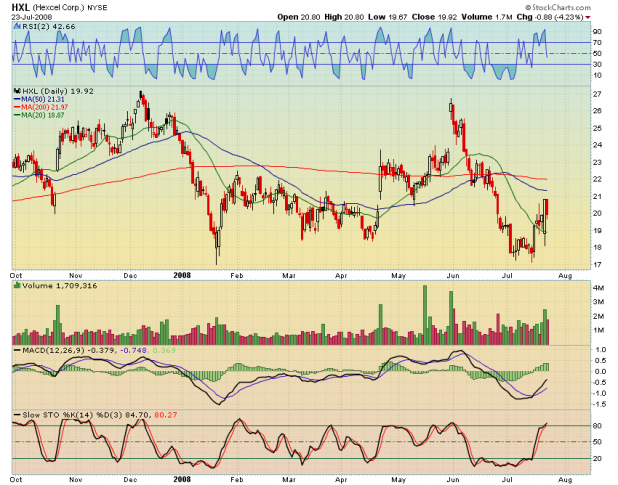
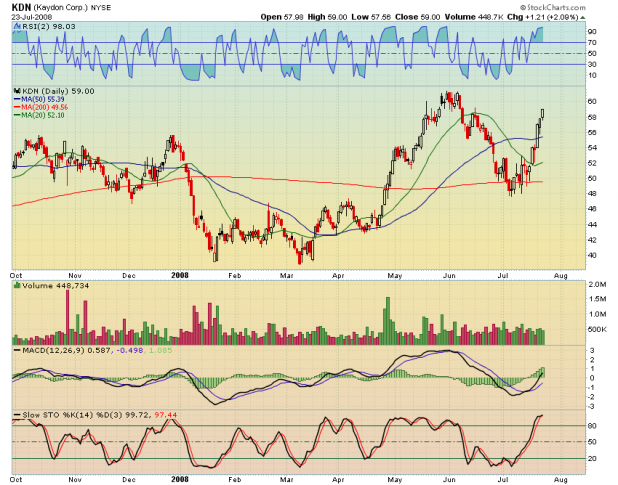
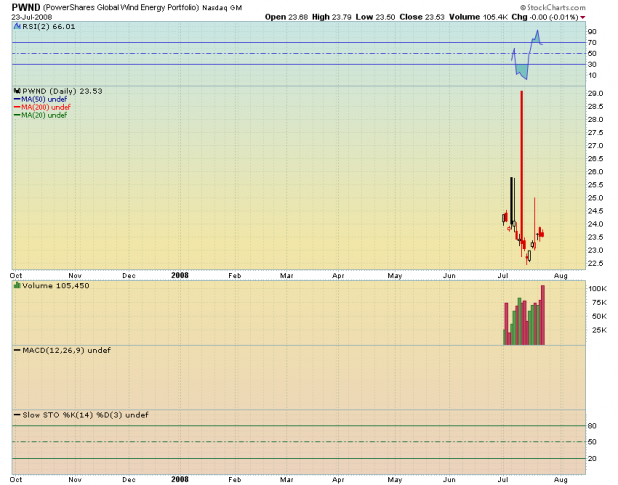
T. Boone Pickens has committed up to 12 billion dollars to build the world’s largest wind farm.

The following charts represent companies with exposure to the wind energy market. I have also included two new wind power ETFs.

[[AES]]

[[AMN]]

[[AMSC]]

[[FAN]] a wind energy ETF.

[[GE]]

[[HXL]]

[[KDN]]

[[PWND]] another wind energy ETF.

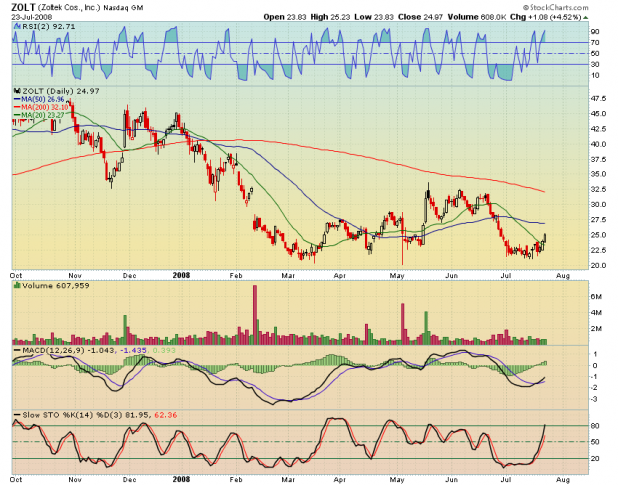
[[ZOLT]]

Comments »