iBankCoin
Joined Nov 11, 2007
1,458 Blog Posts

The Most Simple Trading System Ever Devised

And I bet it has outperformed 99% of all traders over the past 2 years.

Annualized, over the past 2 years, the system has returned 47.33%

Here are the rules:

1. If the close is below the 2 day moving average, buy the SPY.

2. If the close is above the 2 day moving average, sell the long position and sell-short the SPY.

Below is the equity curve. The first trade was on 1/05/07.

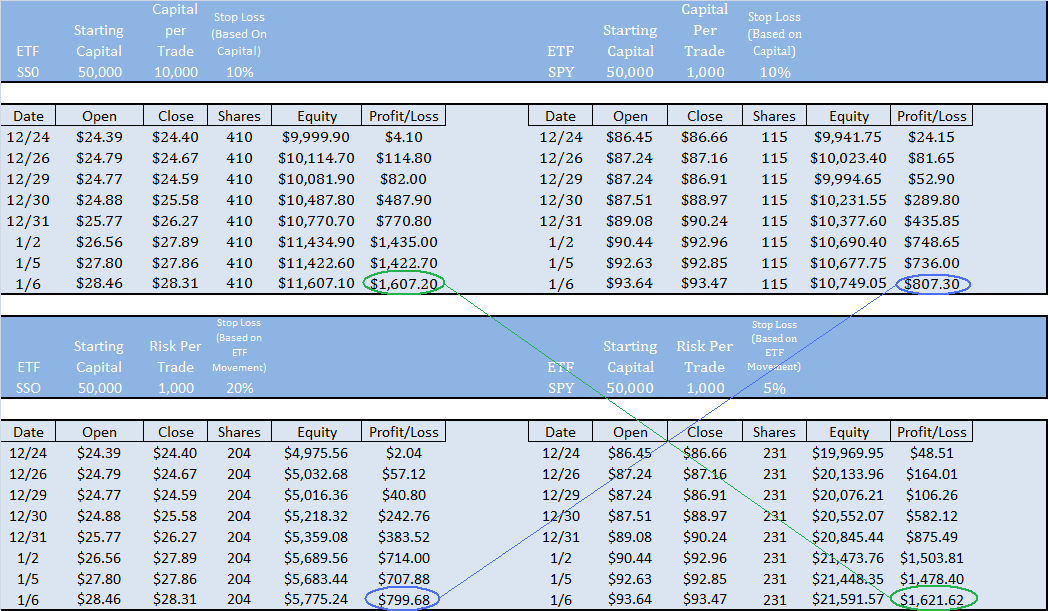
And here are all the trade statistics. Assume $10,000 in starting equity with net profits added to each trade (gains are compounded). Commissions of .01 / share are included.

I am not recommending this as a viable system. Instead, I think it does a good job of detailing the type of market conditions we have experienced over the past 2 years. Furthermore, I think it may have some important implications for the future, in regards to what we should expect in terms of the changing market conditions.

Specifically, how can the market get any more short-term mean reverting? The only way I can see it could become more short-term is if it scales down from a daily basis to an even shorter time frame. What about a moving average based on hourly bars? It could certainly vacillate around a 2 hour moving average.

Instead, I believe that at some time over this year we will see extreme short-term mean reversion begin to fail and the re-emergence of short-term trending conditions. Based on this theory, moving average mean-reversion strategies will have to be built around longer moving averages. Similarly, short-term momentum and maybe even breakout strategies may begin to perform, once again.

What this could look like is watching for breakouts to pullback to the 10DMA, before buying (remember how well the 20DMA used to work for buying pullbacks?).

Certainly these volatile, mean-reverting conditions can remain for a long, long time. But when the 2DMA optimizes as the best moving average to use for buying and selling price crossovers, over the past 2 years, it seems as if conditions cannot be drilled down much further.

I am also including a shot of of some of the recent trades the system would have taken. The 2DMA is included. LE=Long Entry and SE=Short Entry.

Feel free to leave any thoughts about the implications of this study in the comments section.

Comments »

Short Signal? VIX Stretched 15% Beneath 10 Day Average

The VIX stretch setup is simple. When the volatility index is stretched x % above or below a moving average, a trade is generated.

My testing shows a stretch of 15% or more beneath the 10 day simple moving average suggests a reversal is near.

As the VIX moves inversely to the indices, a stretch beneath the moving average means the trade would be on the short side.

The following sheet shows the results of shorting the SPY on the open after the stretch occurs and covering X days later.

The testing covers 10 years worth of SPY history, but there were only 21 total trades. The setup achieves over 75% profitable with a profit factor greater than 4 within a couple days.

By day 6 (which really means the trade is exited 7 days after entry) the percentage of profitable trades begins to decrease and the max intraday drawdown begins to increase.

Today the VIX closed at $39.66 and the 10 day moving average closed at $47.15

$47.15*.85 = 40.08. Thus, the VIX close is stretched more than 15% beneath the 10 day moving average. The system has signaled a short entry on the SPY tomorrow morning.

Comments »

Patience Will Pay Dividends

Remember that when your favorite stock cuts theirs.

I think the rally currently underway in the after hours market (S&P E-minis up ~2%) will run for two to three days, pushing the indices into extreme overbought levels. Still, I do not want to get long here. I also do not want to be short, yet.

Recently completed testing on the SPY, going back through all data available on the ETF, shows a ~78% chance that the market closes beneath today’s close, in the near future. The average winning trade would last 9 days. I like them odds, but do not relish the idea of a 4 or 5 day drawdown, as the market rockets to the top of its recent range, before pulling back.

I think there is a good chance that the market gets pushed into extreme overbought levels due to the enthusiasm surrounding the Bad Bank setup coupling (pun intended) with the Econdomic Stimulus (that’s not a typo). If this occurs, revisting this study may help determine a profitable path over the next few days: Floating Relative Strength: Bears Have the Edge. Jeff Pietsch also gives overbought markets a good treatment here: RSI-Mon Says ~ This Pullback Was Way Overdue!

Bottom line, the market has been basing for long enough that this next move may be rather explosive. With the 10 Period Average True Range on the SPY reading 3 points, the markets could easily move 1.5 ATRs tomorrow, which would mean a SPY close near $89.00 (885 on the SPX). I do not want to be short for that type of move. I also do not want to be long because as sure as I hate American Express for getting my tax dollars for their bailout, there will be a pullback.

Comments »

Bet Small: Survive and Thrive

When the market is range-bound and whipsawing I find it more productive to read and do research about trading rather than practice trading in a difficult environment. While searching around the web, I recently discovered some research about position-sizing, as well as another blogger’s informative post on the subject.

The following research is a must-read. It measures how position-sizing effects trader performance when trading a system with positive expectancy. In other words, when trading a winning system, bet-size will determine whether one survives, thrives, or goes bankrupt.

Position-sizing Effects on Trader Performance: An Experimental Analysis

“One purpose of this study was to find evidence for the importance of position sizing. The results showed that in order to survive trading in a simulated stock market, using a trading system with expected value of < 1.0, one should take positions in sizes of approximately 3.7% – 6.6% as the surviving traders, rather than 22.9% – 23.7% as the bankrupt traders. Further, to be able to increase one’s account over the long run and actually make money by trading the simulated market, one should not risk much more than 6% as the winning traders did on an average (2000, Ginyard, pg. 20).”

I encourage taking the time to read the research in order to understand the experimental design.

The second piece I discovered is on Max Dama’s blog: Position Sizing Monte Carlo Analysis.

Max takes a positive expectancy system as described by Van Tharp in the November, 2005, Active Trader magazine article Meeting Your Trading Objectives with Position Sizing and models it in Excel. His results may challenge some assumptions about bet size.

Max writes, “Since it’s a Monte Carlo model the results are random, but here’s a typical set of results:”

“The charts on the left model a group that risks 16% of capital on each trade, the middle is 8%, and the right models the results of a group of individuals who risk only 4% per trade. The top row of charts are the ending money of each individual in the group, and the bottom charts are the average capital of all group members after each marble comes up.”

“It is not surprising that the number of people in the red (below the starting money) is the most for the group that risked the most and the least for the most conservative group on the right. What is surprising is that the group of people who risked 8% had among them more big winners (dark green) than the 16% group, which had none (no dark green on the pie chart). So you can actually win more by betting less, and therefore lasting longer.”

Please visit his blog for the rest of the article as well as a link to the excel spreadsheet he created to model the system.

Comments »

My Thoughts on Using Stops

After reading Hanna’s post , Stops Part 1- When Not To Use Them, and Swan’s post, Stop It With the Stops Already, I thought I’d briefly jot down some of my feelings on using stop losses.

1. Anyone who has been trading for less than 1 year should use stops.

2. Stops should be used when trading common stocks due to the risk of a catastrophic loss.

3. Stops may not be neccesary when trading strategies on the indexes or some ETFs.

4. The size of stops and win percentage: As the percentage stop gets smaller, the number of losing trades get larger.

5. The size of stops and opportunity: As the percentage stop gets smaller, the number of opportunities get larger.

6. If a system has both positive expectancy as well as many opportunities per year (n > 150?) using stops will allow the trader to forecast a more accurate expectation of performance going forward.

7. In order to use stops appropriately, one must consider the following: 1. The time horizon (longer-term trades require larger stops); 2. The volatility of the instrument being trading (higher beta instruments require larger stops); 3. The historical maximum number of losers in a row. If one is sizing stops to a percentage of account size, and 10 losers in a row is possible, then the stop amount should be sized such that 10 losers in a row will not result in ruin, or in an extreme drawdown.

8. If one is not using stops, the exit rules must be quantifiable and known before entry. If not, the worst elements of trader psychology may overwhelm the psyche and cause the exit trigger to be pulled at the worst possible time.

9. One of the most simple yet very effective stops is the time stop. If using a time stop, be sure the rules are specified before entry, or risk being overwhelmed by fear, which may result in pulling the exit trigger at the exact wrong time.

That is all I can think of right now. I will add more in the comments section as they come to me. Feel free to add your own thoughts there as well.

Comments »

Money Management and Leveraged ETF Trading: Part 3

I have attempted to establish that traders who take the same position sizes in leveraged vehicles as they would in common stock or non-leveraged ETFs are actually just doubling their risk, unless they manage that risk by adjusting their position size to fit with the leveraged product. Part 1 and Part 2 have established that it is possible to keep similar levels of risk across leveraged and non-leveraged vehicles.

The spreadsheet below shows a series of winning trades.

Note that I have changed the sheet slightly from the format of the sheet posted in Part 2.

The top row again shows a 10K trade, risking 10% of capital, in SSO and SPY. As expected, the leveraged SSO returns double the SPY. Keep in mind that if these trades were losing, SSO would also lose money twice (or even faster) as fast as SPY, while still requiring the same amount of capital.

The second row shows the same trade in SSO, but this time the SSO stop is based on the volatility of the diETF. This allows one to keep risk the same as in the SPY trade ($1,000) but requires only half the capital.

The lower right quadrant shows how to leverage with the SPY, while keeping risk the same as with SSO ($1,000 risked). This is accomplished by reducing the stop on the SPY to 5% (maybe too small, but it is half of what is used for the upper left quadrant SSO trade), and using that figure to build the position.

My goal when I started writing this was to show how to use the leverage of the diETFs while keeping risk similar to levels expected with non-leveraged instruments. When these leveraged products are entered with a known edge, traded over a short time period, and position-sized to capture the leverage while not simultaneously doubling risk, they can be a valuable addition to any trader’s quiver.

I appreciate the comments left in previous posts. They have been very helpful, and I’ve enjoyed the discussion.

Comments »