iBankCoin
Joined Nov 11, 2007
1,458 Blog Posts

Markets Going Abnormal?

The behavior of the markets in 2008 forced traders to understand that markets can move much faster and much farther than they are “supposed” to. In order to avoid being caught long or short in a mechanical system trade during one of these abnormal periods, I’ve been working on abnormal filters for the systems.

An abnormal filter bascially just signals that the market environment is entering a period where it may become dislocated from what market participants would consider to be normal, based on historical standards.

Once the market enters one of these phases, it may be necessary to reduce postion sizes or even close out any position that is contrary to the filter (if the filter shows the market to be moving down abnormally fast, exit any long positions).

While I have not yet nailed down the exact parameters I intend to use in these filters, most variations of them are now showing that the market has already entered, or is close to entering an abnormal period. The previous time these filters would have signaled that danger was looming was in September of 2008.

Be careful out there!

Comments »

Money Managment for Leveraged ETF Trading: Part 2

When deciding how much to lose on a trade, or where to place a stop, traders use a variety of position-sizing methods to arrive at a position that works for their style and risk profile. One method I do not like is when traders allow the amount of capital lost to determine where the stop is placed. Below is how traders typically set up that type of position:

100K to invest. Put roughly 10% into each 10 different stocks, ETFs, etc. For each 10K position, the trader now decides he does not want to lose more than 1K, so he sets his stop at 10% beneath entry.

The problem with this method is that some trading vehicles are inherently more volatile than others. A 10K position with a 10% stop in an extremely volatile ETF (the double inverse financials SKF) will consistently rob the account of 1K when the stop is hit.

The extreme volatility should not come as a surprise; remember the leveraged ETFs are designed to move twice the DAILY return of the underlying. As volatility and leverage build on themselves, the multi-week or multi-month returns of these leveraged ETFs can be many times more or less than the return of the underlying.

But we must get back to our trader with 10% allocated to 10 trading vehicles, each with a 10% stop.

Why a 10% stop? Again, we are creatures of habit, and we like round numbers. It may be that many breakout traders use an 8% stop, due to the notariety an 8% stop-loss garnered in the publications of William O’Neil and Investors Business Daily. The point is the trader is still allowing the amount of capital lost to determine the stop level rather than the movement of the trading vehicle.

Since we know leveraged ETFs are at least twice as volatile as their underlying, and by extension, twice as volatile as much of the common stock constituting the index, shouldn’t any stop set for leveraged ETFs be at least TWICE the stop the trader would normally use when not trading leveraged instruments? If breakout traders allow a stock to move at least 8% before accepting the trade as a loss, traders using breakout setups on leveraged ETFs should consider allowing at least a 16% stop.

So what money managment strategies do we use to build a position around the movement of the trading vehicle rather than the loss of capital?

  1. First the trader must examine the volatility of the leveraged ETF. How far might it move against his account before the signal/pattern is proven to be wrong? In my personal trading of diETFs I find that 15% is about right, but for purposes of discussion and round numbers we’ll use 20% as the distance a diETF is allowed to move against us before stopping out the position.                
  2. Secondly, the trader must pre-determine what percent of his or her overall account value to risk on this trade. If meticulous records are kept, he may determine that he has a very high winning percentage, and is therefore willing to risk 3% on each trade (50K*.03 = $1,500 a trade risked). For purposes of simplicity and round numbers, we’ll use 2% as the amount of total equity risked on each trade (50K*.02 = $1,000)

Below is a spreadsheet showing recent trade sequences for two ETFs: The Proshares Ultra Long SSO (which is supposed to move twice the daily amount of the S&P 500 index) and SPY, which is the unleveraged tracking ETF for the S&P 500. Both money managment methods (position-size built on capital loss, and position-size built on movement of the trading vehicle) are represented in the sheet. The ETF is assumed to be bought on the open of 1/6.

The upper half of the sheet show the results of buying 10K worth of SSO and 10K worth of SPY, using a 10% stop (limiting capital loss to $1,000). As expected, by 1/16, SSO has lost twice as much as the SPY position, even though both positions started out at 10K. The stop in SSO was hit on the 4th day and the stop in SPY was hit on the 7th day.

The upper half shows that the leveraged ETF did nothing except double the risk for the trader.

The lower half of the sheet shows what happens when the trader builds a position based on the movement of the leveraged ETF. As these are volatile, his stop will be hit when the ETF moves 20% against him. He is still risking $1,000 per trade, as he was in the upper half trades.

He builds the position like this:

On 1/6, he uses the opening price to calculate the 20% move ( $28.46*.20 = $5.69). He then divides the amount he is willing to risk by this figure ($1,000/$5.69 = 175.74) He would then buy 175 shares (I always round down.) This results in him buying a position that is roughly half the size he would buy if he was using the other method.

On the spreadsheet above, note the figures circled in green. The lower figure is half the amount of the upper figure. Now note the figures circled in red. The lower figure is almost the same as the upper figure. In essence, money managment has captured the leverage of the ETF while keeping the risk at levels associated with trading the non-leveraged ETF.

Pay careful attention to the figures circled in blue. Note that the leveraged ETF position-sized using a capital loss method would lose over 4x more in 9 days than the non-leveraged SPY, even though both were initially risking the same amount ($1,000).

In Part 3 I’ll show a winning trade series using the two different money managment techniques and then present some closing thoughts.

Comments »

Money Management for Leveraged ETF Trading: Part 1

The trouble caused by the leverage and fees inherent in the diETFs is still a hot topic. Since it seems these ETFs make it even easier to lose money, I thought I’d discuss the money management strategy I use when I trade them.

I have a suspicion that many investors do not understand how the combination of leverage and volatility affects their returns. I hope common sense dictates to investors that they stand to lose money at least twice as fast as they would if they were not trading 2x leveraged vehicles. And while losing money twice as fast as normal seems more intuitively risky, I’m not sure that traders are using the money management techniques necessary to benefit from the leverage while simultaneously managing the risk and volatility.

I believe that investors are creatures of habit; thus, I think that it is likely most are using the same position sizes with these leveraged ETFs as they would with a common stock. (And why not? They trade just like a stock!) For example, an investor has an account worth 100K and spreads it across 10 stocks with 10K in each issue.  The same investor may buy shares in a 2x leveraged ETF and use the same 10% capital allocation as he would if it were common stock. And why stop at one position? Why not allocate 50% across the various indexes and sectors available?

Money management techniques can be used to capture the volatility (assuming one is on the right side of the trade) and use the leverage of these ETFs while maintaining risk at levels expected without the use of leverage.

In Part 2 I’ll show the results of two different money management techniques applied to trade-by-trade sequences in SSO and SPY.

Part 2 is now finished: Money Management for Leveraged ETF Trading: Part 2

Comments »

Using the VIX to Trade the SPX

Gio has had much success using the VIX as an indicator of market sentiment. He will often mention when the VIX spikes and dips and will use those spikes and dips to know when to switch from a long bias to a short bias, and vice-versa.

I thought it might be interesting to test a basic system for using the VIX to suggest when to go long or go short. Doing so will allow us to propose a rough quantification of what constitutes a tradeable dip or spike.

I’m sure that there are others in the blogosphere that have studied the VIX as a timing mechanism. When I have more time, I’ll link to the studies assuming I can find them. Feel free to post links in the comments section.

Below are the results of the study.

The first report show the results of selling short the SPX after the VIX has closed more than 10% beneath its 10 day moving average. ***I just realized the rules for the short entry should state “buy to cover X days later” and not “sell X days later.”

The second report shows the results of going long the SPX after the VIX has close more than 15% above its 10 day moving average.

What is immediately obvious is that the VIX has been working well as an indicator of overbought conditions. The setup has generated short sell trades of which 75% were profitable looking out over 6 days after the entry. The max intraday drawdown is about 2.5x the average trade. The win/loss ratio shows the winning trades are 2.5 to 3x larger than the losing trades.

On the long side, the edge is diminished very quickly. By the 4th day after entry, the percentage of profitable trades drops to 47%. Negative expectancy is produced by holding until the 7th day after entry. The win/loss ratio is not nearly as generous as it is on the short side, and the max intraday drawdown is averaging more than 20x larger than some of the average trades. In other words, the risk may not be worth the reward. Adding a stop loss and some additional code to keep out of longs during a cascading market would probably improve these metrics.

Conclusions: As Gio has highlighted many times, using the spikes and dips in the VIX can create a tradeable edge. This edge can produce 3x more winning than losing trades. This edge is currently much stronger when using the VIX to indicate an overbought market.

Caveats:

This study is looking at only 2 years worth of data. I chose a short time frame because this system did not really do much of anything until the volatility ramped up in 2007.

During all of 2008 and part of 2007 the SPX was in a downtrend. That may explain why the short setup has out-performed the long setup.

I did not add commissions or slippage into the calculations. This is more a proof of concept.

For the Visually Stimulated:

The screen shot above shows the VIX in the bottom pane and the SPX in the upper pane. The blue line is the 10 day moving average. Notice that a buy signal was issued Wednesday for this (Thursday) morning.

Finally, for all things VIX, visit the ultimate VIX blog, Bill Luby’s VIX and More.

Comments »

Will the Big Bamboo Ever Trade Again?

What a disappointment. I was having a lot of fun tracking the system. Just when everything is set up for it to begin buying the double long ETFs, the “healthy pullback” has morphed into something that is beginning to look like a 50 foot slide covered in baby oil, which bottoms in a pool full of severed, sharp, bull horns.

The system will trade again. Honestly, I need to put more time into developing the trend component. I can probably make the system more responsive to the trend, which means it would be trading more often during a somewhat sideways market. However, getting more opportunities could be a double-edged sword. What should be considered is that the Bamboo went almost a month being unable to discern a clear trend. When it finally became bullish, it did not get the pullback it was looking for, and so it never made a trade. While I intend to tweak the trend component over the next few weeks, the system may be doing exactly what it supposed to do, which is to keep us out of the market when there is no edge.

The Big Bamboo is currently looking for several up days (basically, it wants to see a tepid dead cat bounce) before going long the diETFs.

As for me, I’m long SSO. Another day like today and my position will be stopped out.

Anyone using oversold oscillators (RSI, Stochastics, CCI, %R) for entries should be prepared to exit their current positions due to impending abnormally oversold conditions. As much as I don’t want to sound alarmist, I am a tad bit worried about another repeat of October and November. While it is always tempting to buy oversold markets, what has been working has been to skip the long side entirely and just short the market when it gets overbought.

Comments »

Breakthroughs, and the Leveraged ETF Saga Continues

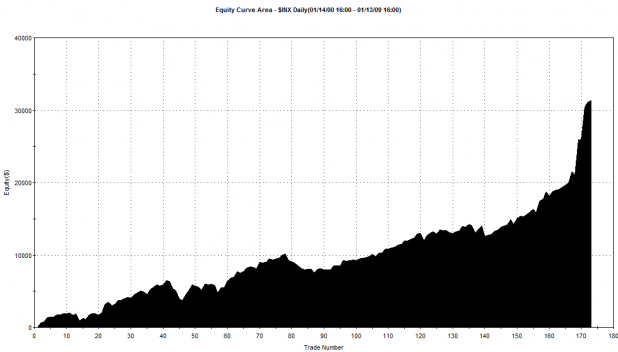
While I wanted to write a blog post tonight, I got started re-tooling a strategy that has been in development for quite some time. The strategy was very promising but it was having problems when it encountered months like January and October of 2008. Tonight I found a solution, and it appears to be robust. Below is the equity curve over the last 9 years.

Keep in mind this strategy will be traded on 2x leveraged vehicles, but what is represented here is a chart of the strategy applied to the SPX. (Double the results for the leveraged vehicles).

Not being one to bleat my own horn without at least offering something for someone else to benefit from, I am linking to an article from Trading Markets. This article continues the discussion on the problems with the leveraged ETFs. These notorious ETFs even have seasoned veterans (The Fly) swearing to quit them, and then coming back for more. The following article is one of the best I’ve read on the subject.

Long story short, if you are a trader, these can be excellent vehicles. I consider them money trees. I finished positive for the year last year trading them almost exclusively. However, if you are not a trader, or to be more specific, not a swing trader, the article will explain why you should steer clear of the leveraged ETFs.

What Can We Learn from the 2008 Leveraged ETF Collapse? Part 1

Comments »

Time to Look Long: Consider some Pullbacks

Could the market experience a swift and severe move to the downside similar to January and October of 2008? Certainly it could. More likely though is that the indices are going to gyrate up and down, within a range. It appears to me that we are near the lower boundary of the recent range. I am looking for some strength over the next several days.

However, in a bear market, anything can happen. Thus, positions should be small, and stops must be applied.

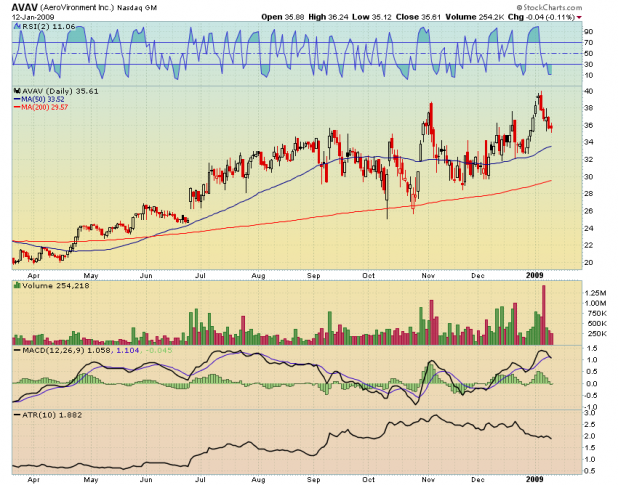
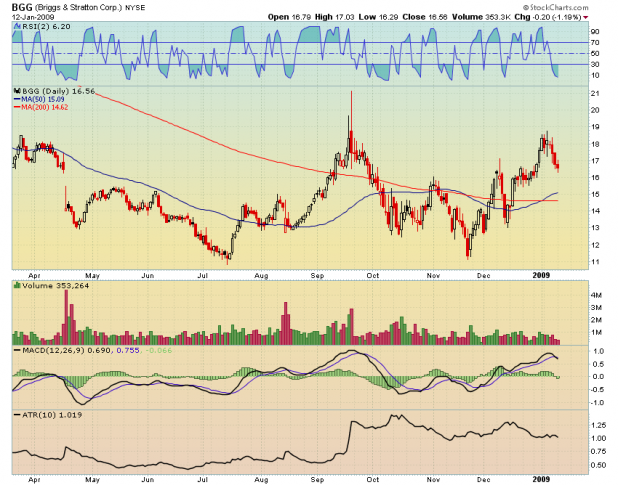
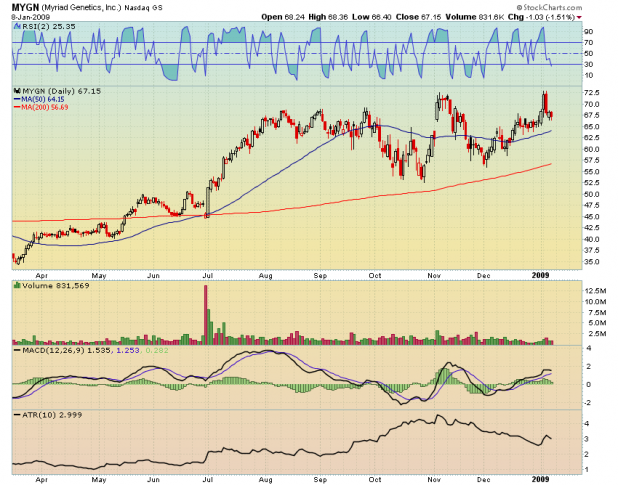
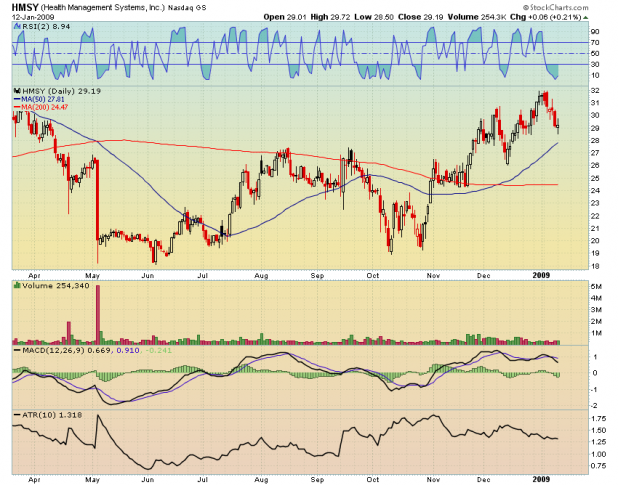
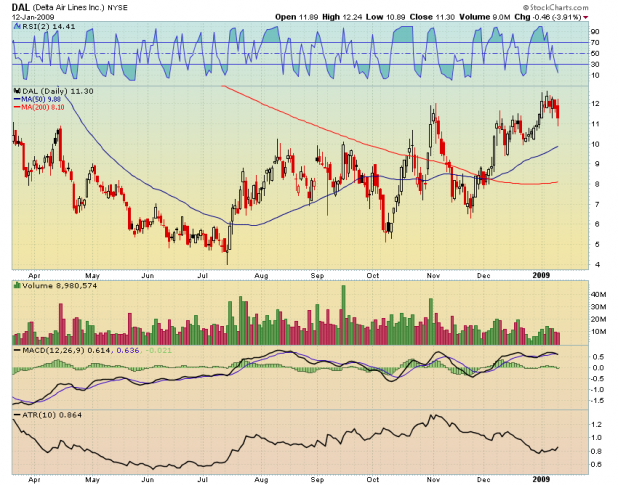
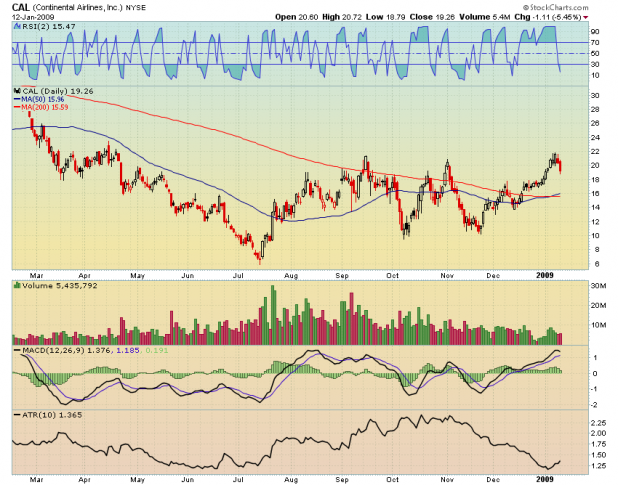
Should the markets gather some strength here, the following stocks should respond favorably. They are showing excellent relative strength, but are short-term oversold.


Comments »