iBankCoin
Joined Nov 11, 2007
1,458 Blog Posts

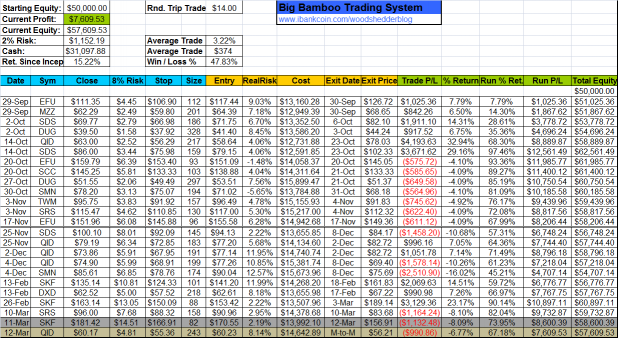
Big Bamboo Will Add 2 diETFs on Monday’s Open

The QID position came within a nickel of stopping out on Friday. It is marked-to-market as of the close and within .5% of stopping out.

The system has selected five diETFs to enter, but the rules will allow only 2 trades on any one day. The other ETFs were TWM, MZZ, and EFU. I would not trade EFU due to the awful slippage I have experienced in the name. MZZ is getting more liquid, but is not nearly as liquid as the other diETFs. As the system trades the open, liquidity is a huge concern.

With QID, SDS, and DXD, the Bamboo will be almost all in, and will have all major indices shorted. Another 4% up on the SPY will take it over $79.00 and leave it under $80.00. The SPX 790-800 levels, (SPY $79-$80) looks like strong resistance, but these diETFs may stop out before resistance puts a halt on the recent advancement.

Since November 15, 2007, the Bamboo has closed 90 trades with 78% of those being winners.

Comments »

Thank God, No More BB Signals Tonight

Highlighted in battleship gray is the SKF trade that promptly stopped out today. Beneath it in tan is the QID trade that looked good last night, but looks awful now. It came within half a point of stopping out.

Ugh.

The Big Bamboo has an 81% win rate, since 12/31/2007, on 78 completed trades. It does not seem to be firing on all cylinders though over the last 23 trades. It seems that only good position-sizing is keeping the Bamboo afloat right now.

Maybe the markets will gap down a bit and QID will survive to fight on Monday.

Comments »

Bamboo To Add diETF on Open

Highlighted in a weird camo color is the diETF to be purchased on Thursday’s open.

The soothing lavender (Fly’s favorite color) shows today’s purchase of SKF marked-to-market at the close. It came within 4 points of stopping out, but the candle formed a nice doji and volume dropped slightly. Although the BB entry has no RSI component, I like the RSI2 under 10. All in all, the entry looks promising.

QID also formed a little doji candle on decreasing volume and is hovering above support. I think the setup up is visually appealing. We’ll see how it works out.

Any ideas why the volume in QID has dropped off so dramatically? I wonder if it could be due to all the negative publicity these 2x levered ETFs have received.

As always, the 8% stop used in the spreadsheet is calculated using the close. The opening gap up/down often moves 2-4% from the previous close, and so it is imperative that the previous close only be used for position sizing purposes. The stop MUST be set on the actual entry. This means that positions will never be sized perfectly as one is setting the number of shares to buy using the previous close, not the open, unless there is the ability to adjust the number of shares to buy based on the pending gap up/down. Should QID gap up tomorrow, the system will be purchasing a larger position than planned.

Comments »

System Death Wish

Highlighted in a dull gray is the SRS trade from today. The trade lasted fewer than 30 minutes before getting stopped out. If you’re gonna toss 1K into the system education jar, its always better if it is done and over quickly. Nothing worse than having the trade hover near stopping out for a couple of days before finally hitting the stop.

Highlighted in a pleasant peach (Danny’s favorite color), is the SKF death-wish trade. The system will go long SKF, at Wednesday’s open.

With a system win/loss rate of 50/50, who knows how this trade will wind up. I can say without a doubt that the SRS trade felt wrong and this SKF trade feels even worse.

Comments »

Big Bamboo Wants to Short Real Estate

Highlighted in a pleasing green hue is the latest signal issued from the Big Bamboo mechanical system.

An 8% stop will be used and will be offset from Tuesday morning’s entry price.

Comments »

First Attempt at Pivot-Based System

Carsten’s post about a simple pivot-based trading system was intriguing to me mainly because I have never tried to code such a system. I guessed that coding a proof-of-concept of the system would be pretty easy, and it was.

Here is the code for Tradestation:

inputs:
ATRLength( 10 ), // I used Average True Range as a substitute for Carsten’s “volatility.”
Length( 10 );

variables:
ATR( 0 ),
S1( 0 ),
R1( 0 ),
PP ( 0 );

ATR = AvgTrueRange( ATRLength ) ;
PP = close[1];
S1 = PP – ATR;
R1 = PP + ATR;
If close <= S1 then buy next bar at market;
If close >= R1 then sell short next bar at market;

If currentbar > 1 and marketposition = 1 and close = highest(close, 3) then sell (“LX”) next bar at market;
If currentbar > 1 and marketposition = -1 and close = lowest(close, 3) then buytocover (“SX”) next bar at market;

Here are the results and the equity curve. I assumed 10K starting equity, purchasing only one contract per trade, with no compounding of gains.

Not bad for a first pass. The equity curve is not nearly as nice as Carsten’s version, but again, this was more for practice than anything else.

Below are some recent trades:

Caveats:

I know very little about pivot points, how to calculate them, how to trade them, etc. I need to do much more reading on the subject.

I also know very little about trading S&P E-minis and need to complete more study on trading them as well.

This system can obviously be improved. Right now it suffered some large drawdowns and was underwater for well over 100 trades.

I’m hoping the collective wisdom of the community here can help produce an improved V1.1

Comments »

More On the Pivot-Based Trading System

Turns out that BZB Trader also saw Carsten’s work on the pivot-based trading system.

BZB writes: “Supporting my on-going research into the value of pivots for forecasting market direction, Cucca recently sent me a link to one of Henry Carstens pivot based trading systems. Cucca also posted the code for a little MeClellan based system (in comments section of his blog) that produces some impressive results.

Henry’s pivot aproach is worth a look and I’ll probably be deconstructing the system later in the week as I explore more pivot based mean regression systems. Henry doesn’t explain exactly how “volatility” is defined, so I’ll just jump in and offers some suggestions.

Today’s offering is a variation of my earlier SD signal line study and simply looks at the value of the PP buffered by a lookback at a Len1 moving average of the PP and converted to a zero line value by dividing the resultant by the stadard [sic] deviation of the range.

Later this week I’ll look at the same theme using the R1-S1 pivot range as well as several other permutations.”

Read the whole article here, including the Tradestation Code: Mean Reversion Pivots

BZB also submitted another piece on this topic here: Pivot Range Reversion

Comments »