You do realize the extent of this rally falls not totally on the macro or fundamental argument, but mostly on exposure, sentiment, and positioning, right?
Do you understand why the correlation to 1998 (which has the highest correlation coefficient I’ve seen) was not hinged so much on what went on in the world at the time, but how people felt about the world, and what they did with their money in response?
The best indicator I’ve used during the whole process here? Cash.
We spoke of this a few months back, but the Global FMS Cash Indicator hit an EXTREME this year. That means that there was more cash available to be deployed if the opportunity presented itself.

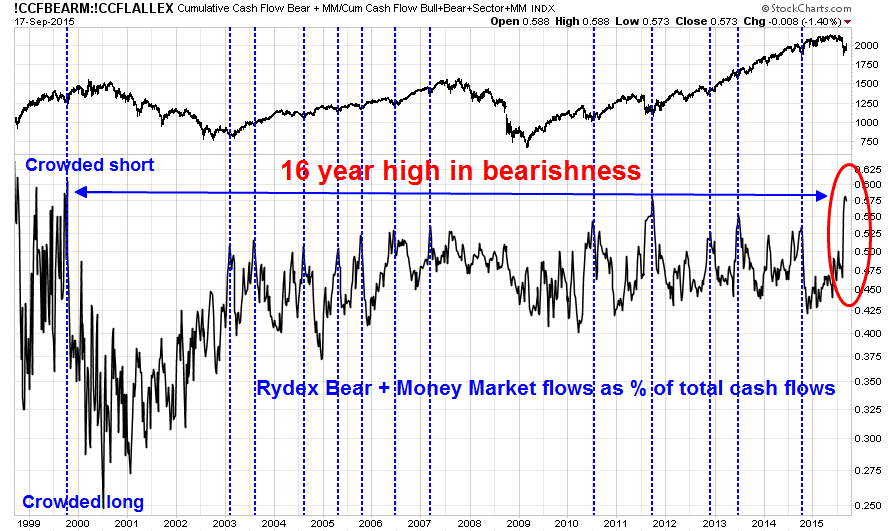
What if high cash levels were waiting for a market dislocation to present an opportunity, rather than to predict a crash?
I’ve posted my arguments on many occasions that this is simply what is happening. This is why you are seeing late 90’s price action in some big name stocks too.
The higher this market goes, the greater the need to deploy that cash, a la 1998.
The reason the charts have such a high correlation? Price is a reflection of behavior.
Forget the similar headlines. Pay attention to the behavior.
I gotta tell you, today’s action is the most constructive part of the last 6 weeks of analysis. The arguments are about to grow very quiet around here.
OA
If you enjoy the content at iBankCoin, please follow us on Twitter


LABU 🙂
JOY to the world!
SCO and UWTI are not trading at their 2X and 3X exposure to the futures. OVX, oil volatility coming in this morning. Big move coming? I’m not sure. I’ve not seen SCO & UWTI trade like this before. Perhaps i have missed it in the past.
Using OA’s sentiment description it feels like the oil market is frustrating oil shorts who have the fundies on their side. Considering there is obvious fuckery going on with the 2X & 3X ETFs being suppressed relative to the futures, I am abstaining from trading around my positions today. Is that what the market wants? Less commissions !!!
In 1998 Russia went bust and the US had a huge sell off. Long Term Capital Management went bust too. So, I just don’t know how this year 2015 compares to 1998. Tech valuations in 2015 are near year 2000. Maybe you are right. Who knows.
Everyone is comparing the wrong stuff, IMO.
What you want is for everyone to compare the wrong stuff up until something approximating that NASDAQ move from the late 90s has occurred. If everyone was comparing the right stuff now, the analogue wouldn’t be presenting itself on the charts.
OA – what’s your target on $IWM for your $IWM calls position.
OA,
What’s a reasonable target for JMEI?
Were you there for the trade discussion?
Yes, but can’t remember.
The S&P also made a lower low on the second drop -23% in early October 1998 and then closed the year +35.7% from 923.32 to 1244.93. So, if logic on price up from October 1998 is comparable to 2015 only that part at least true ignoring the rest we got +25% more to close 2015 out. Hedge funds back then are not as complex as today let alone investors. By 2015 year end close we will all have a crystal clear view of actual price. Until then – this is all speculation as nobody knows the future.
The Russell took out the low. You have to realize that those August lows were prices that only machines got. But you are right, give me a holler at year end and we can chat then.
The most essential point: “but how people felt about the world”
I used to think that technical analysis was the stupidest thing in the world, before I understood what it was. Or at least how it’s used here. Living through a turbulent and challenging past 24 months in the market, and looking at a chart through the lens of human behavior instead of a bunch of moving averages and lines on a chart changes everything.
Is anyone long $GRPN?
You’ve been a damn Jedi these last few weeks, OA. Thanks for congrats.
Underwater a bit in TWTR. Profits in JD and ATHM. Started FCX this morning.
Thanks AND congrats, I meant.
Nailed it Jeff it’s always all about the money. But todays new faceless avatar knows better
great calls, sir! killing it! I have to ask… what are your thoughts on VRX? My hunch is why bother when there is so much other opportunity out there, but figured I’d ask nonetheless.
I avoid things like that. They tend to draw a lot of people in. I hate that.
Figured as much. Thanks man.
ok. I guess I am a pu$$y but had to sell half my LABU position after today’s run. I know OA called for $25 in that name but just felt to be prudent. Will probably regret this.
Never regret a win. I’m still pissed I capitulated back on 10/20 when biotech got hammered. I had a really good winner too. I’ve learned you need to have a short memory in this game.
good point. forget and move on to the next. ample of opportunities in a market like this.
I had a $12K position on $LABU with average cost basis of $16.21. I’m nauseous looking at $LABU today.
OA,
I am just curious. Did you manage to catch the 2015 correction spot on?
Could you elaborate?
Sorry, the top of the market back then was 2130-2080 from approx Jan to July 2015. The range busted on Aug 18 to Aug 25(Tons of analyst are calling that the FLASH CRASH). Did you short the market early Aug and catch most of the 13% drop?
No. I was pretty light for that. Only one hedge against some busted calls and my LT stuff.
Looked at my screens. Listened to Friday’s AH w/OA. Can’t find anything I want to buy today. :/
Oh o.k – that was beyond difficult to catch. It will indeed be interesting on how this year closes. So many unanswered questions and so many analogies (1997-1998, 2000, 2011) floating out there. Somebody will be right…
I got it spot on from the 24th on. Every turn.
Great, I caught it up 2000+ but after that it got questionable and dicey to me. Either way. I have never seen a market with 20+ years of trading experience go straight up and NO pull back not even 2-3%. So again, this will be an interesting year – maybe one in the stock almanac book.
Went all in last week of September.
What about the rallies in 2010, 2011, 2014?
OA,
Do you play chess?
IBB is up 3.15% as of now but volume is puny compared to 10-day average. This concerns me. I’m taking my SAGE profits. Can always get back in.
That said… AXON looks interesting though up sharply today. Strong volume and busting thru trendline. Nice stochastics too if that’s your thing.
? Sure.
OA, won’t be able to make call tonite, I’d like your thoughts on QRVO. It looks like to me it is completing the aversion phase, your thoughts would be appreciated.
Shopping a couple of earnings lottos. These look to mostly fit the profile and report this week (shopping a stupid b-day lotto option for laughs):
-$TDC
-$CLNE
-$TERP
Wanted to look at 10% plus short interest to boot.
My original plan was $FEYE, but I’m not chasing 5.5% so it would need to come in some.
Out of HL from Friday +3.08%. Good start for the week and month.
S&P goes up no matter what….
Are you trolling?
Why did you ask if I play chess?
Not at all. I was just curious about your strategic background. So, it was only natural to ask if you play chess.
OA,
Just look at this chart on the SPX, for clarity I’m not a bull or bear really – but something is definitely questionable at this level to continue or trend:
http://a.disquscdn.com/uploads/mediaembed/images/2747/8130/original.jpg
Why is it questionable?
From what I know about technical analysis and indexes by John Murphy – New York institute of finance publication. The macd is to extreme and is exactly at the March 2000 high on the Spx. I have to check all the other indices but as far as I can see from just a quick view only Russell 2000 is still lagging. So even if we had to march higher here on the Spx we can’t go more than around +2% from here just shy of 2134.72. None of the world indices are near the US highs – so – Ideally for a bull continuation for 2 more years it would
have to have a decent size pull back(7%-10%) before going higher right now.
In trending markets, those indicators diverge. The first extreme signals the trend. As the market grinds, there are no extremes.
Ok – fair enough. Let us circle back when the weekly candle closes this week. I am still exhausted with 5 weeks of up move with no decent size pull back with short sneeze to panic buying and now euphoria. I think we should have a partial answer then on the real direction. Even Art Cashin said today the Santa rally could be slashed in half. That guy has been on the street for sometime so i got to at least hear him out.
What’s your end of year target of Spx?
Back in late September I said ATH by second week of December. I think trend here, so never gave out a #.
Wait…
as I read your comment again about “let us circle back…” am I debating something with you? Lol.
OK – 2nd week of December ath- let us see. I’m not debating at all. I just want to understand the market dynamics we are currently in. My guess is it’s going to surprise both the aging 6 year Bulls and the bears who hardly showed up since 2011. In trading its not how many market calls you can make – its how many of them play out imho. Further it will be interesting how the next few weeks candle closes and the month. If the next 2 weeks below 2040 then a major decline 15% should be in the cards. In physics – for every action there will be an equal and opposite reaction.
But yeah, no need to debate it here really. I’m set as far as positioning. Went all in at the lows.
If you like a market pullback here, hope you nail it.
The real reality is all the technical charts may not be telling the total picture at the moment. Hardly anything technical is working now. Let us wait!
Thanks OA!
“The real reality is all the technical charts may not be telling the total picture at the moment” that’s exactly what this blog has dialogued for over the last two months.
I just started reading your blogs within the past 2 weeks just to gain additional market perspective. I am just not convinced that we will continue higher and take out 2134.72 and hold it for that matter because a 10 month topping pattern(Rounded Top) was formed in late 2014 to July 2015 – so for this to go on for the next 2 years(16-17) using your 97-98 analogy to go on 99-00 before we either melt down or go bust(which the Central Bankers won’t allow to happen) just doesn’t add up – for instance just the S&P up 200%, Nasdaq up 320% since 2009 just is way over kill – people got to take profits – i don’t care if you are buffet you need to the money for that obama care package. This is all probably about the DAX but who knows.
Thanks for your input OA!
Yeah man, we’re on two separate planets. Good luck bro.
How long you been trading?
Further, price now if it can continue higher on the S&P should get rejected at 2,114 and then break down to at least 2,000. That is not to much to ask mate!
Options only 3-4 years. Regular stocks almost 15-20 years actively. So I sat through difficult market cycles.
I will check back as the next few months develop. Something has to give up or down.
Thanks for taking the time to write back OA!
Oh and one last thing. At this rate NASDAQ and NDX 100 will have reached all time highs within days assuming the S&P and DOW can play catchup before year end. The only question would be the Russell 2000 would have to go 10% from here. Very interesting times.
Yes, these things I am very aware of.