In most weekly updates you will bear witness to Le Fly bragging about his almighty Exodus, laying waste to the minions of low-leveled, low-brow’d, cocaine addled stock traders. On this occasion, you get to behold Le Fly, as he’s formally addressed in France, devour some humble’d pie.
The XLE trade that I’ve partaken in has been an unmitigated disaster. I wouldn’t declare it to be of the first magnitude, or even the second, but definitely of the third magnitude.
For the record, I was only supposed to partake in systemwide oversold signals this year. The last one being a month ago.
I am going to use this occasion to show you how the system adjusts and learns new levels from which it can potentially provide profit off from.
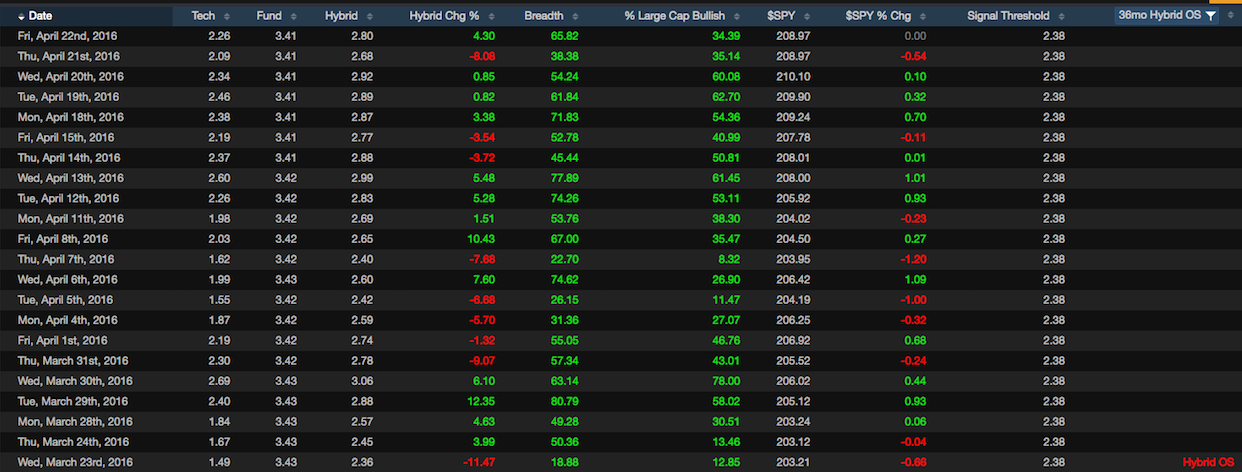
Notice how the tech OS score for XLE has been adjusting during this gorilla run to the upside?
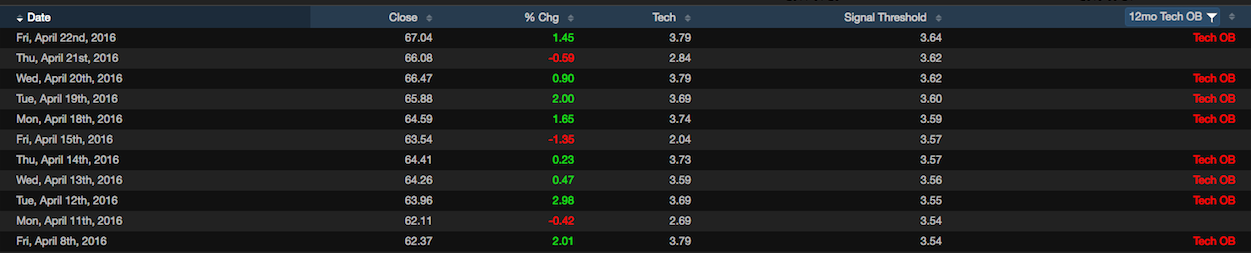
The technical scores are produced by ranking acceleration/dist, price performance, relative strength, volatility and volume. In addition to that, the scores are greatly influenced by real time movements in the price of crude. The oversold/overbought status of XLE is based upon a moving average that is adjusted over time, which is why we have 3,6,12mo and historical all-time algorithms. As the price of XLE moved higher, unabated, the technical score OB threshold was raised and raised and raised some more. Eventually, the score will reach a point in which it will represent a true level to pivot off from. In the future, this score will represent an albatross for the ETF and it can be readily shorted upon seeing it.
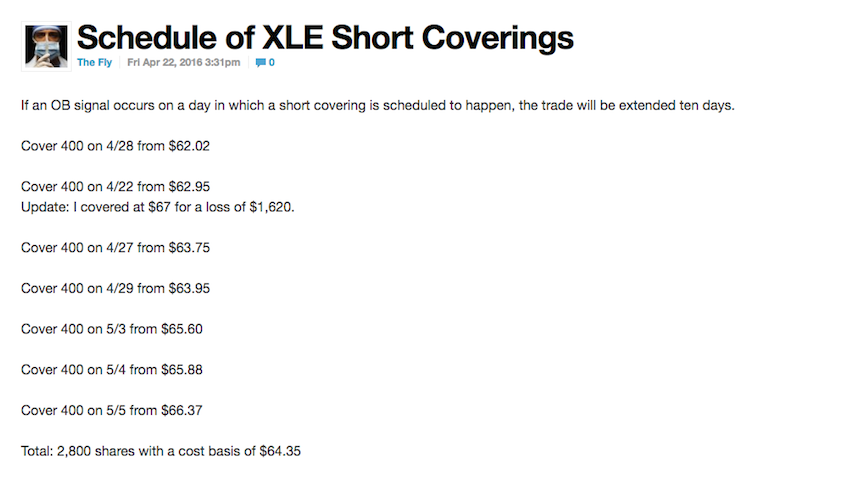
In the meantime, crude continued to short squeeze higher. My risk is mitigated by the holding period designated to each trade of just 10 days. Here is my schedule, as posted inside of Exodus.
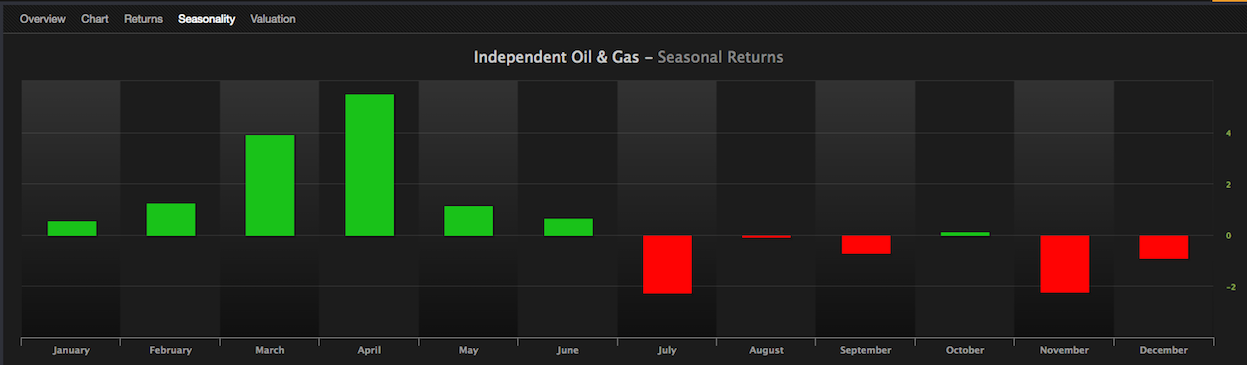
For the week, crude was higher by 8%. Crude stocks were higher by 8.6%. However, judging by using 35 years of seasonality data for the energy sector, I strongly believe the rally in crude is very long in the tooth.
Comments »