They are being sued for tricking kids into eating their disgusting slop, by luring them over with toys in “Happy Meals.”
I suppose we live in a “Children of the Corn” world, where parents do not exist.
Comments »They are being sued for tricking kids into eating their disgusting slop, by luring them over with toys in “Happy Meals.”
I suppose we live in a “Children of the Corn” world, where parents do not exist.
Comments »The richest man in the world taking a stake in a small cap U.S. driller, ticker BRNC.
Comments »They are evaluating offers. The stock is soaring on the news, now up 31%— ticker BBBB.
NOTE: More than 25% of the shares are sold short.
Comments »Min market cap $1 billion
No. Ticker Market Cap Short as % of Float
1 GDOT 1,800,000,000 79.10
2 JOE 2,270,000,000 76.20
3 CLWR 1,410,000,000 54.00
4 DSW 1,940,000,000 49.50
5 YOKU 6,330,000,000 49.35
6 MMYT 1,090,000,000 45.60
7 BBBB 1,290,000,000 44.40
8 CSTR 1,550,000,000 41.21
9 WPO 3,580,000,000 40.60
10 LDK 1,630,000,000 38.55
11 DMND 1,310,000,000 36.20
12 CIEN 2,450,000,000 35.50
13 TZOO 1,300,000,000 35.10
14 DDS 2,720,000,000 34.80
15 WRLD 1,020,000,000 34.70
16 LFT 1,620,000,000 33.29
17 VECO 1,930,000,000 32.72
18 SPWRA 1,450,000,000 32.20
19 TSLA 2,440,000,000 32.00
20 RKT 2,740,000,000 31.30
21 FSLR 11,820,000,000 29.60
22 DOLE 1,180,000,000 29.43
23 PFCB 1,060,000,000 29.30
24 UAL 7,700,000,000 29.00
25 TXI 1,160,000,000 28.60
26 ADS 4,280,000,000 28.60
27 SKS 1,850,000,000 28.30
28 STRA 1,610,000,000 28.20
29 SHLD 8,540,000,000 28.11
30 URI 1,940,000,000 27.90
31 WNR 1,610,000,000 27.70
32 HEI 1,980,000,000 27.70
33 RLD 1,520,000,000 27.60
34 RES 3,440,000,000 27.00
35 OPEN 2,460,000,000 26.96
36 AUXL 1,080,000,000 26.70
37 CEPH 5,740,000,000 26.60
38 ANR 6,570,000,000 26.60
39 NOG 1,420,000,000 25.50
40 GME 3,710,000,000 25.40
41 WTI 1,650,000,000 25.20
42 QSII 2,480,000,000 25.20
43 TWI 1,080,000,000 25.00
44 MDP 1,580,000,000 25.00
45 CREE 4,510,000,000 24.70
46 SVU 2,250,000,000 24.30
47 CLNE 1,140,000,000 24.25
48 LOGM 1,070,000,000 23.53
49 DFT 1,390,000,000 23.30
50 NUVA 1,080,000,000 23.20
Data provided by The PPT
Comments »Interestingly, according to seasonal data provided by The PPT, Chinese stocks tend to outperform in the month of April, with 57% of stocks in The PPT Chinese index trading up in April for an average return of 5.22%. It is the best trading month of the year for the group. In recent days, shares of Chinese related stocks have been on fire, led by gains in SINA, YOKU and BIDU. That trend is continuing today.
No. Ticker % Change Industry
1 OSN 18.35 Chinese Burritos
2 CCCL 13.20 Chinese Burritos
3 CCIH 12.54 Chinese Burritos
4 TRIT 10.76 Chinese Burritos
5 PWRD 10.72 Chinese Burritos
6 DANG 7.35 Chinese Burritos
7 CHINA 6.60 Chinese Burritos
8 ZNH 6.35 Chinese Burritos
9 KNDI 5.97 Chinese Burritos
10 ALN 5.61 Chinese Burritos
11 CEA 5.10 Chinese Burritos
12 QIHU 4.89 Chinese Burritos
13 CTRP 4.55 Chinese Burritos
14 SIHI 4.49 Chinese Burritos
15 SINA 4.42 Chinese Burritos
16 WATG 4.30 Chinese Burritos
17 SEED 4.12 Chinese Burritos
18 BSPM 4.12 Chinese Burritos
19 SOHU 3.97 Chinese Burritos
20 CAAS 3.54 Chinese Burritos
21 EJ 3.51 Chinese Burritos
22 YOKU 2.93 Chinese Burritos
23 CYOU 2.71 Chinese Burritos
24 HSFT 2.51 Chinese Burritos
25 CDII 2.42 Chinese Burritos
Reversing earlier losses, now at session highs +0.25%
Comments »Based upon robust earning across the board, in all regions.
Comments »“The private refineries aren’t making money because of controlled fuel prices and high crude costs, so they have to reduce production,” Qiu Xiaofeng, an analyst at Beijing-based Galaxy Securities Co., said by telephone. “The state refiners have to step in to fill the output loss.” Private refineries account for more than 10 percent of China’s total fuel output, he said.
Comments »A grand total of $245,075 to 36 different charities. Conversely, the Bidens gave 5k.
Comments »They suck.
Reports Q1 (Mar) earnings of $0.55 per share, $0.03 worse than the Thomson Reuters consensus of $0.58; revenues rose 5.8% year/year to $3.39 bln vs the $3.4 bln consensus. TXN reports Q1 Gross Margin of 50.9 % vs 52.8% Street Expectations. Co issues guidance for Q2, sees EPS of $0.52-0.60, which includes a $0.05 negative impact from the impact of the Japanese earthquake and aftermath, may not be comparable to $0.63 Thomson Reuters consensus; sees Q2 revs of $3.41-3.69 bln vs. $3.53 bln Thomson Reuters consensus.
Comments »Downgraded from stable to negative:
Knights of Columbus, New York Life Insurance, Northwestern Mutual Life Insurance, Teachers Insurance & Annuity Assoc. of America, and United Services Automobile Assoc
Market cap minimum: $1 billion
No. Ticker % Change Market Cap
1 SNDA 18.29 2,490,000,000
2 THOR 10.10 1,610,000,000
3 SINA 7.32 7,680,000,000
4 YOKU 7.28 6,330,000,000
5 ARCO 6.55 4,270,000,000
6 REGN 6.11 4,120,000,000
7 QIHU 5.68 3,400,000,000
8 IPGP 5.18 2,680,000,000
9 MPEL 4.48 4,870,000,000
10 RGLD 4.24 2,980,000,000
11 AKAM 4.02 7,130,000,000
12 GCI 3.65 3,550,000,000
13 RIMM 3.20 27,830,000,000
14 LVS 3.16 32,060,000,000
15 CPL 3.07 13,930,000,000
16 LULU 2.97 6,650,000,000
17 GAME 2.83 2,100,000,000
18 CYOU 2.75 1,830,000,000
19 KNM 2.71 2,410,000,000
20 LCC 2.41 1,310,000,000
21 LTM 2.37 1,470,000,000
22 MTB 2.28 10,260,000,000
23 OPEN 2.27 2,460,000,000
24 CEF 2.19 5,550,000,000
25 VRUS 2.16 3,690,000,000
Corn is up another 1.65% today, reaching new highs. Someone needs to tell the corn people deflation is knocking on the door.
Comments »Goldman paid Berkshire back $5.5 billion today. Berkshire still hold Goldman warrants, which expire in 2.5 years.
Comments »Logic dictates, if the U.S. credit rating is no good then our debt and currency should trade lower, no? Also, gold should trade up, right? Well, thus far, this trade is not materializing. The only thing consistent with a ratings shock is lower equities, now down 225 on the Dow.
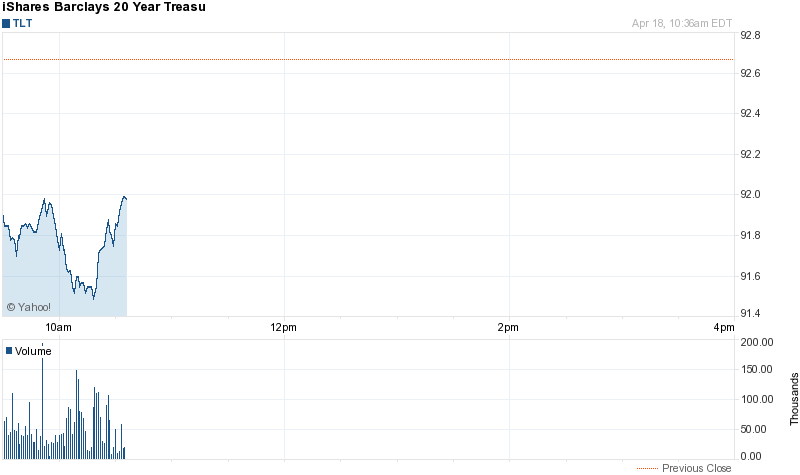
TLT, 20-30 year Treasuries, down just 0.6%
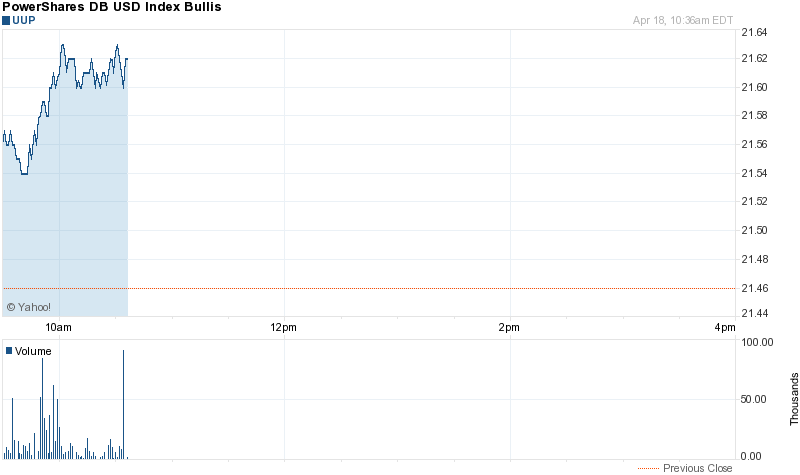
U.S. dollar, +1.00%
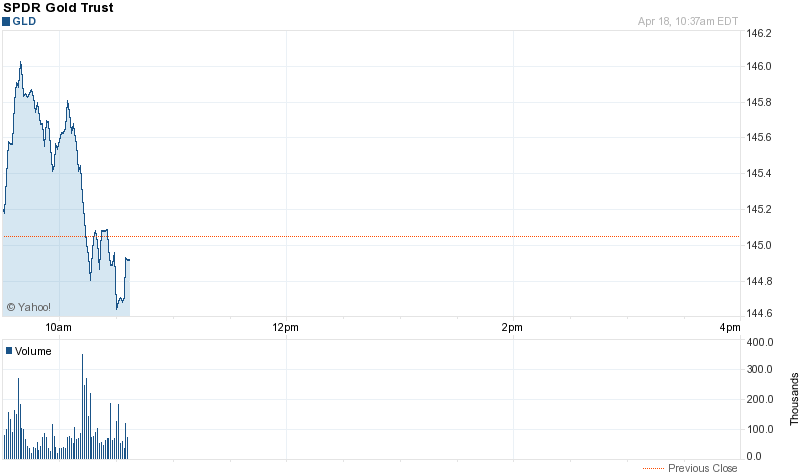
Gold, up but weakening
No. Ticker % Change
1 AMRN 71.61
2 THOR 14.26
3 XPRT 8.40
4 LLEN 7.97
5 AONE 7.80
6 CSR 6.25
7 APP 5.00
8 ZOOM 4.95
9 WATG 4.71
10 HRBN 4.01
11 AOB 3.27
12 KAD 2.86
13 REVU 2.78
14 REGN 2.77
15 LUNA 2.44
16 SYMX 2.31
17 YONG 2.31
18 BWEN 2.14
19 PBR-A 1.96
20 GTXI 1.58
21 GNVC 1.56
22 BPAX 1.44
23 FCE-A 1.28
24 DEER 1.23
25 VIA-B 1.04
———————————-
No. Ticker % Change
1 MCZ -13.62
2 PLUG -10.00
3 VPHM -9.67
4 SUF -9.09
5 AG -9.03
6 AAU -8.83
7 HRZ -8.67
8 CIGX -8.53
9 GIGM -8.33
10 HL -8.32
11 DGW -8.01
12 CYH -7.52
13 OPXA -7.46
14 PANL -7.42
15 GNK -7.33
16 COIN -7.16
17 MTL -6.87
18 EXK -6.76
19 URZ -6.71
20 AEN -6.56
21 HSOL -6.50
22 AIB -6.44
23 SSN -6.43
24 AEG -6.40
25 XING -6.36
In light of the market debacle, the following inverse or bearish ETF’s are outperforming.
No. Ticker % Change
1 TVIX 12.97
2 EDZ 8.05
3 ERY 7.04
4 SOXS 6.55
5 VIIX 6.36
6 DPK 6.34
7 BXDC 6.29
8 VXX 6.21
9 VIXY 6.19
10 TYP 6.11
11 SRTY 5.96
12 TZA 5.84
13 EEV 5.58
14 BZQ 5.36
15 SPXU 5.16
16 BGZ 5.09
17 EFU 5.05
18 DUG 4.98
19 DTO 4.86
20 FXP 4.54
21 SCO 4.46
22 UPW 4.45
23 EPV 4.42
24 SMN 4.42
25 FAZ 4.40
Good times. Sixty five cents above national average.
Comments »