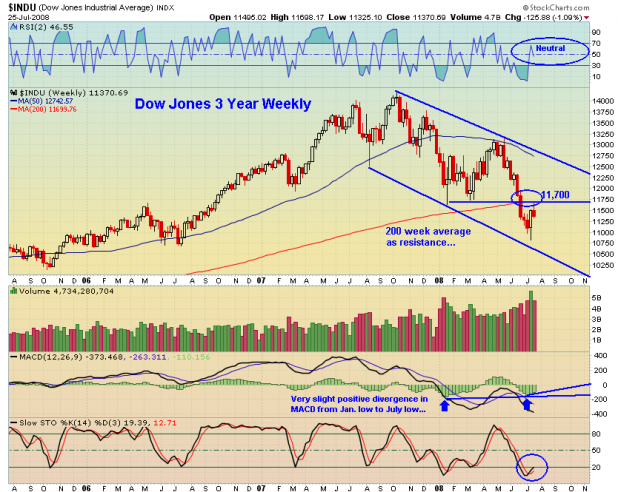
Looking at the 3-year weekly Dow Jones chart, we see the index closed the week in the middle of a 10-month declining channel. It is still beneath the 200 week moving average. It was this area, 11,700, that saw the rejection of the index after the recent short squeeze. I expect this area to maintain strong resistance.
The RSI is neutral, while the Stochastics seem to be giving a buy signal. MACD is moving up towards the zero line, with July’s low showing a very slight positive divergence from January’s low.
The weekly perspective leads me to think that the Dow will continue ambling up towards the upper channel line. Momentum seems to be switching in the favor of the bulls.
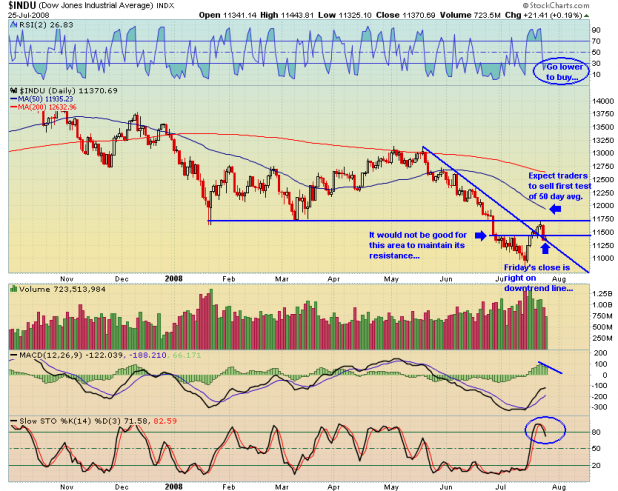
The daily chart finds the Dow closing right at the downtrend line, and just beneath July’s resistance. Both the MACD and Stochastics are suggesting the short-term, upside momentum is slowing. The daily chart shows that the Dow was rejected dead-on at the January and March lows. Remember, this area also corresponds to the 200 week moving average. Volume has declined as the Dow pulled back.
The only short-term, definitively bullish factor I can determine is the RSI(2) reading is nearing a buy signal.
Overall, the technicals are not really giving any clear signals as to near-term direction. The safe bet is to follow the trend, which obviously is down. However, there still stands a significant likelihood that the July lows will continue to be viewed as a bottom, meaning more money will flow into the markets. I suspect there will still be some shorts unwinding positions, should any strength become apparent. Should the Dow continue making its way upward, it will pay to be cautious with long positions as the index approaches 11,700.


Hell if I know Jake. I’m guessing Duvall.
Fly and Jeremy have outdone themselves, again.
If oil drops again due to increased production via OPEC then kiss the technicals goodbye … up we go to 1325 spx.
Dow futures are now in the green …
http://www.bloomberg.com/apps/news?pid=20601072&sid=avW7UgnSKIaE&refer=energy
“China Petrochemical Corp., the nation’s second-biggest oil producer, increased its crude-oil output by 2.4 percent in the first half from a year earlier, the company said today. OPEC’s supply will increase by 200,000 barrels a day in July from a month ago, PetroLogistics Ltd. said July 25.”
8- Oil had little effect on the market Friday. Could have just been an anomaly.
I’m not sure what you mean about kissing the technicals good bye. Right now, they are neutral. FWIW, for all of 2008, if you had faith in the technicals, you’ve had an edge.
Anyway, why are you looking for 1325? 50 day average?
My point is that right now the technicals don’t matter … the market will rise or fall with the price of oil and the technicals will just correct according to what happens. As for 1325 …. I’m a believer in the wave theory and this is what it’s saying now.
Elliott Wave Theory: From OEW
“Our pivot projection for this rally of 1287-1240-1327 is still on track. One poster noted that many blogs, strangely enough, also have this same projection. Therefore, we should be on the lookout for some alternate scenarios that would also fit. The first is a double top like that which occurred in February. This would suggest a 1287-1240-1287 scenario. Another would suggest even a greater rally: 1287-1240-1344. Still prefer the original projection at this point, and will just follow the market as it unfolds. One last note. During the November and January downtrends, the wave 2 and wave 4 rallies were between 50-63 points. Yet, during this recent downtrend not one rally exceeded 36 points. Since Nov/Jan were both similar and Intermediate waves of the same degree within Major wave A. Then the recent downtrend into the July low, and the downtrend to follow, should also be similar, as they will be Intermediate waves within Major wave C. This suggests the next downtrend will also be a prolonged one, with limited rallies as it unfolds.”
Buyer beware … as Fly as said recently, everything will be taken out on the next leg down … little or no rips … stay short until a bottom is in sight.
8, with all due respect, I heartily disagree. The market has been trading on technicals for the entire year. Going back to October 07, still, trading on the technicals.
Why would it stop now? For oil? Nah…
The market will respond to oil, but levels of support and resistance, overbought/oversold will be based on technicals. The technicals don’t really “correct,” As you call it. Either support/resistance is broken, or its not. If it is, then new support/resistance is eventually established.
Another way to look at it is this: The July low will not “correct.” It is there, a finite number. When/if the market approaches that level again, we will want to see the reaction, to guage how it should be traded. Oil may influence direction, either up, down, or sideways, but it doesn’t cause the market to ignore support/resistance/overbought/oversold/momo/etc. Granted, should oil jump to 180, or 80, in a week, then the market may blow through trendlines, but it has not ignored the technicals. The trends will just be busted.
Also, if you believe the market will trade based on oil, what good is Elliot? 😉