iBankCoin
Joined Nov 11, 2007
1,458 Blog Posts

Tuesday Updates for Power Dip

Yesterday was a rough day for the model portfolio. It was also a rough day for the broader market, with the S&P500 closing beneath both the 50 and 200 day moving average. I was hoping the bulls would have defended the averages more vigorously, but I was not holding my breath.

Anyway, the portfolio is still full, as no stocks were stopped out yesterday, and no sell signals were given for Tuesday morning. I will post the spreadsheet with the latest prices after Tuesday’s close.

There were a few Power Dip signals for Tuesday, but the system will not take them as it has no available cash. These signals are [[WWW]], [[BID]], [[ARAY]], [[PLXS]], [[TEN]]

Comments »

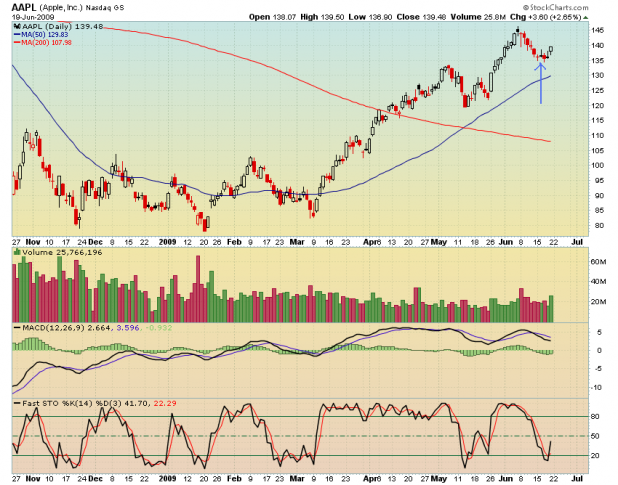
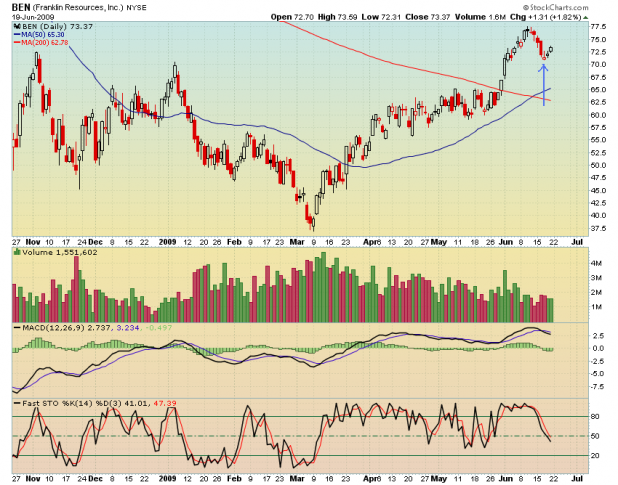
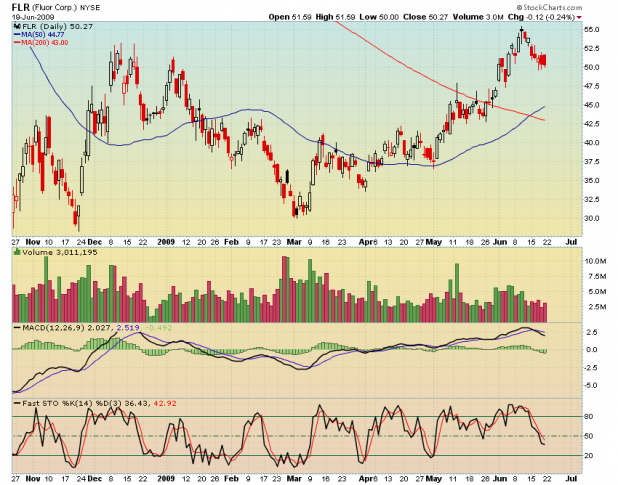
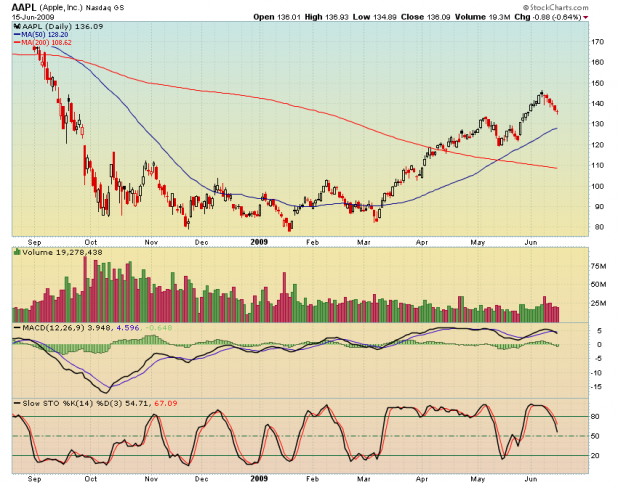
Power Dips Sells AAPL and BEN, Buys FLR and NTG.

The arrow on the charts shows the day of entry. Both AAPL and BEN were sold on Monday’s open. As of Friday’s close, both trades were in the money by over 2%.

On the open, FLR and NTG were added to the Power Dip model portfolio.

The portfolio is now holding ADCT, DTSI, FLR, NTG, PII, SLAB, TSRA, and WRC.

Comments »

Power Dip Week in Review and More System Stats

Despite the weakness in the general indices, the Power Dip system had a decent weak.

On Friday, four positions were added: TSRA, WRC, ADCT, and SLAB.

VRX and CNK were closed on Friday; both were winners. On Monday, two more winning positions will be closed. Check back Monday morning for the update.

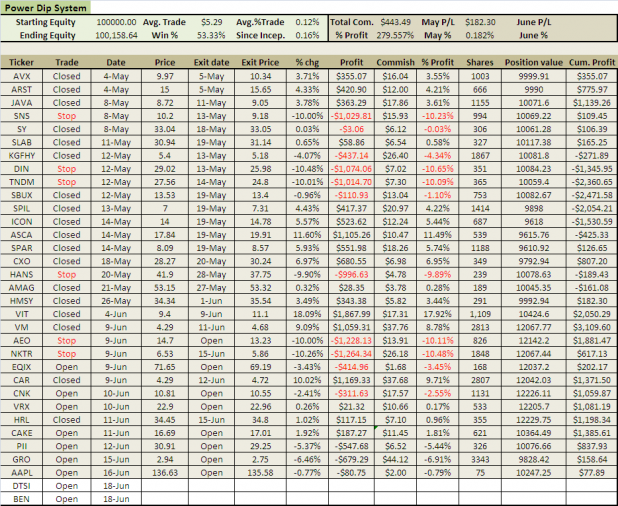
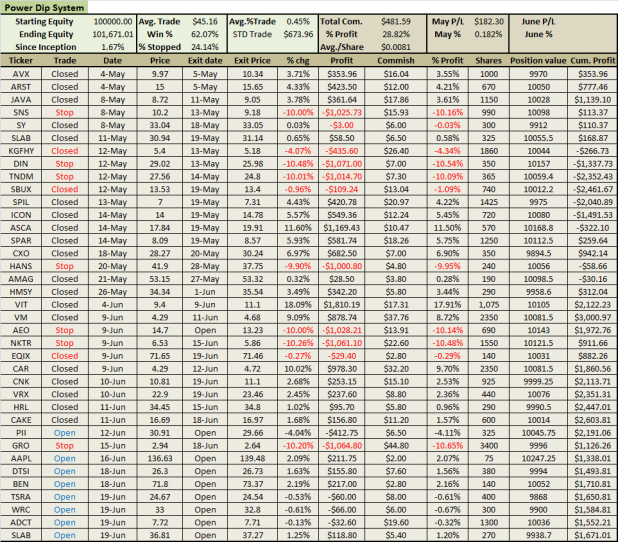
I made some changes and additions to the spreadsheet. First, I re-sized all positions to be as close as possible to 1% risk, without buying wierd, odd-lots of shares. To be clear, with a $100K portfolio, a 10% stop with 1% risk means each position will be close to $10,000. On accident, I had sized some of the trades as if the portfolio was $120K, which means some of the positions were $12,000. While I expect the account to reach $120K, it is not there yet, and so those positions should not have been sized as large.

Secondly, I am tracking the percentage of trades that stop out. It is currently running at 24%.

I also added the standard deviation of the average trade, and commissions as a percentage of total profits. Commissions as a % of profits is running at 29%. One way to improve this would be to not take trades priced below $10.00 share, assuming one is trading with per-share commissions.  Another way to lessen the impact of commissions if one wants to trade the lower priced stocks is to use fixed commissions. Fixed commissions, assuming all trades are closed would be $518.00 (at $7.00/trade), so per-share commissioning is actually working better right now.

The win % is moving towards the backtested historical norm of 67.5%, but the average trade is half of what we would expect from backtesting. As the average trade is calculated after commissions, it may be that during backtesting that I did not add in sufficient commissions. I do expect the average trade to rise to its backtested historical average of ~1.0%

More About the System

I’m getting a lot of questions about what will keep the Power Dip from buying dips headlong into Armageddon. Of course, with the current environment, dip-buying still “feels” a little frightening, and so I understand completely why I’m getting these questions.

The explanation is simple. Let’s assume that the system will not buy a dip, unless the stock is above a moving average threshold. During a severe market correction, most stocks will eventually trade below the threshold. At that point, the system no longer “sees” the dips as viable. In effect, the market conditions turn the system off and on.

To better illustrate this concept, we’ll look at a snippet of an equity curve.
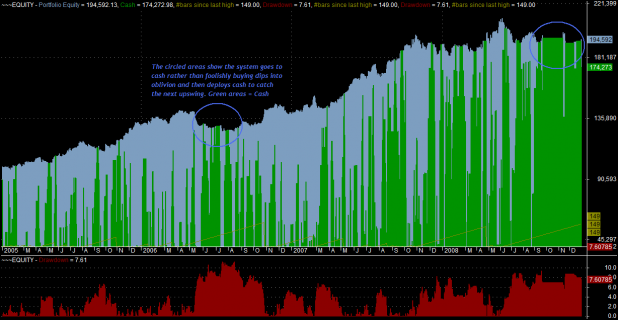
The above equity curve was generated from backtesting from 1/1/2005 to 1/1/2009. The results do include .008/share commissions. Notice the blue circles. These circles were drawn around areas when the broad market dipped. Note how the Power Dip system eventually stopped buying dips, and moved entirely to cash.

This turning off and on of the system meant that it caught some nice trades in the first half of 2008, and then went almost entirely to cash, missing the huge declines of late Summer and Fall. In fact, the system finished up 1.9% in 2008 (including commissions).

Recent Equity Curve:
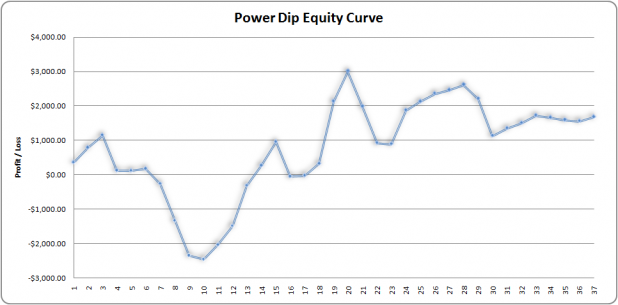
Keep in mind that the last 7 data points are open trades and are thus subject to change.

Please do not hesitate to ask questions about this system. I’ll continue to answer them as clearly and openly as I can without giving away anything proprietary.

Comments »

Power Dip Buys and Sell for Friday

Thursday’s strength came in right on time. On today’s open CNK, EQIX, and VRX will be sold.

On Thursday, GRO stopped out.

These changes leave four open positions in the model portfolio. Therefore, on Friday’s open the system will purchase TSRA, WRC, ADCT, and SLAB.

Later this morning I will have the spreadsheet updated with the actual buy/sell prices and will post it below.

I am also going to make a few more comments about the system, so be sure to check this post later for the updates.

Comments »

Power Dip Buys and Sells for Thursday

The Power Dip system will sell CAKE on Thursday’s open for a gain of approximately 2%. AEO stopped out Wednesday at the exact low for the day. I hate to see that happen, as it reversed strongly from that low to close higher.

This will leave two open slots in the portfolio which will be filled by  [[DTSI]] and [[BEN]].

The system has been taking it on the chin lately. If the indices do not bounce soon, allowing the system to unload some of the longs, all of the gains of the past two months are likely to vanish.

The number of opportunities continues to be much higher than is to be expected from backtesting. I believe this is due to the unprecedented strength of the last three months. The good news is that the current signals represent the stalwarts of the recent rise, or in other words, these stocks are the strongest and have resisted pulling back.

Here are today’s opportunities not being added to the model Power Dip portfolio:  BAP, CMRG, COOL, CPSL, CRGN, DOV, FLS, GLW, GNTX, KNXA, MVIS, NBL, NTG, OCLS, RTI, SMCR, SFE, SOHU, STAR, TSRA, WRC, ZAGG.

Comments »

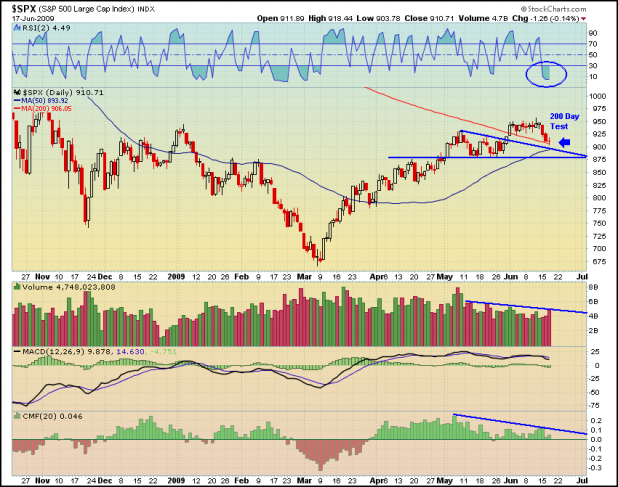
SPX Tests the 200 Day Moving Average

The recent fear and uncertainty that has been tickling the bears and testing the bulls is healthy and a necessary component in the market right now. For three months the market’s advance went virtually unchecked. Even the bulls were openly admitting a pullback was necessary after such a move. The bears had over a month to lick their wounds and leg into new short positions. A pullback here will allow the bears to cover some shorts while the longs reload. Hopefully, this restores some balance, and with that balance I hope we will see some increased volatility.

The move above the 200 day moving average was a major technical event, and major technical events are usually tested. The SPX tested the average today when it traded 3 points beneath it and then reversed to close above it. Should the SPX continue to close above the 200 day moving average after testing it, the major technical event will carry increased significance.

There is certainly the chance that neither the 200 day nor the 50 day average will hold. If this occurs, 875 is the line in the sand. Beneath 875, the darkened abyss awaits. If you look hard, you will see 666 written at the bottom.

An upper support/resistance line could be drawn at 925. Had I drawn this line, it would show a failed breakout as the SPX has returned to the range it traded in throughout May. Instead, I like the descending triangle because I believe traders were using that line when it was broken to the upside on the last day of May. This triangle may add support in the 900 area. It also splits the 875-925 range down the middle.

RSI2 is at a level that is normally associated with a bounce, while the Chaikin Money Flow has been waning but has yet to go negative.

Volume increased today to the highest level since the first day of the month. I would like to think it was due to accumulation around 900 and the 200 day moving average, but it could be distribution.

In general, there has been very little technical damage done during this pullback. That could change very quickly.

Bottom Line: The bulls must come out in force and defend 900. The market has closed lower three days in a row (read a study about any edge associated with x closes in a row), there is round number support and technical significance associated with 900. Neither the bulls nor bears now have an excuse for inaction. The bears can’t say they are waiting for the market to crack, and the bulls have gotten an opportunity to buy in lower. One or the other must take control.

There is an edge with this setup. My calculations show a 74% chance the SPY closes at least 2 points higher than this evening’s close, on average within the next three days.

Comments »

The Power Dip System Pitch

Folks, I doubt you’re going to find a profitable long-only equities trading system, incorporating a stop-loss, using percent-risk position-sizing, that has been traded in real-time, with commissions and slippage included, on the internet.

Except for on this blog. But I will not continue to give away the keys to the kingdom, forever.

One may legitimately ask why I would offer for subscription a viable system. That is a great question, and I have asked myself that many times. But I have the answer; or actually, I have two answers.

1. The first reason why I am pitching this system as a possible candidate for subscription is because I have had numerous people ask me for such a system. I feel this system is a good fit for traders who want to try system trading as it has a high win rate, does not require shorting, employs a stop-loss, and trades often enough to reduce the boredom factor. Furthermore, I have made, and will continue to make every effort to be completely transparent as to the potential gains and pitfalls that may be had from trading the Power Dip system. I pride myself on being transparent, and so I feel I am offering a great product.

2. The second reason why I am pitching this system is because I have spent the past 3 years blogging virtually for free, giving away countless tips, setups, research, etc., and I am very curious to see if I can actually monetize some of my efforts. If there is not much interest from people in subscribing to these alerts, then I will simply keep trading it myself; no harm, no foul.

Therefore, over the next couple of weeks, I will be pitching the Power Dip to the readers of iBC and this blog. Look for detailed system metrics, gained through backtesting, in the near future. Also, I want to be clear that there are usually more Power Dip setups than I post here. I am only posting the setups necessary to round out the portfolio. Tonight there are 44 more stocks that meet the criteria, but I am only naming one of them here. Regardless, all 44 setups should possess a similar edge to the one stock being added to the portfolio.

As for the spreadsheet above, it has now logged 30 trades, most of which were taken by myself and/or my partner, and thus includes Tradestation’s commission structure as well as slippage. I have included a calculation of commissions as a percentage of profits. This is important because it shows that for some traders, it may be much more beneficial to use a fixed commission system, rather than per-share.  I might switch to a per-trade commission structure.

The system has underperformed expectations, over the past 30 trades. Feel free to ask any questions about the performance.

NKTR stopped out today. This leaves room for one more position. As evident at the bottom of the sheet, AAPL is the next Power Dip and will be added to the portfolio on the open.

Comments »