iBankCoin
Joined Nov 11, 2007
1,458 Blog Posts

Power Dip Update for Thursday

The Power Dip model portfolio took a beating over the past two days. A bounce is needed soon or it will be very ugly for the strategy. The spreadsheet has been updated with all of the positions and Wednesday’s closing prices.

pd-ibc-report-7_9

[[CRTX]] stopped out on Wednesday, and 99 Cents Only Stores [[NDN]] has met the exit requirements to be sold on Thursday’s open.

This will leave room for two more positions. Accordingly, Savient Pharmaceuticals, Inc. [[SVNT]] and [[ARMH]] will be purchased on the open.

There are two additional setups that the portfolio does not have room for: Palm, Inc. [[PALM]] and Jack Henry & Associates, Inc. [[JKHY]] .

Here’s to a bounce!!!

Comments »

Power Dips for Wednesday

Yesterday was difficult for the Power Dip strategy, but it could have been worse. The model portfolio was full after purchasing four more dips on Tuesday’s open.

More setups appeared after yesterday’s weakness. They will not be purchased by the model portfolio, but I will list them here anyway.

Amylin Pharmaceuticals, Inc. [[AMLN]] , [[ARMH]] , [[CAST]] , [[IFON]] , and  Maxwell Technologies Inc. [[MXWL]]

I will post the updated spreadsheet this evening showing the results of all of the new positions.

Comments »

No Wonder 95% of All Traders Blow Up

For the most part, I have been Mr. Nice Guy, during my almost 3 years of financial blogging. I have chosen the “You can lead a horse to water…” approach, rather than force-feed information to those who are either unable or unwilling to understand and accept it. I have provided gifts, if you will, but because they were often wrapped in an old brown bag or the comics section of the newspaper,  many readers have chosen to ignore them, instead of unwrapping them and marveling at their splendor.

Lately though the stupidity of some of the readers of iBankCoin has been unnerving. I have become very frustrated by the generally wrong, typically under-educated, and always over-confident miscreant who declares, “There is no edge in this trade!” or “The head and shoulders top is in!” or any variety of over-the-top emotional outbursts. These folks have no idea what they are talking about.

Case in point:

The level of bearishness on the blogs today was overwhelming. Many of these folks are ready to short any stock with one, two, three, or four letters in its symbol. The fact of the matter is that shorting here is an AWFUL setup. Just plain AWFUL. Yet, any attempt to challenge this bearishness with knowledge and cold, hard data is met with derision. Basically, knowledge is being countered with foolish idiocy.

Let me show you people who were all gung ho to pile in on the short-side today what kind of odds/edge you are looking at.

The Study:

Since today was the third consecutive lower close, this study gets short the close anytime there will be three consecutive lower closes. To be clear, we will be shorting the SPY at the close, on the third consecutive lower close. I used all the data available for the SPY, with the first trade taking place in November, 1993. There were 355 instances of this setup.

The exit is a simple time exit. I am plotting what the results will be if you exit the at next close, the close two days later, and so on and so forth.

The test assumes $100,000 per trade, does not compound gains (losses, actually) and does not include commissions or slippage.

3-lower-closes-net-profit3-lower-closes-profitable3-lower-closes-avg-trade3-lower-closes-winloss-ratio

Please, if you do not understand what the graphs are showing, I will be happy to explain it. Just ask.

Summary:

There is NO EDGE to shorting the SPY at today’s close, but you wouldn’t know that from listening to the myriad emotional train-wrecks who call themselves traders. No wonder 95% of all traders blow up.

Comments »

Power Dip Setups for Tuesday

Monday’s tepid rally generated five more Power Dip setups. The spreadsheet has been updated to reflect Monday’s purchases.

The model portfolio has room for four of the five stocks.

pd-ibc-report-7_6

The five stocks for Tuesday’s are as follows: Aruba Networks, Inc. [[ARUN]] , [[CRTX]] , Cypress Bioscience, Inc. [[CYPB]] , VanceInfo Technologies Inc. [[VIT]] , and [[VVTV]] .

Four of these five stocks will be added on Tuesday’s open.

Comments »

Power Dip Setups for Monday

After taking a week off, the Power Dip system has found Thursday’s weakness to its liking and is ready to take the following long signals on Monday’s open.

As usual, a 10% stop works well.

life

[[LIFE]]

xray

DENTSPLY International Inc. [[XRAY]]

ndn

99 Cents Only Stores [[NDN]]

wat

Waters Corporation [[WAT]]

Comments »

Myth Busting: Putting Nail in Coffin of Falling Cross Myth

I have wracked my brain over this holiday weekend trying to figure out where my research might have gone wrong. I mean there are still many traders who still believe it is better to buy a Golden Cross with a rising 200dsma than a falling 200dsma. I have checked and re-checked my code, re-reviewed the data set, and visually inspected the trades. I can find no errors.

I decided to run one final battery of tests on the SPX data to nail shut the coffin from which the zombie disbelievers keep trying to rise.

First, anyone new to this series will need to review the following posts in order to understand the testing methodology:

Mr. Denninger is Incorrect

Myth Busting: The Golden Cross and a Downtrending 200MA

Results with Rising 200dsma

spx-avgtrade-rising-200dsmaspx-profitable-rising-200dsmaspx-netprofit-200dsma

Results with Falling 200dsma

spx-avgtrade-falling-200dsmaspx-profitable-200dsmaspx-netprofit-falling-200dsma

In Case There is Still Doubt…

The zombies have been fixated on the myth that a  Golden Cross with a rising 200dsma is the ONLY version of the technical signal that is valid as the herald of a new Bull Market.

To test this assumption, I quantified rising/falling in the most simplest terms possible. If on the day of the cross the 200dsma was lower than the day before, it was considered to be falling. If on the day of the cross the 200dsma was higher than the day before, it was considered to be rising. In other words, this test used a 1 day look-back. The traditional exit, the Death Cross, was kept as the exit.

I assume, by a new Bull Market, the zombies mean (of course they never bother to quantify their arguments) that a Golden Cross with a rising 200dsma will tend to run much farther than when the setup has a falling 200dsma. Again, the specifics have never been quantified, so I will do my best to work with the soft arguments.

To measure how far the trade runs, I used Maximum Favorable Excursion. This measure shows the maximum gain of the trade. It does not show what each trade gained from open to close. It is a perfect-world type measure. Maximum Favorable Excursion shows what the gain for the trade would have been had you closed it at the most favorable moment.

Lets look first at how the MFE looked on the Dow Jones.

mfe-rising-200dsma-dowjones

mfe-fallling-200dsma

With a rising 200dsma, only 1 trade rose more than 50%, and 4 trades rose more than 30%.

With a falling 200dsma, 3 trades rose more than 50%, and 6 trades rose more than 30%.

Again, without an operational definition of “New Bull Market,” it is hard to disprove the argument, although it sure looks to me like a falling 200dsma yields a better chance for trades that run higher.

MFE on the SPX

mfe-rising-200dsma-spx

mfe-falling-200dsma-spx

With a rising 200dsma, only 2 trades rose above 20%, with one of the trades barely making it above 20%. It is obvious that the bulk of the gains from the rising 200dsma trades came from the outlier trade which gained over 120%.

With a falling 200dsma, 5 trades rose greater than 20%.

It should be obvious at this point that a greater number of trades with a falling 200dsma go higher (new Bull Market?) than trades initiated with a rising 200dsma.

Summary:

Across a variety of measures, the data show that there is a definitive edge to buying a Golden Cross with a falling 200dsma a 200dsma that has fallen more than it has risen. Indeed, whether we are looking at average trade, % profitable, or net profit, a falling 200dsma a 200dsma that has fallen for longer than it has risen performs equally as well or better than a rising 200dsma.

As for the claims that a falling 200dsma is “false” as the herald of a new Bull Market, the data again show this to be another myth. However, I am almost certain that the zombies will say that I do not understand the meaning of “Bull Market.”

As always, discussion/challenges are welcome.

Comments »

Myth Busting: The Golden Cross and a Downtrending 200MA

I am truly surprised at the amount of misinformation put forth lately in regards to whether a Golden Cross with a downtrending 200 day simple moving average (dsma) is a valid signal.

Despite the work of backtesting heavyweight MarketSci (not to mention my own work) which showed that it does not matter whether the 200dsma is falling or not,  there are still many people out there who insist that this variety of Golden Cross is invalid. Across a variety of blogs and websites this myth remains very persistent.

Not being one who is fond of promulgating more technical analysis myths (there are enough out there already), I have decided to put this myth to bed, once and for all.

The Method

Both Michael Stokes and myself have proven that a Golden Cross on the S&P500 is valid regardless of the direction of the 200dsma. Despite our efforts, there has been some doubt about this research since data for the S&P only goes back to 1960. Some have asserted that this test should be performed on the Dow Jones, since there is more data available.

The other important consideration is how “downtrending” or “falling” is quantified, in regards to the 200dsma.

I will test all of the Dow Jones data provided by Tradestation, going back to January 1, 1920. Secondly, I will quantify “downtrending” and “falling” so that my results can be replicated.

My tests will not include commissions or slippage or any other fees. It will also not give a return on the cash held when the system is in between trades. Starting equity is 100K and gains are compounded.

In return for my hard work, you dear reader will agree to provide the link to this post to whomever puts forth this myth, from this day forward.

Quantifying Downtrending and Falling

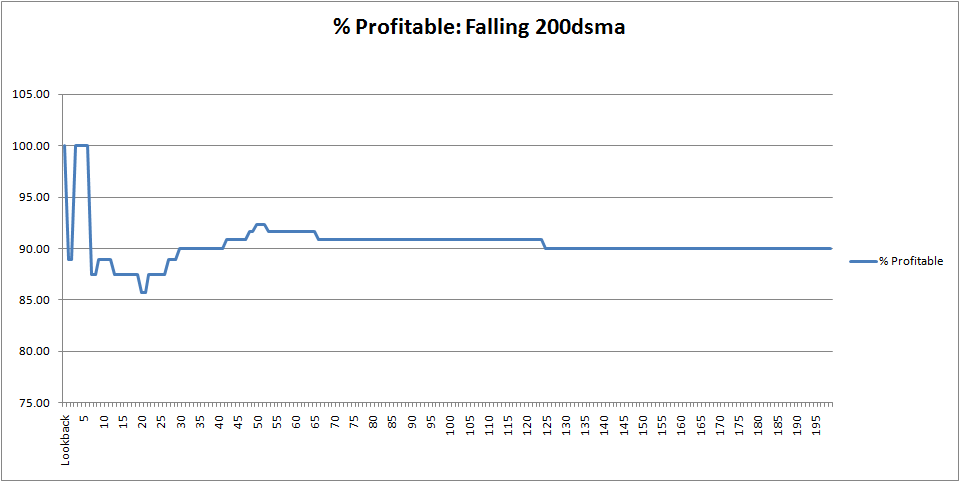
The 200dsma will be defined as downtrending or falling by using 6 different look-back periods: 1, 10, 25, 50, 100, and 200 days. Specifically, six separate tests will be run. Each test will use a different look-back. The first test will consider the 200dsma to be falling if it is lower than it was 1 day ago. The second test will consider the 200dsma to be falling if it is lower than it was 10 days ago, and so on and so forth.

If the 200dsma is lower than it was on the look-back day AND the 50dsma has crossed above the 200dsma, a trade will be entered at the close. The exit takes place on the close of the day the 50dsma crosses beneath the 200dsma.
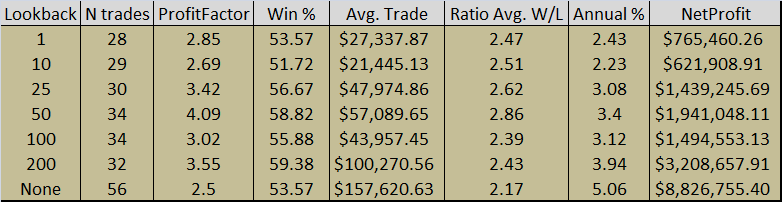
The Results:

falling-golden-cross-dow-jones1

Analysis of Results:

After completing a few of these tests and seeing the trend, I had a true “rolling on the floor laughing my a$$ off” moment.

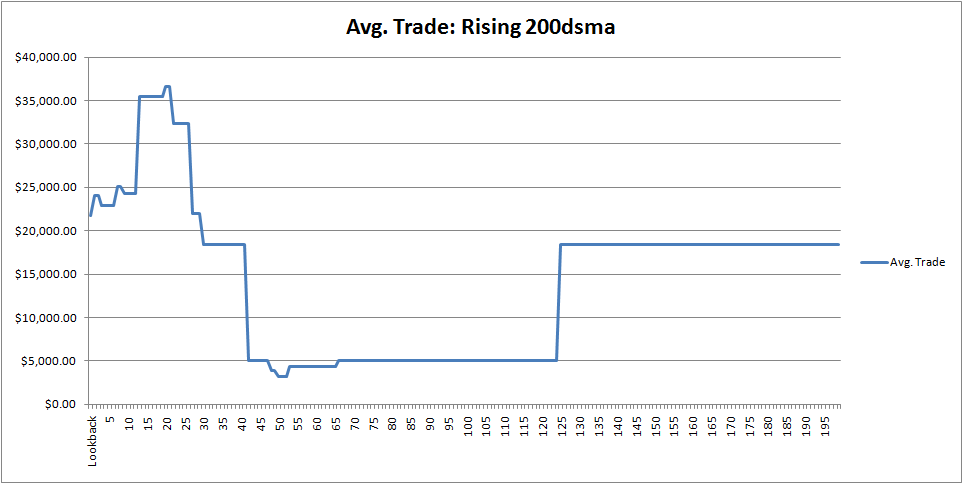
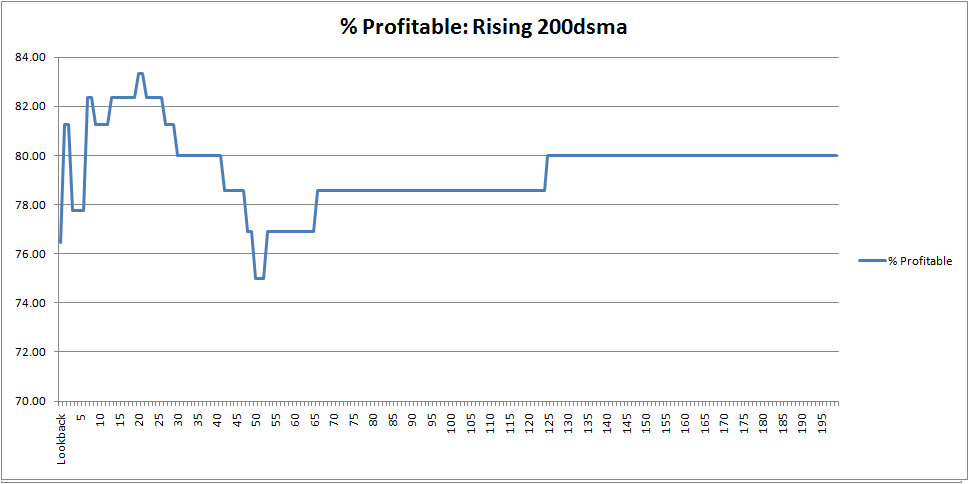
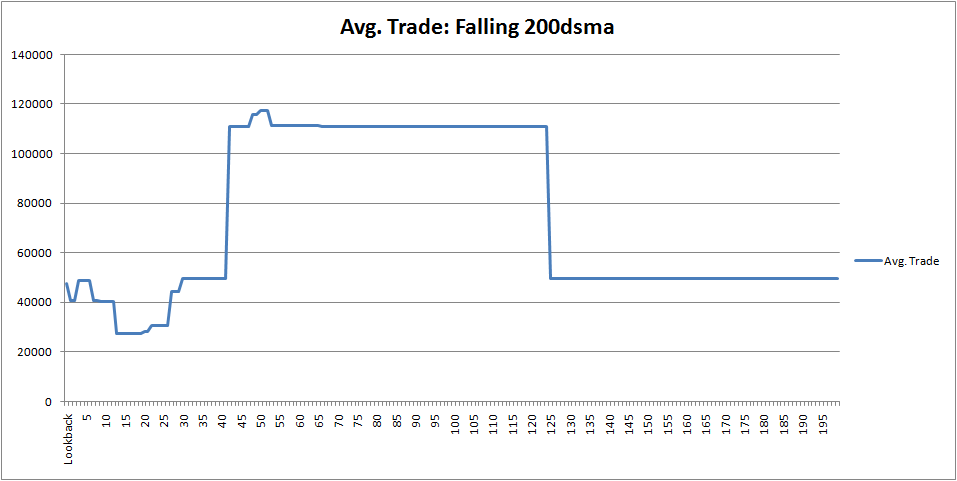
The “technical analysts” were exactly wrong about buying a Golden Cross with a falling 200dsma. In fact, performance improves as the look-back period increases. In other words, the longer the 200dsma has been downtrending, the better!


avg-trade-downtrending-200dsma

avg-trade-uptrending-200dsma

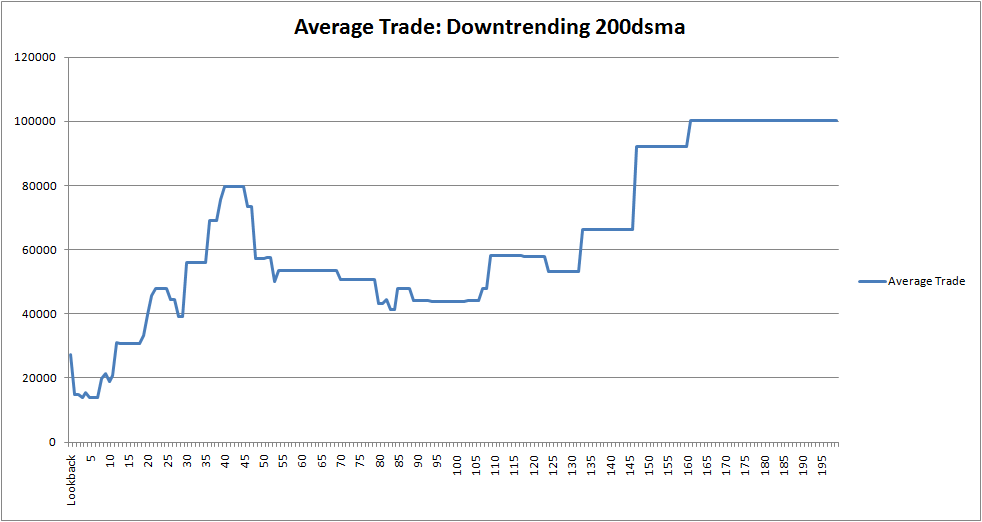
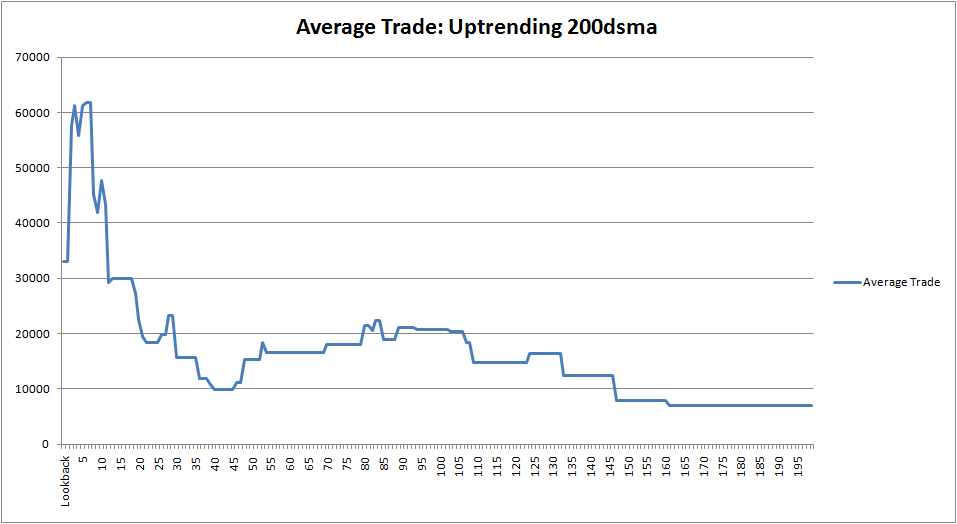
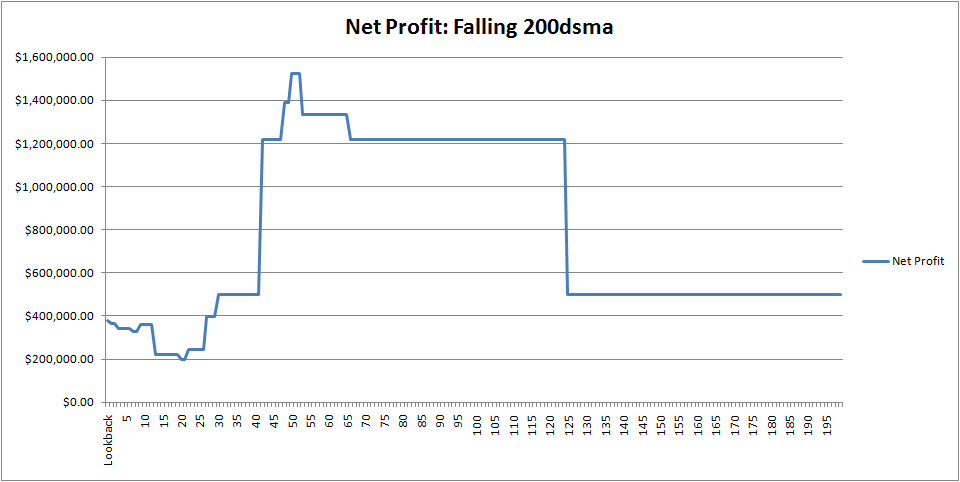
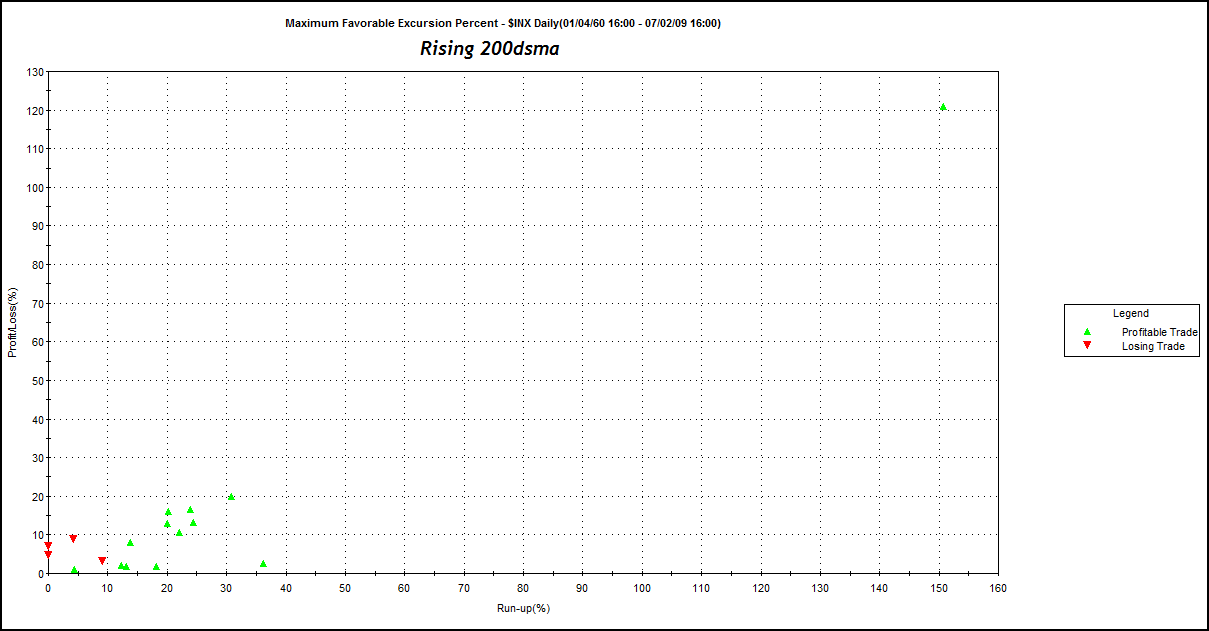
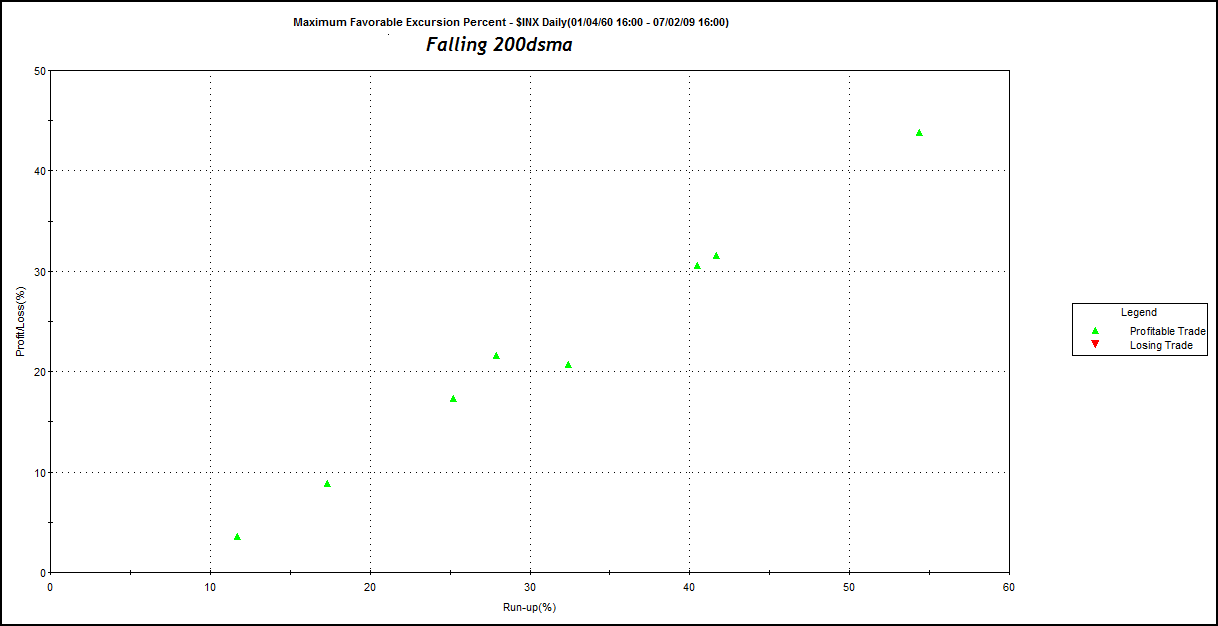
The two graphs above show that it is better to buy a Golden Cross when the 200dsma is falling, flat, or just beginning to rise. The longer it rises, the greater the decrease in the average trade and the percentage of winners (percentage of winners not graphed).

indu-downtrending-golden-cross-50-lookback

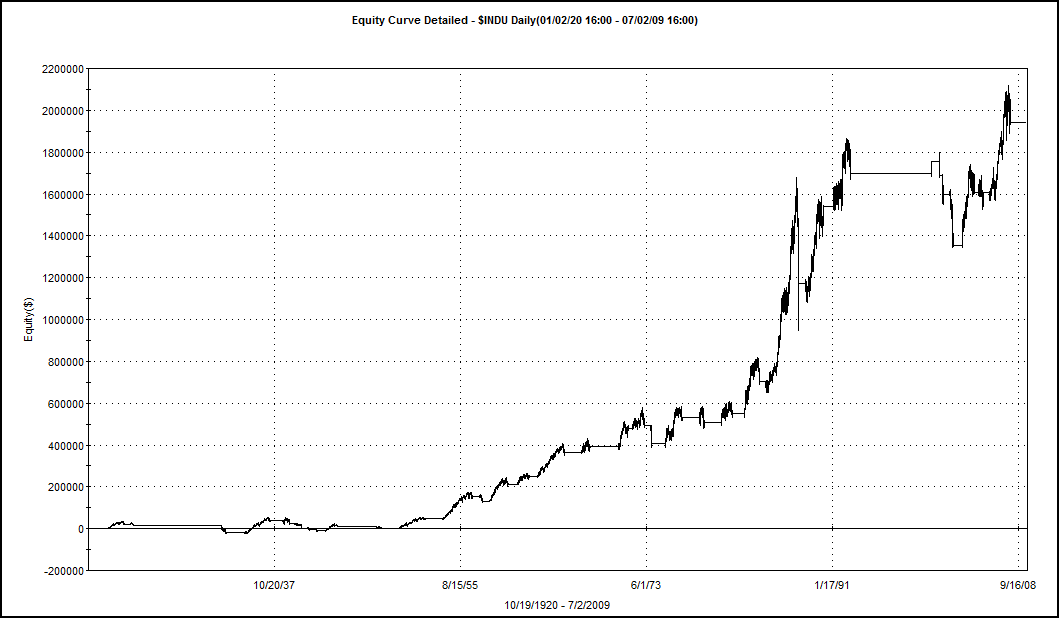
The equity curve is generated from the 50 look-back period test. I have posted it here primarily because I think it is important to examine equity curves as they show details that the statistics do not illustrate nearly as well.

Summary:

I’m willing to entertain any well-reasoned and insightful challenges as to why I have not busted this well-publicized technical myth. No matter how it is sliced, the Golden Cross is bullish, but like everything else market related, there are no guarantees this cross will be successful and lead to a multi-month rally.

It is important to note that a Golden Cross took place today (July 2) on the Dow Jones. The 200dsma has been falling for more than 200 days. As such, the cross that occurred today has the highest probability of success, as shown in the results posted above.

***Update*** While I had hoped to entertain comments here, it looks like the discussion has moved over to Denninger’s forums. Put on your boots before you visit, as it gets a little deep over there.

Comments »