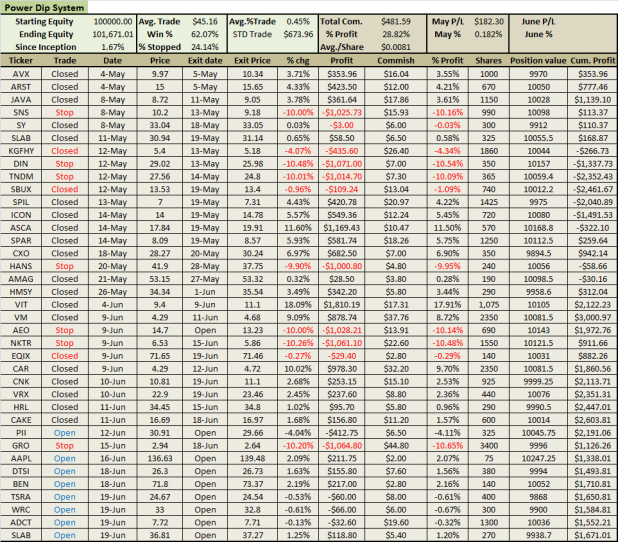
Despite the weakness in the general indices, the Power Dip system had a decent weak.
On Friday, four positions were added: TSRA, WRC, ADCT, and SLAB.
VRX and CNK were closed on Friday; both were winners. On Monday, two more winning positions will be closed. Check back Monday morning for the update.
I made some changes and additions to the spreadsheet. First, I re-sized all positions to be as close as possible to 1% risk, without buying wierd, odd-lots of shares. To be clear, with a $100K portfolio, a 10% stop with 1% risk means each position will be close to $10,000. On accident, I had sized some of the trades as if the portfolio was $120K, which means some of the positions were $12,000. While I expect the account to reach $120K, it is not there yet, and so those positions should not have been sized as large.
Secondly, I am tracking the percentage of trades that stop out. It is currently running at 24%.
I also added the standard deviation of the average trade, and commissions as a percentage of total profits. Commissions as a % of profits is running at 29%. One way to improve this would be to not take trades priced below $10.00 share, assuming one is trading with per-share commissions. Another way to lessen the impact of commissions if one wants to trade the lower priced stocks is to use fixed commissions. Fixed commissions, assuming all trades are closed would be $518.00 (at $7.00/trade), so per-share commissioning is actually working better right now.
The win % is moving towards the backtested historical norm of 67.5%, but the average trade is half of what we would expect from backtesting. As the average trade is calculated after commissions, it may be that during backtesting that I did not add in sufficient commissions. I do expect the average trade to rise to its backtested historical average of ~1.0%
More About the System
I’m getting a lot of questions about what will keep the Power Dip from buying dips headlong into Armageddon. Of course, with the current environment, dip-buying still “feels” a little frightening, and so I understand completely why I’m getting these questions.
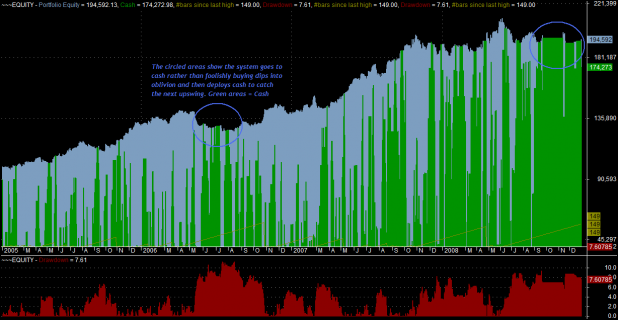
The explanation is simple. Let’s assume that the system will not buy a dip, unless the stock is above a moving average threshold. During a severe market correction, most stocks will eventually trade below the threshold. At that point, the system no longer “sees” the dips as viable. In effect, the market conditions turn the system off and on.
To better illustrate this concept, we’ll look at a snippet of an equity curve.
The above equity curve was generated from backtesting from 1/1/2005 to 1/1/2009. The results do include .008/share commissions. Notice the blue circles. These circles were drawn around areas when the broad market dipped. Note how the Power Dip system eventually stopped buying dips, and moved entirely to cash.
This turning off and on of the system meant that it caught some nice trades in the first half of 2008, and then went almost entirely to cash, missing the huge declines of late Summer and Fall. In fact, the system finished up 1.9% in 2008 (including commissions).
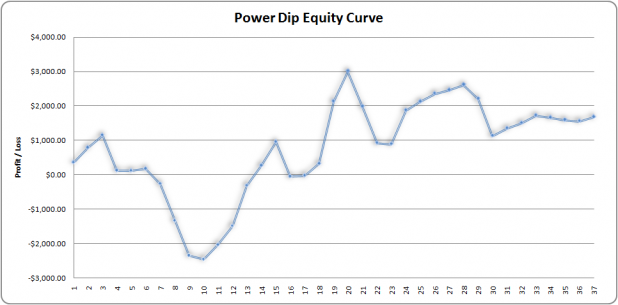
Recent Equity Curve:
Keep in mind that the last 7 data points are open trades and are thus subject to change.
Please do not hesitate to ask questions about this system. I’ll continue to answer them as clearly and openly as I can without giving away anything proprietary.


hey, nothing crazy, but saw you were talking bout golden + ‘s
so I thought i’d post this merrill link where they are talking about ’em/had some statistical data etc
MLtech
weird, that “golden cross during a recession” link not working, try this (same doc):
MLtechlink
308, thanks!