iBankCoin
Joined Nov 11, 2007
1,458 Blog Posts

Power Dips and Selling a Rip

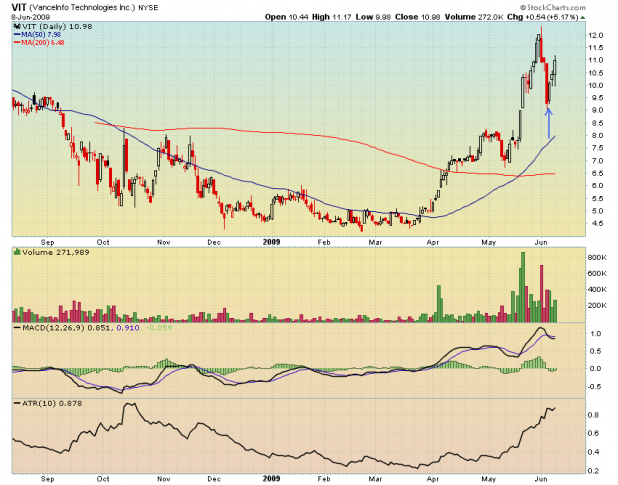
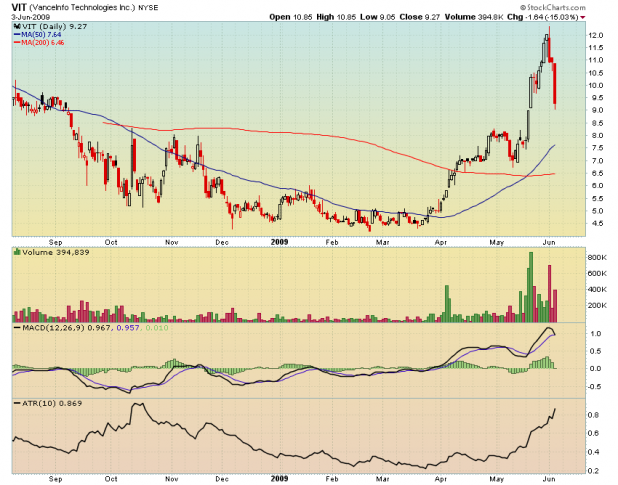
In this post I suggested that VIT was setup to make a timely dip-buyers delight. I will have closed my position in VIT by the time you have read this post, for an egregious gain of near 15%.

Below are some great dip-buying setups for Tuesday…

AEO

EQIX

CAR

NKTR

VM

Comments »

Slippage: From the Textbook to the Checkbook

I would be willing to wager large that 99% of traders have never calculated the slippage they are incurring when they trade. There are many different styles of traders, and some styles, such as scalping and daytrading make it difficult to calculate slippage. Beyond that, determining slippage is just not something that most traders get excited about, understandably so. However, tedium and drudgery should be no excuse, when it comes to diligent management of your money.

Working-stiff traders and system traders should be calculating slippage. Some of you, like me, are relegated to placing trades during “dumb money” times, like on the open. Maybe the market-on-close order is available through your brokerage. The benefit to trading the open and close is that you can compare the price you received to the nationally listed opening/closing price. The difference is the slippage.

There are three circumstances when slippage absolutely must be accurately determined.

1. You are trading a high-frequency strategy (at least one trade a day) that seeks to make many small profits.

2. You want to be totally committed to your system, mentally, physically, and psychologically. Total commitment can only be achieved once you have completely deconstructed the system (in my humble opinion), and accounting for slippage is part of that process.

3. You are considering purchasing a system or subscribing to a system from a vendor.

Here’s How I Calculate Slippage:
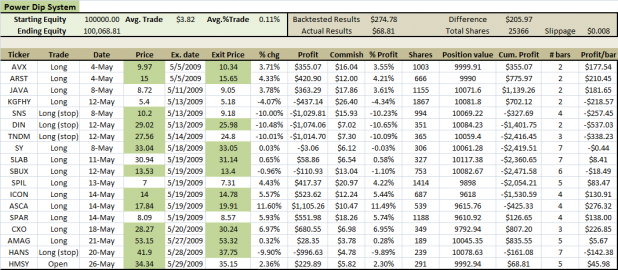
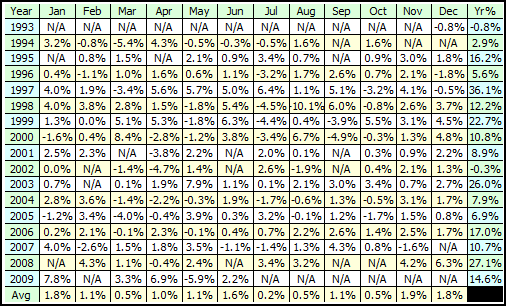
The spreadsheet above has the accounting for the Power Dip System trades during May. The entry and exit prices highlighted in the pleasing green hue denote trades that I actually took in my own account. For those trades, I used the actual price I received. Some of the prices matched the openings, some did not.

The prices in white represent trades that the system took, but that I did not take in my own account. Those cells were populated with data from the backtest results.

So now I have two figures: The actual profits/losses generated from the prices I received (with a few of the trades that I did not take) versus the profits/losses as reported from backtesting. Keep in mind that backtesting is always going to give you the open or closing price for all of your trades, regardless if there was enough liquidity for your order to fill.

In the top right hand side of the spreadsheet I have listed the Backtested Results and the Actual Results. The Difference is just over two hundred bones. Assuming the commissions are accurately calculated, the Difference is the slippage.

To calculate the slippage per share, I added up all the shares traded multiplied by two (remember they have to be bought and sold). I then divided the Difference by the Total Shares. Voila! The slippage is  $0.008 per share.

Summary:

Even if you do not have access to fancy backtesting software, you can still calculate your slippage. Just create a new field in your spreadsheet (you do keep records, right?) for the open/close. Then, you can compare the open/close versus the price you actually received.

Do not neglect this crucially important but tedious task. Many traders love the commission schedules of the more popular brokers when each share only costs them $0.005, yet they are probably not at all aware that their slippage is twice the amount of their commissions.

Here is a quick example:

One version of the Power Dip, assuming $0.005 per share commissions and no slippage, has turned 100K initial equity into $1,291,559.30 for an annualized return of 25.06% since 1/1/1998.

The same version of the Power Dip, now assuming $0.005 per share commissions and $0.008 in slippage, has turned 100K initial equity into $905,094.92 for an annualized return of 21.23%. In this example, slippage has cost almost 400K, over a 10.5 year time span.

A 400K discrepancy might cause some heartache, had slippage not been accounted for early in the life of the system.

Comments »

Daybreak in Dixie

Every once in a while it is important to take some time out for culture.

I recorded the following two songs this evening for some good friends of mine in a little basement studio we built a year or so ago. These tracks were done very quickly (they just needed a rough demo to present to a venue) with very little mixing and no mastering. It was all done live, with no overdubs.

If you enjoy some really hot guitar and mandolin pickin’, then turn it up. If you don’t enjoy good acoustic music, take some time out for some Bluegrass culture, and listen anyway.

Daybreak in Dixie

Cherokee Shuffle

Comments »

Confessions of a System Trader: 6/7/09

I am happy to note that since my last confession, my account has recovered from the drawdown. Were it not for platform fees, I would be positive on the year.

Since I trade mean reversion strategies, I’m not sure if this means that the markets are slowly returning to a more “normal” (whatever that is) environment where there will be dips to be bought and spikes to be sold. I sure hope it is. This slow motion melt up has been very difficult to adapt to, mentally. Since I have not changed anything about my systems or trading, I can only assume that it is the market environment that is shifting.

There is something about trading through a drawdown that I found surprising. At some point, I quit caring that I was losing money. Honestly, I just became numb to the whole thing. Whether it was coincident, or not, who knows, but when I quit caring about losing, my account began to recover from the drawdown, almost to the day.

It is also worthy of noting how my capacity for consumerism changes depending on whether or not my systems are working well. When everything is firing on all cylinders, I notice that I start scoping out new LCD televisions and other things that I do not need.

Having the AmiBroker platform to work on has catapulted my system development in many new directions. I like it much more than Tradestation, mainly due to the coding being much easier. I find many parts of AmiBroker to be much more intuitive to use than Tradestation.

Anyway, when my account value surpasses the influence of platform fees, I’ll post a YTD equity curve. That is, as long as mean reversion continues to gain some traction in this market.

Comments »

Deconstructing the Double 7s: 3D Optimizations

If you need an introduction to the Double 7s series, go here.

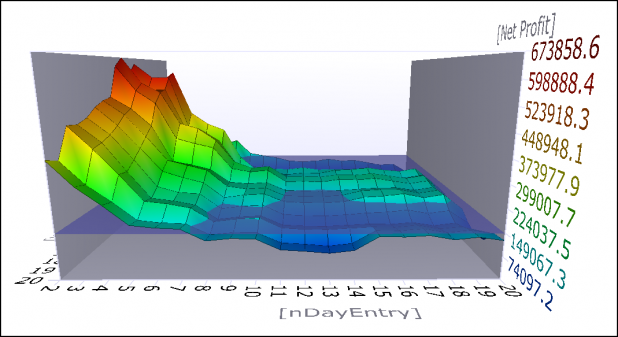
The graphs are the result of running an optimization report in AmiBroker. Testing in Tradestation yielded an optimum setting of 2 and 11 days, rather than the 7 and 7 as publicized by TradingMarkets. The AmiBroker report confirms the Tradestation results.

Some explanations are in order. The nDayEntry represents entering on the lowest close of n days for longs and exiting on the lowest close of n days for shorts. So while it says entry, it is only the entry for the longs. It is the exit for the shorts. Note that the entry edge falls off fairly quickly, as does the exit edge for the shorts. The textbook 7 day entry looks like nothing special and only returns 1/3 of the optimized entry and exit.

The blue underwater mark is set around 150K, but since this system did not lose money, technically nothing is underwater.

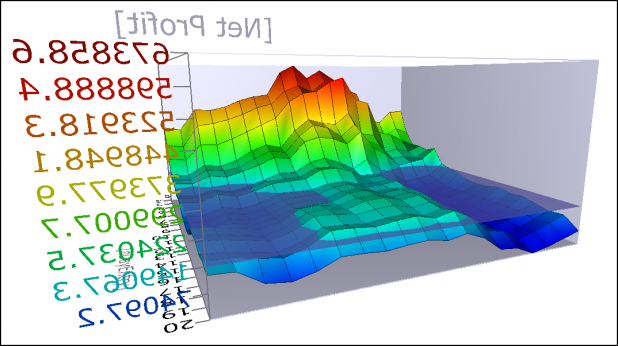
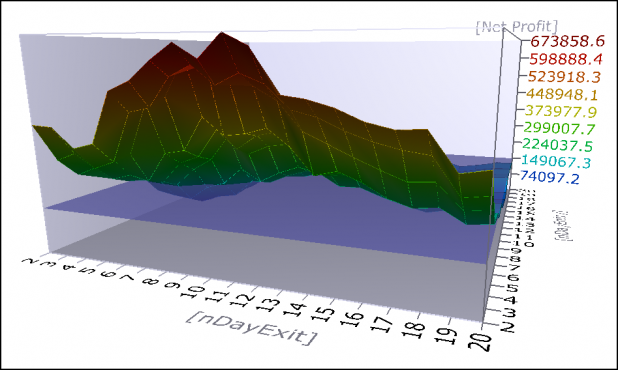
The above graph is the same as the first, but it has been rotated to show that the zone of profit for the nDayExit is large, and does not have a lot of individual spikes. Spikes can show areas where a variable does not provide robust results. The highest area represents the result of exiting longs on the highest close of the past 12 days and initiating shorts on the highest close of the past 12 days.

Again, same graph from behind. I included this view to clearly show how the exit days for longs (entry days for shorts) have a fairly large edge. The textbook 7 day high close exit is better than the 7 day low close entry.

Honestly, I’m very surprised by how large this edge appears to be. Granted, the optimizations were run over the entire data set, with no consideration given to in-sample or out-of-sample testing.

Bonus:

The latest beta version of AmiBroker includes an upgrade to the reports section. I’m going to include some of the charts it now generates automatically.

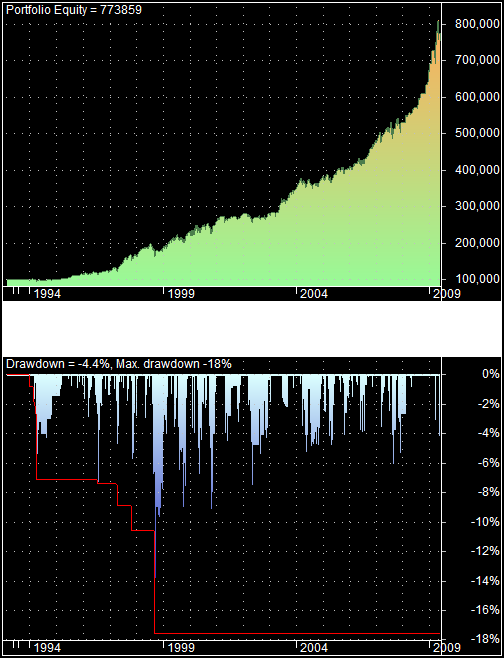
The more I look at this equity curve and drawdown profile, the more I like it! I am a little troubled by the curve going parabolic. How long can that profile be sustained?

The system has only lost money over 2 years (remember, the testing is frictionless).

I think that the next tests I run will attempt to use position-sizing and leverage to improve returns and decrease drawdowns. As much as I’d like to apply stops to the system, as Mikey found, there are not likely to be any stop strategies that can decrease risk without seriously limiting the performance. Instead, I’ll try to accomplish the same thing with dynamic position-sizing.

Comments »

Ride the Power Dip

The best thing about a down day is that it will usually provide some dip-buying opportunities. The Power Dip selection for Thursday is above. I will be going long at the open and will be using a 10% stop.

Comments »

Deconstructing the Double 7s: Let’s Short Something

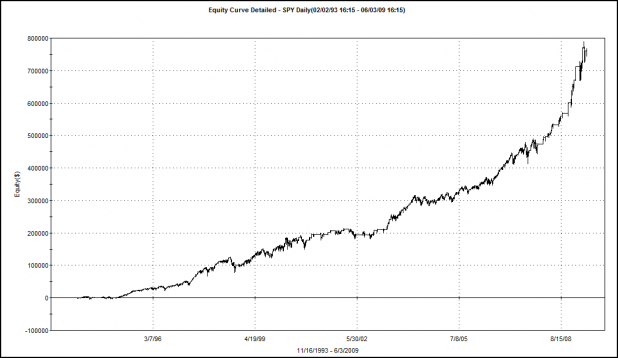
I thought the above equity curve might capture some attention. I’ll explain how we get to that beauty in a bit.

Over the last few weeks, I’ve been Deconstructing the Double 7s, analyzing the system metrics, and hoping that there might be an improvement that can be made.

Mikey may have saved me some time with his comment:

MikeyTrades Says:

I tested 30+ different exits and exit combinations – time stops, % stops, time or 7DH stops, sell the next day after the signal (as opposed to the close), mvg avgs of the low or the close, W%R and ATR stop – before I ran out of time (this work was for a presentation to a small group of traders). The best stop was Sell the Close, the next best was an 8 day time stop, followed by Sell the Next day, 20 day time stop or 7DH, and then the 20 day time stop on its own.

Each of the five best exits had a normalized SQN (System Quality Number) above 2.0 that makes them tradeable according to Van Tharp to use position sizing to meet your objectives, but they are not ideal (for me anyway) as there is no downside stop with those time or 7DH stops.

Since I didn’t find any exits that I was comfortable with I didn’t move it into portfolio testing.

I have a feeling Mikey is no slouch when it comes to backtesting, so I’m thinking about trying one or two things that he didn’t write about trying.

But first, I’ve discussed adding a short component to the Double 7s, and its time to post the results.

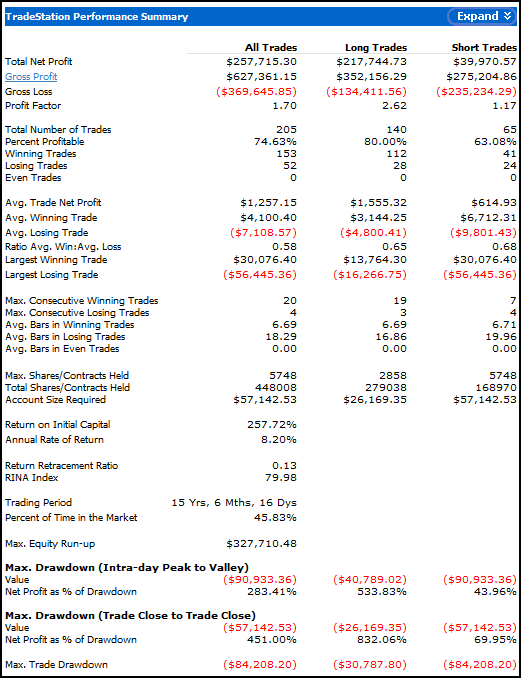
Below are the results for the system with short trades, on the SPY, tested with the same settings as in the previous posts. The short trade is exactly opposite of the long trades. The ETF must be beneath the 200DMA. The highest close of 7 days will be sold short. The trade will be covered on the lowest 7 day close.

Double 7s, Shorts Added, on the SPY

Double 7s Equity Curve with Short Side Added

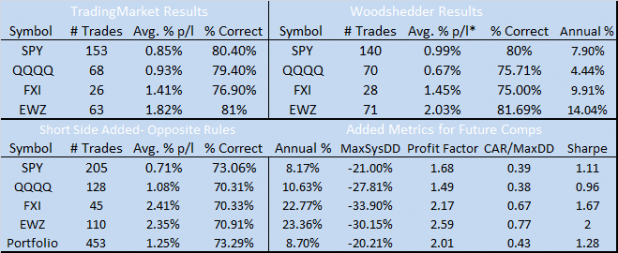
Comparisons Across ETFs, and Portfolio Results:

Some of the metrics may need explanation. MaxSysDD is the maximum system drawdown in percentage terms. CAR/MaxDD is the Annual % divided by the Maximum Drawdown. For example, if the system earned a compound annual rate of 20%, and the max drawdown is -10%, the CAR/MaxDD would be 2. The higher, the better.

For the portfolio backtesting, each ETF (SPY, Qs, FXI, EWZ) was allowed 25% of total equity.

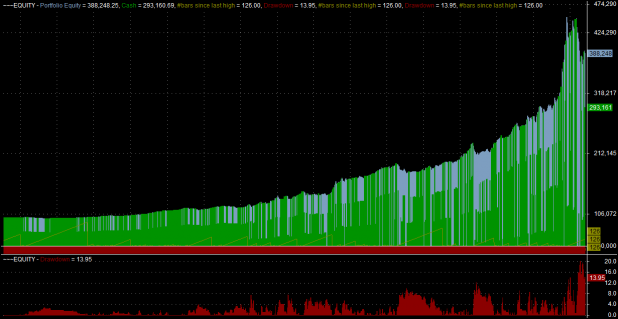
Portfolio Equity Curve:

Summary:

Adding the shorts increases the annual percentage in every ETF, but the SPY benefits the least from the addition. 2 of the other 3 ETFs double their annual returns when short trades are added.

I had hoped that drawdowns would be improved. While adding shorts smooths the equity curve, I’m not sure that they decrease the drawdowns.

Bonus:

One of the variables Mikey did not list as tested was changing the number of days used to calculate the entry and exits. The killer equity curve at the top of the post was generated by changing the system from a 7 day entry and exit to a 2 3 and 11 12 day system. For example, the system goes long at the lowest 2 3 day close and sells at the highest close of the past 11 12 days. It sells short at the highest close of the last 11 12 days and covers at the lowest 2 3 day close.

I’m curious if optimizing the n-day entry and exits is a viable strategy going forward. The next installment will look at these optimizations.

***Update*** Damian from Skill Analytics suspected that I had something incorrect, and he was right.  I used the overstrike function to fix the errors two paragraphs above this one. Without going into too much geekery, just suffice it to say that the code must be offset, and I had forgotten to take the offset into account. All other calculations appear to be correct.

Comments »