I have wracked my brain over this holiday weekend trying to figure out where my research might have gone wrong. I mean there are still many traders who still believe it is better to buy a Golden Cross with a rising 200dsma than a falling 200dsma. I have checked and re-checked my code, re-reviewed the data set, and visually inspected the trades. I can find no errors.
I decided to run one final battery of tests on the SPX data to nail shut the coffin from which the zombie disbelievers keep trying to rise.
First, anyone new to this series will need to review the following posts in order to understand the testing methodology:
Myth Busting: The Golden Cross and a Downtrending 200MA
Results with Rising 200dsma
Results with Falling 200dsma
In Case There is Still Doubt…
The zombies have been fixated on the myth that a Golden Cross with a rising 200dsma is the ONLY version of the technical signal that is valid as the herald of a new Bull Market.
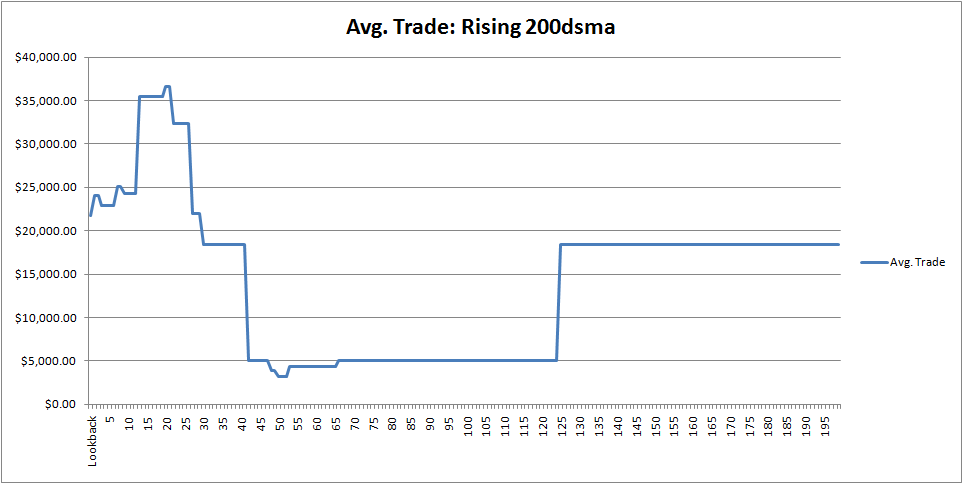
To test this assumption, I quantified rising/falling in the most simplest terms possible. If on the day of the cross the 200dsma was lower than the day before, it was considered to be falling. If on the day of the cross the 200dsma was higher than the day before, it was considered to be rising. In other words, this test used a 1 day look-back. The traditional exit, the Death Cross, was kept as the exit.
I assume, by a new Bull Market, the zombies mean (of course they never bother to quantify their arguments) that a Golden Cross with a rising 200dsma will tend to run much farther than when the setup has a falling 200dsma. Again, the specifics have never been quantified, so I will do my best to work with the soft arguments.
To measure how far the trade runs, I used Maximum Favorable Excursion. This measure shows the maximum gain of the trade. It does not show what each trade gained from open to close. It is a perfect-world type measure. Maximum Favorable Excursion shows what the gain for the trade would have been had you closed it at the most favorable moment.
Lets look first at how the MFE looked on the Dow Jones.
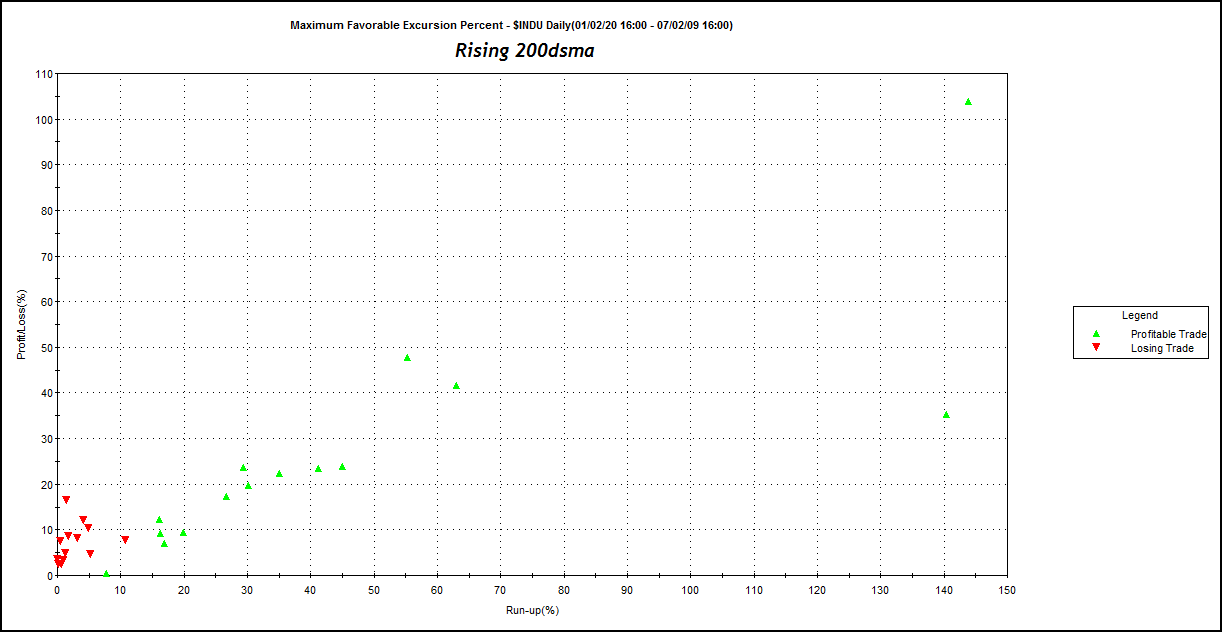
With a rising 200dsma, only 1 trade rose more than 50%, and 4 trades rose more than 30%.
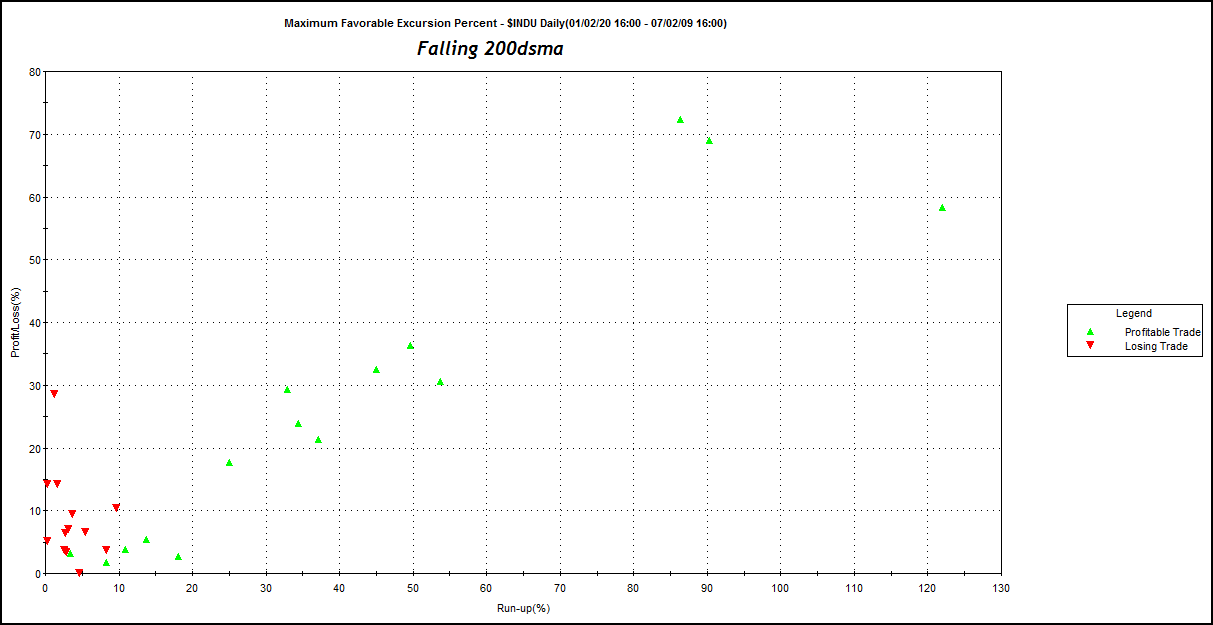
With a falling 200dsma, 3 trades rose more than 50%, and 6 trades rose more than 30%.
Again, without an operational definition of “New Bull Market,” it is hard to disprove the argument, although it sure looks to me like a falling 200dsma yields a better chance for trades that run higher.
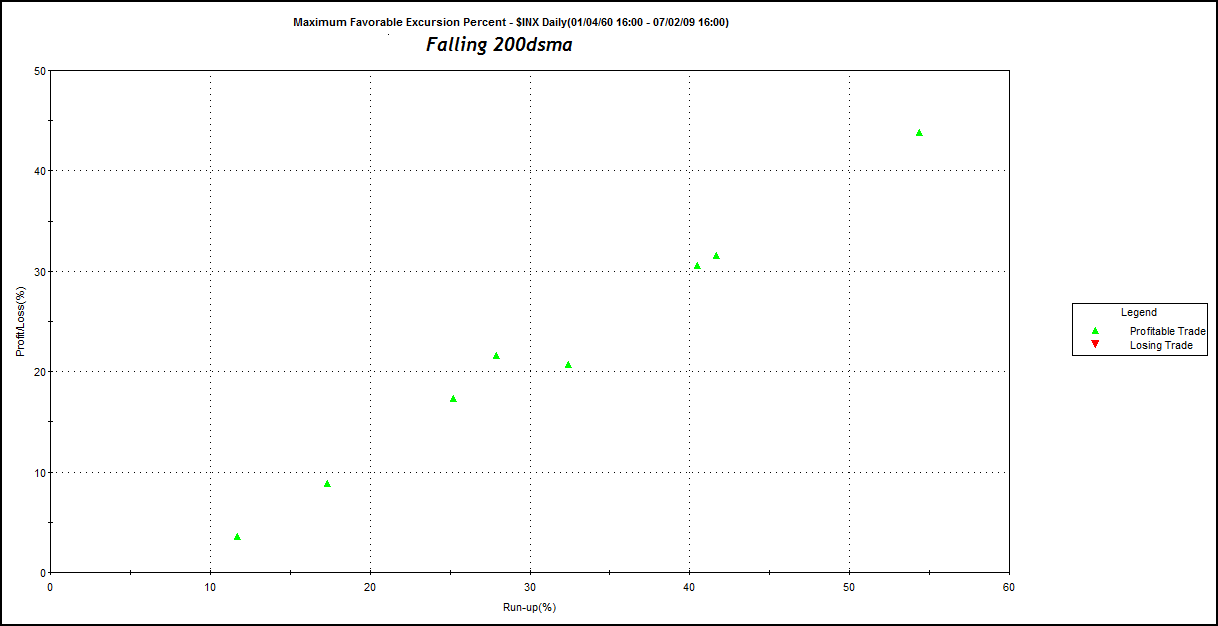
MFE on the SPX
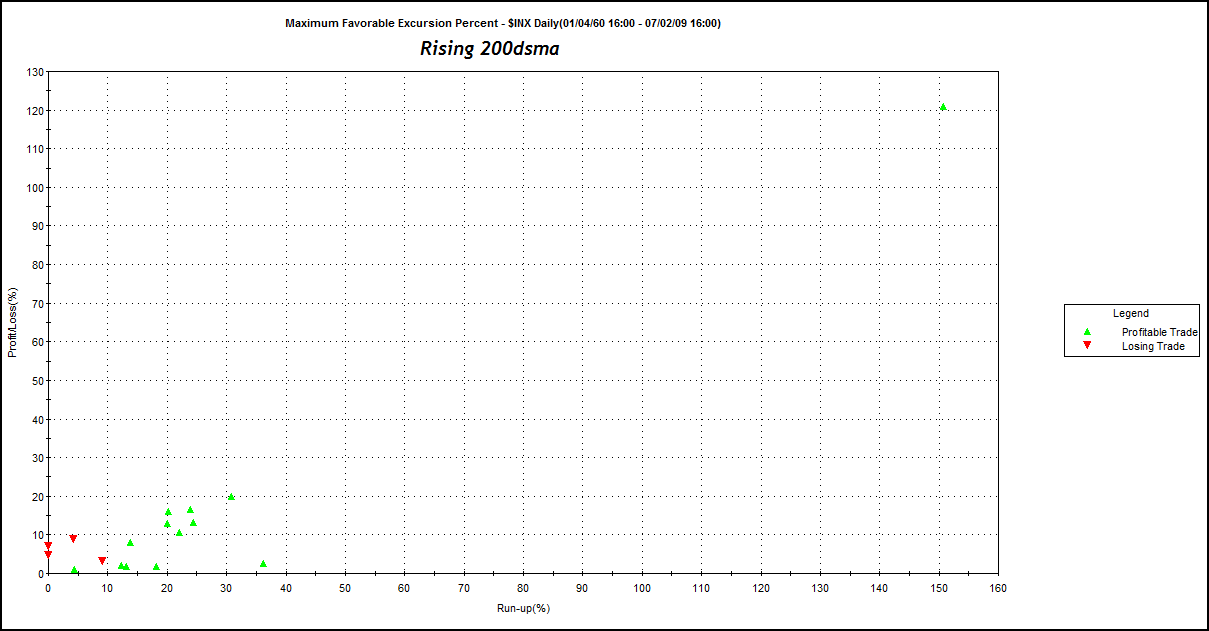
With a rising 200dsma, only 2 trades rose above 20%, with one of the trades barely making it above 20%. It is obvious that the bulk of the gains from the rising 200dsma trades came from the outlier trade which gained over 120%.
With a falling 200dsma, 5 trades rose greater than 20%.
It should be obvious at this point that a greater number of trades with a falling 200dsma go higher (new Bull Market?) than trades initiated with a rising 200dsma.
Summary:
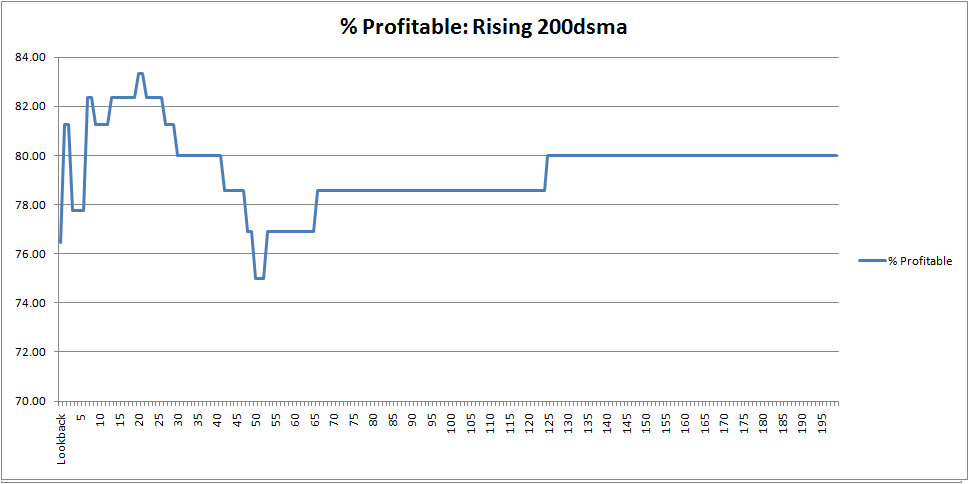
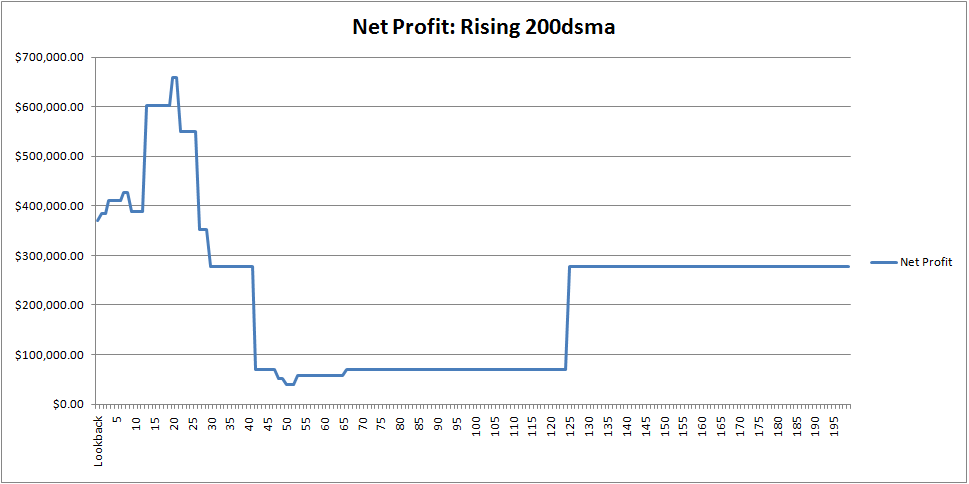
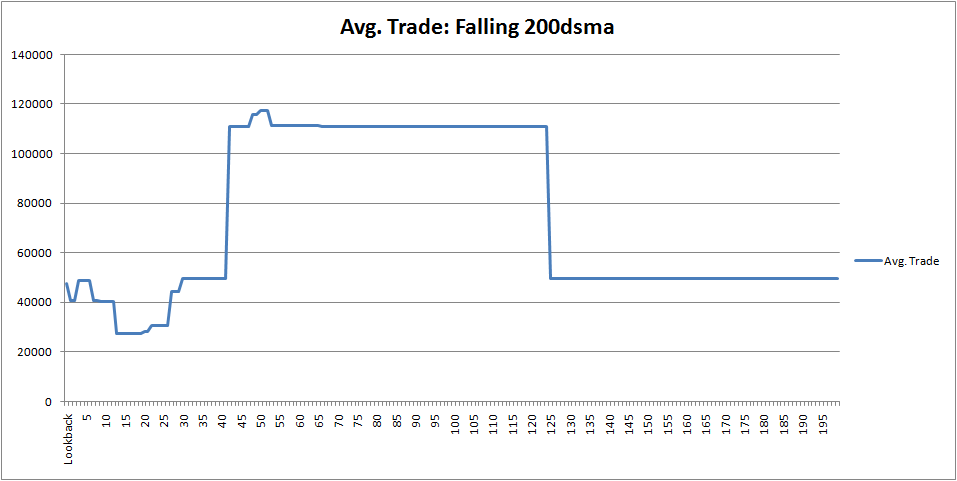
Across a variety of measures, the data show that there is a definitive edge to buying a Golden Cross with a falling 200dsma a 200dsma that has fallen more than it has risen. Indeed, whether we are looking at average trade, % profitable, or net profit, a falling 200dsma a 200dsma that has fallen for longer than it has risen performs equally as well or better than a rising 200dsma.
As for the claims that a falling 200dsma is “false” as the herald of a new Bull Market, the data again show this to be another myth. However, I am almost certain that the zombies will say that I do not understand the meaning of “Bull Market.”
As always, discussion/challenges are welcome.


Wood,
Congrats on the very thorough analysis.
Do you believe that we could reach new lows here and still keep true to your findings?
Hugo, while I’m still bearish, there are a few long-term technicals that are pointing towards the possibility of a longer rally.
In my gut, I feel we go lower, possibly breaking down to new lows.
If this happens, then it is likely the 50 will cross back underneath the 200 day average, making a losing trade.
Keep in mind that most traders, myself included, will eventually fail as a trader if we trade on gut alone. This is why I like to know the odds at all times. This keeps my gut in check.
Wood, did you know KD is the antichrist? He got extra flamboyant during one of his youtube rants a few months back, and I swear he did this head swivel where he had these red eyes and horn stubs. It was just for a split second, after which he returned to his usual turgid posture. The guy is an evil superhobbit.
Jeez, DSB, and I’m trying so hard not to resort to ad hominems…lol
Zombies are easy to kill, fyi.
One thing Zombies do not like: cold, hard, data.
You have to hit them in the head though or they don’t go down
Wood, while your research has indicated a new bull market signal, have you taken the trade, or not? If not, why not?
Did you take the trade on the new bear market signal when it triggered 18 months ago or whenever it triggered?
Juice, in my IRA, I am allocated 40% long as I am following a very similar method which uses the 10 month moving average rather than the 200day. See Mebane Faber’s site for more information. Check out his “Timing” tab. I am long Domestic and Foreign stocks, 20% each.
I have not and would not take a long-term buy and hold type signal in my trading account. As you probably know I’m a short-term swing trader and thus hold positions for 1-10 days, on average. In my trading account, I shoot for 20-30% annualized. The Golden Cross may give a 30% return, but I would expect that it would take upwards of 2 years to get there, if the trade works out. I would not tie up my capital for such a length of time.
This should answer your last question, in regards to the last bear market signal. You can go through my old posts and find post after post where I expressed that it was time to get short.
Again, pretty difficult to quantify “new bull market” until after the fact. Then, even if you show data, you’re going to find that they make fundamental arguments (no new jobs, housing still falling) to argue that the cross can’t be right. They brought a knife to a gun fight.
One question: How far underwater are you on your “Golden Cross” buy, and how stubborn will you be sticking to a blown trade?
And oh by the way, whoever the syncophant is who claims that I banned woodshedder – wrong. Go look at the FAQ on the forum – bans are instantly visible to everyone (they show up under the user’s login ID)
Smoke and mirrors. The point is that you claimed something that simply wasn’t true, as in – not supported by statistics, history, or facts. In other words, you made a prediction based on what you THINK is going to happen – an educated guess really, but tried to pass it off as an empirical fact and you got called out on it. Really, is that not the same thing you are attempting to do to the other BS artist?
Karl, some questions for you:
1. Where’s your data?
2. Where’s the thread where we debated your data, or lack of it?
3. I have now answered your final assertion, which was that Kneale said that a Golden Cross can herald the start of a new bull market. In fact, he was right, as I’ve shown above, that there have been more, and larger moves that have came from a Golden Cross with a falling 200dsma than a rising one. What say you good sir?
Had you not deleted the thread, I would not have to be paraphrasing your previous assertions.
I object to the pejorative “sycophant” (please note proper spelling Karl)
Defintion: A sycophant (from the Greek ?????????? sykophánt?s) is a servile person who, acting in his or her own self-interest, attempts to win favor by flattering one or more influential persons, with an undertone that these actions are executed at the cost of his or her own personal pride, principles, and peer respect. Such a manner is called obsequiousness. http://en.wikipedia.org/wiki/Sycophant
I’ve been called many things during my time posting on this board but that is, by far, the most inaccurate.
Oh, by the way – stop listening to racists like Hal, Karl because they’re softening your limp noodled brain.
no no…he called you a ‘syncophant’, which, as we know means, only one thing (courtesy of urbandictionary):
“A misspelling of the word “sycophant” used by ignorant ghetto people and neocon morons.”
lol.
Holy crap that is some funny funny stuff guys!
I thought DP was joking til I looked it up:
http://www.urbandictionary.com/define.php?term=syncophant&defid=2572829
We have a golden cross on DJI, SPX, RUT, HUI.
COMP, DJT are trying to get theirs. Looks good for the bulls if this theory holds.
Some people label a bull super cycle from 1932-2007, I wonder would this render the past results of the golden cross less reliable as times have changed
Hugo I have read the theory of the bull super cycle. Should it prove true, then things would certainly be different.
However, how many years might it take to know that an 80 year cycle is busted?
What would confirmation be?
It seems to me that the only convincing argument one could make for using an upward trending MA in conjunction with a MA crossover would be for a sell signal. As Woodshedder’s has pointed out waiting on an upward trend will force your trades to come later in the cycle, consequently cutting down on your W:L ratio.
I am guessing if you used a statistic like Linear Regression Slope of a MA over a certain number, 0 for example, as an entry which would generally put you in shortly after a MA cross, but might allow you to avoid catching falling knives, one might improve there statistical results. And then use the MA crosses as an exit.
Just my thoughts.
As I have stated before, I would think the upper-hand would go to using an Endpoint Moving Average vs. a SMA or EMA which is essentially just averaging prices together. Furthermore it would be interesting to see how even the Golden Cross performed on something like Gold, Oil, Wheat, or Foreign Indicies for example.
Redshark, on my to-do list- get the code for the Endpoint Moving Average.
Not a bad idea, re: the GC on various commodities and foreign markets.
Woodshedder,
Can you think of any specific futures or markets that you would use? I always like to throw the Nikkei in there because it has done so horribly for the last decade, and I feel like it makes your end data more honest, but I do not have a lot of other insight into testing a strategy against a broadly diversified group of price data.
Keep up the good work. I realize how much time you put into each of these post.
I’m a bit confused by your data. Last I saw the best win % was 59%. Maybe I dont know your lingo but how can then the %profitable be anything greater than 59%. I guess I’m just wondering how you can lose but still be profitable?
Would you mind posting your raw data? Maybe a simple CSV format?
Viper, the previous post used Dow Jones data, as the non-believers initially reacted to my SPX data with skepticism, saying that if it were run on the Dow, it wouldn’t work.
The data above is from the SPX, the same dataset I used in the first post.
As for how you can lose, but still be profitable…Viper, do you trade much?
A math lesson:
System A: %profitable = 75%
Avg. winner = 100.00
Avg. loser = 500.00
Expectancy = (Probability of Win * Average Win) – (Probability of Loss * Average Loss)
E = (.75*100)-(.25*500)= -125.00
Thus System A wins 75% of the time but is still expected to lose 125.00 per trade.
System B: %profitable = 35%
Avg. Winner = 300.00
Avg. Loser = 150.00
E=(.35*300)-(.65*150) = +7.95
Thus System B wins 35% of the time but is still expected to win 7.95 per trade. It loses but is still profitable.
Similarly to System B, the Golden Cross with a falling 200dsma on the Dow Jones may win on average only 55% of the time, yet the winners are 2.5x as large as the losers.
Which data do you want posted? Tradestation does not provide a .csv of the dataset. I can however provide a list of the trades. It will be up to you to tell me exactly what variation of the system you would like for me to run in order to generate the trade list, and which index, SPX or INDU you would like to see.
Ok, so this is different data than previously. Ok, got that now. If all your using is tradestation data, then yahoo should be just the same and I dont need a .csv
One more thing that doesnt quite jive.
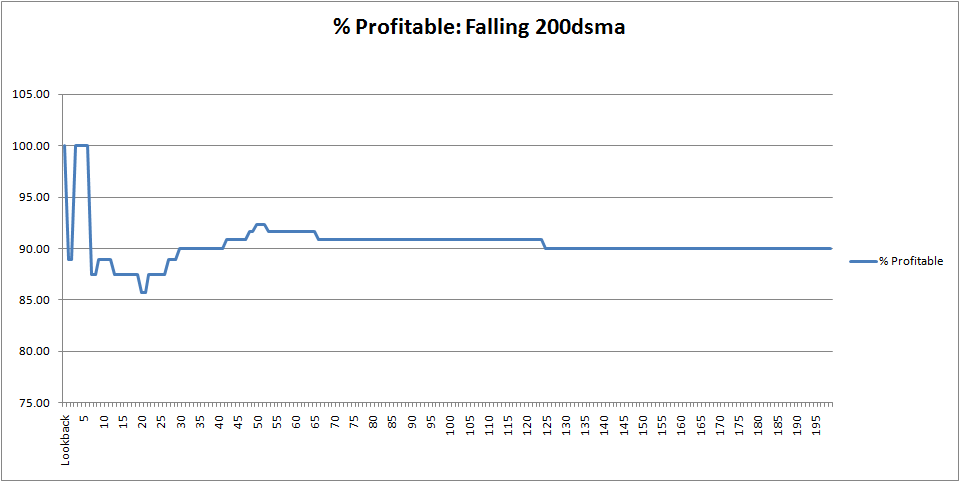
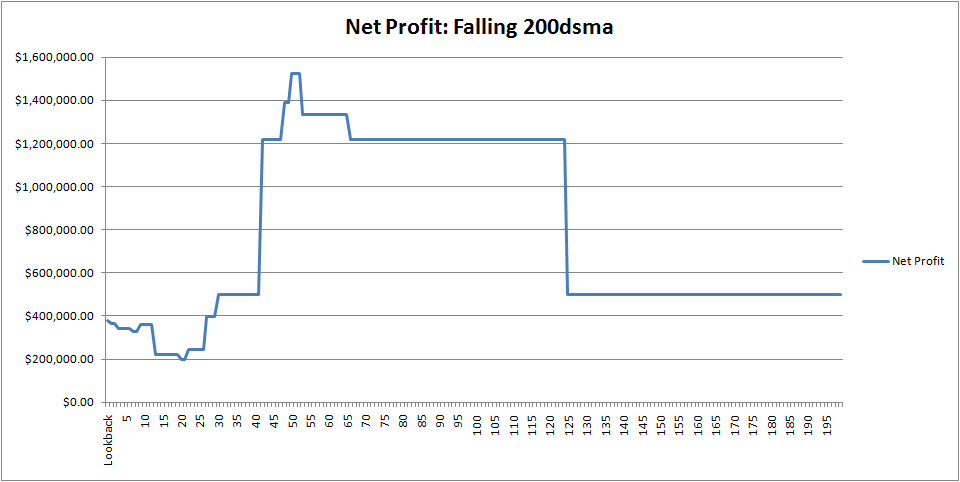
You %profitable graph of the downtrending 200SMA and net profit graph do not seem to match up. With a lookback period of around 5 days, you have a profitablity of 100% yet your net profit is less than a lookback of around 50, which is your highest net profit.
The 5 days lookback should include all of the same trades the 50 days look back included and with 100% profitablity, and with including the same trades, you should have at least the same net profit. Correct? If the 50 is not a subset of the 5 days lookback, then the 50 must be including some rising SMA trades….which is not what the graph says.
No, this is not different data from posted previously. It is all the same SPX data. However, in the first post I did not present the data in the same format as above.
As for %profitable, keep in mind a system can win 100% of the time, but still not make as much money as a system that wins 90% of the time but has a larger average trade.
In fact, that is what the graphs show. Even as %profitable decreases, the avg. trade increases. It is the sum of the average trades which makes the net profit.
The 5 days lookback cannot contain all of the same trades as the 50 day lookback. That is impossible.
Go back and re-read the methodology for determining whether the 200dsma is rising or falling. My testing looks back n days, and tests to see if the average is above or below that point. Does a one-day rise or fall make a trend? Nope, but that is how many have been testing for a rising or falling 200dsma. However, we can lookback 50 days, and say, hey the average is lower than it was 50 days, this is probably a trend. True, it can be higher than it was 5 days ago and still be lower than it was 50 days ago.
You are now beginning to understand why some people working this data seem to have confused themselves. This is because there is not an agreed upon measure of what constitutes a falling or rising 200dsma.
So now that I understand that your lookback does not guarantee that the 200MA had been falling for X days, I am left to use your 1 day look back percentage….and its BARELY better than 50/50…its 53% using your data. I have to use that data since that is the only one that guarantees the the 200MA was actually falling when the cross occurred.
So if you want to argue the 3%, then yes…Karl is wrong.
BTW, if you do not guarantee that it has been falling for X days…then your summary in the last post can be misleading. Instead of saying “The 200dsma has been falling for more than 200 days.” it would be more in line with your data to say “The 200dsma is lower than 200 days ago”.
Viper, why would you use only the 1 day look back? So if the index closes lower one day, it is falling, or rather, downtrending? Don’t fit the data to fit your thesis. You are too smart to think that a trend is made by one data point being lower than one other data point.
However, if you insist, using the 1 day lookback on the SPX, falling still outperforms rising 🙂
Seriously though man, this is getting a tad ridiculous. As the 200dsma begins to resemble what most reasonable people would agree is “falling,” the results get stronger. So to be clear, even with the least robust definition of falling, the GC outpeformed a rising average.
Why are you fixated on this 3%? I have shown that the 3% doesn’t matter that much. Karl is wrong across the board, regardless of the exact %profitable.
I not sure how much more this stuff can be massaged. At some point you’ve got to realize that your paradigm needs to be adjusted. Let it go, take what you’ve learned here and apply it in a way to make yourself richer in the future.
Otherwise, this is beginning to look like you trying to bend and massage the data anyway you can to prove your (Denninger’s) thesis. Honestly, I don’t see how your analysis has presented a viable challenge to my results.
You are correct though that the summary of the posts are unclear and need to be re-worded.
great research woodshedder! i always like a guy that can prove a point with good old data. we should enjoy a strong bull rally now. dont let the doom sayers get you down.