After seeing $SPY run up to the 50 day average and then reverse, I was feeling pretty good about my expectation that the correction would continue. Then I read the Quantifiable Edges study, Why The Strong Breadth The Last 3 Days Should Be Viewed Positively By Bulls, posted in What I’m Reading This Weekend.
After seeing Hanna’s breadth results, I’m very curious about what the results of this study will be. As I’m writing this, I still do not know.
The Rules:
- Buy $SPY at the close after 3 consecutive higher closes AND the close is beneath the 50 day simple moving average
- Sell $SPY at the close X days later
- No commissions or slippage included
- All $SPY history used
The Results:
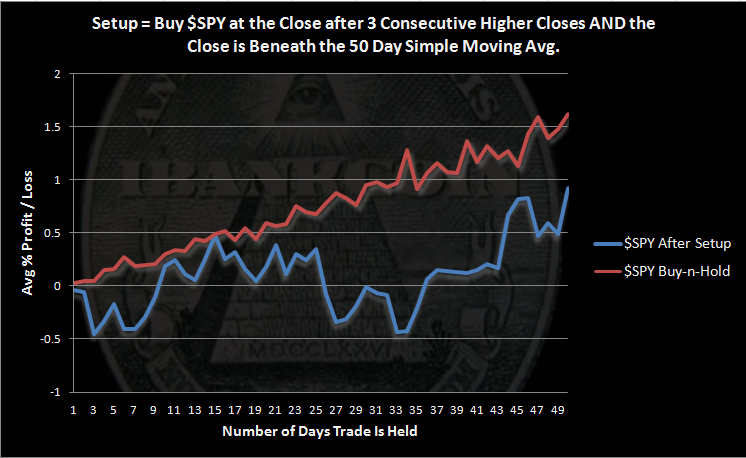
There were 94 occurrences of this setup and 39 trades were able to be held for the full 50 days.
As the chart shows, this setup under-performs $SPY buy and hold. This may be due to the requirement that $SPY close beneath the 50 day moving average. I would call the results of this setup neutral to bearish.
The results posted by Quantifiable Edges are more bullish than my results. I would like to see that breadth study add the condition for the close to be beneath the 50 day average.
I have written many, many times about how hard it is to find a study that yields bearish results. The market has a bias to the upside, and study after study shows the bias. This study, however, does not. The results, while not earth-shaking, should be viewed as a caution signal. My interpretation is that we can expect more volatility, more up and down, while ultimately moving sideways, for at least a few weeks.


Great points, Wood. Thanks.
Thanks brotha!
Excellent report Wood. Really love your studies.
Really interesting.
Maybe I’m reading too much into this, but assuming that the “average” 50 DMA line tracks your buy and hold equity line fairly closely (the BH results in the chart should be just slightly above the 50 DMA of the average BH), I see the SPY testing the 50 DMA twice, at 11 and then 16 days, and getting rejected both times. I’ll predict that a failure for the SPY to cross its 50 DMA is bad news for at least the next 30+ days, while jumping across is probably more bullish than many think.
Hi Woodshedder!
If you add a filter on my study that requires a close under the 50ma, then there will only be 4 instances. Not that I would read anything into 4 instances, but in case you are curious…short-term they struggled a little, but the longer-term results were just as strong as the larger sample, with all 4 higher in the 70-90 day timeframe.
Keep up the good work over here!
Rob
Nice work, Woodshedder.