Sun Feb 7, 2016 9:47am ESTComments Off on The Bear and Bull Case for Gold
This run in Gold in 2016 has pretty pretty epic, and I am rather pissed I haven’t traded this whatsoever. That being said, let’s take a look at the charts and analyze some price action and see where we are potentially headed.
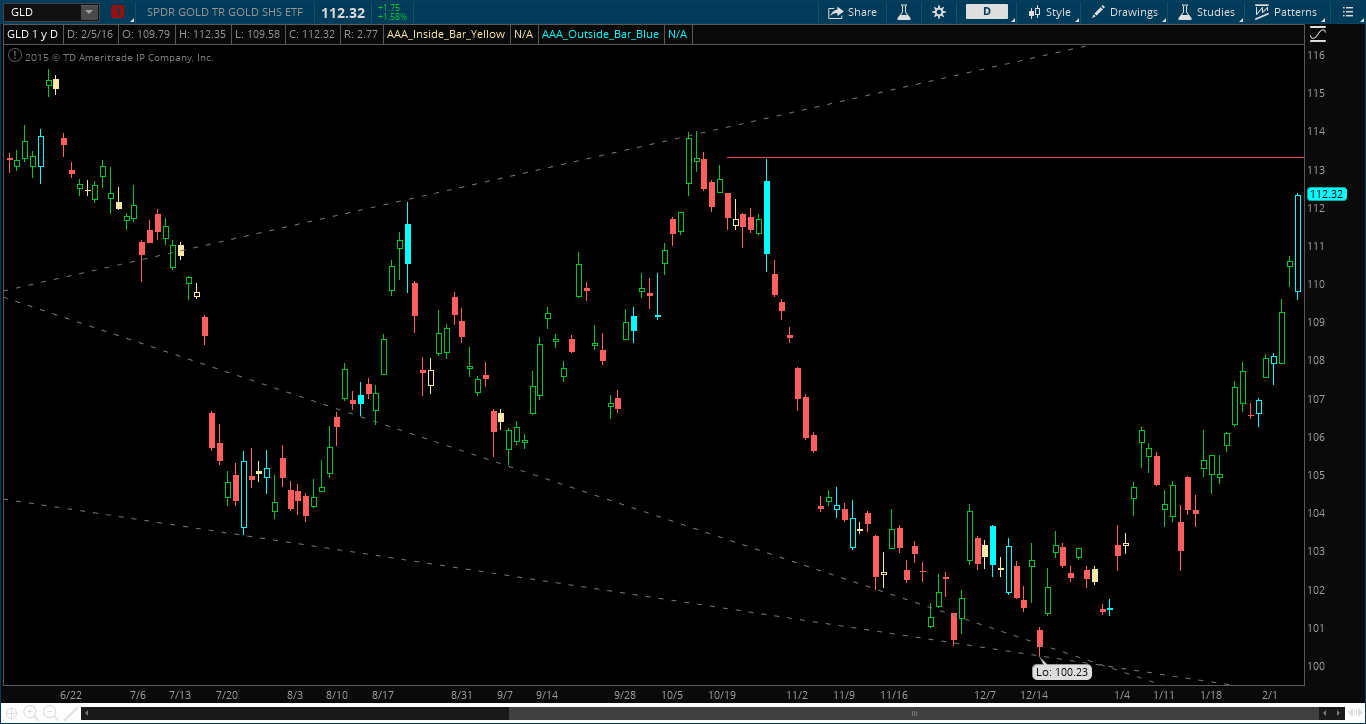
On the Daily chart you can see we are getting pretty extended, especially after Friday’s bullish-engulfing day. As we steam roll higher we have resistance at 113-114; a good spot to take some profit, or sell some calls, if you’ve been long this ETF all year.
GLD Daily Chart
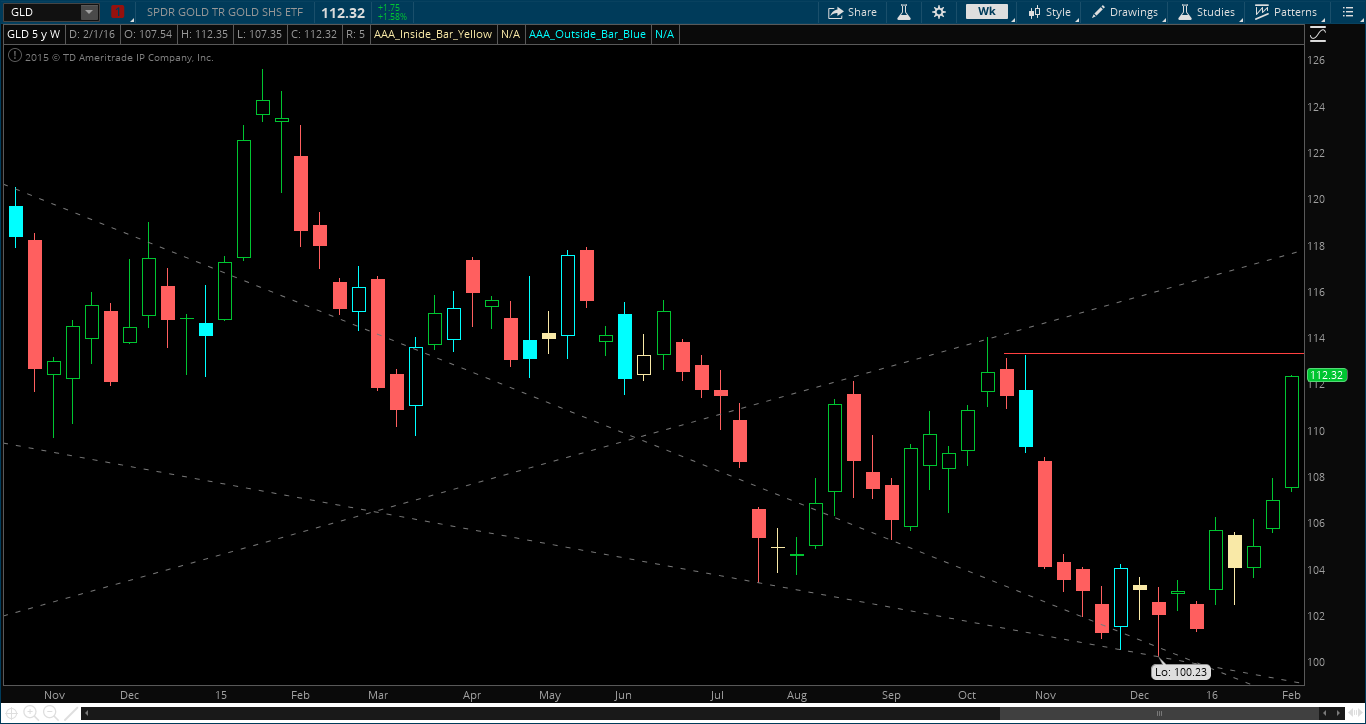
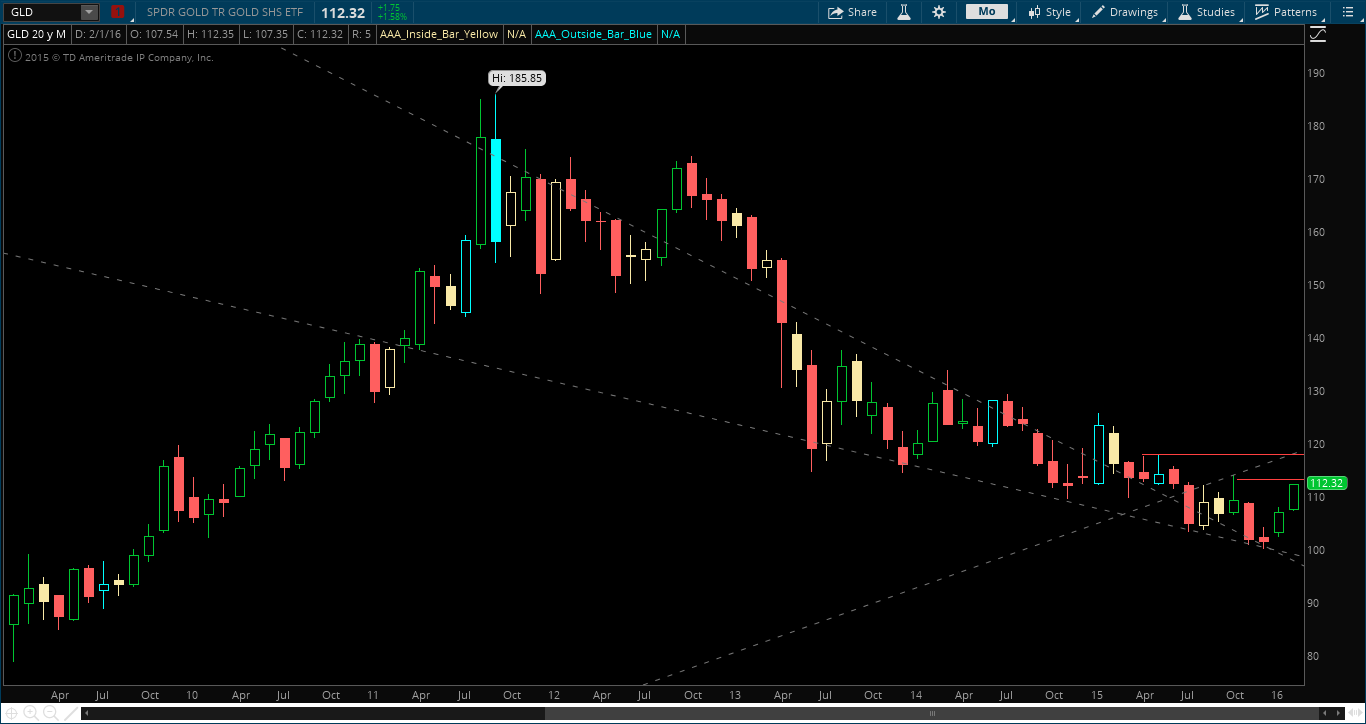
On the weekly/monthly charts you can see that the 115-118 level of resistance might cause some problems, or at least a small stall in price action.
GLD Weekly Chart
GLD Monthly Chart
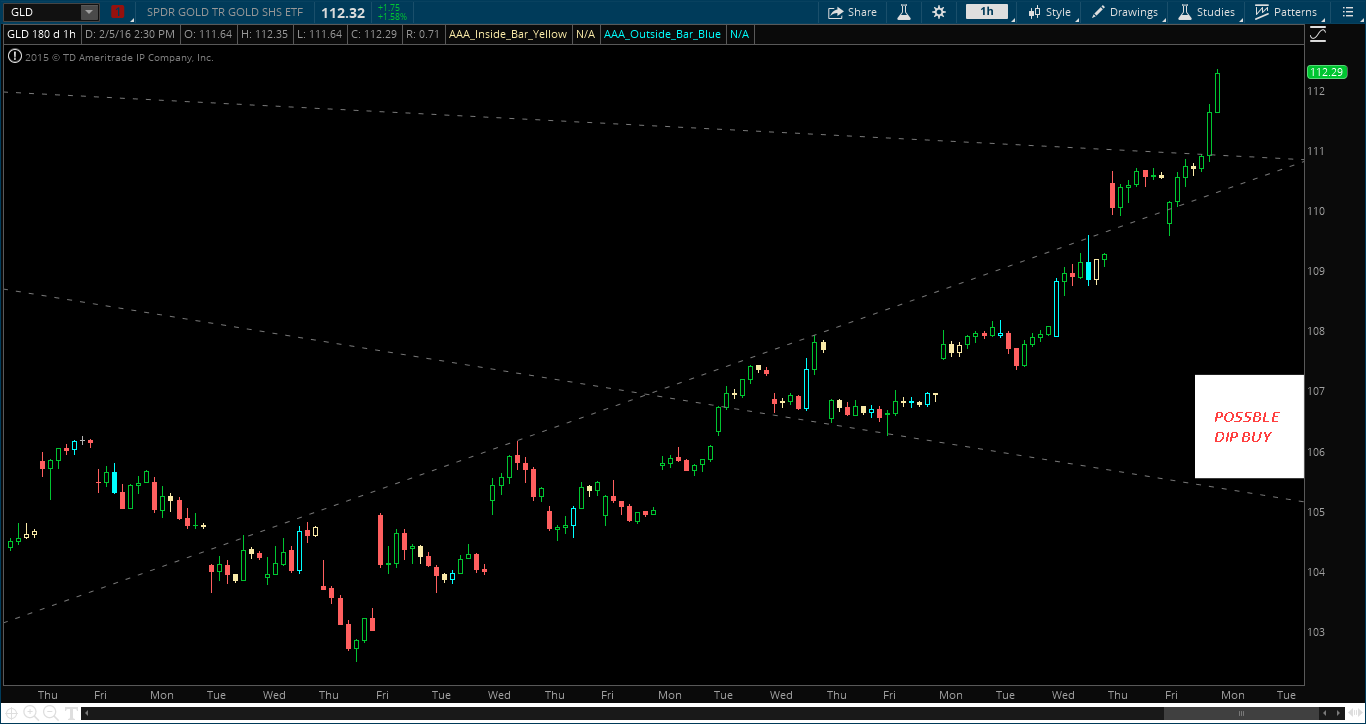
So this all being said, where does that put us if we have totally missed the boat? What’s the plan on GLD going forward?
Seeing as I missed it, I’ll probably be selling near-term options if we get much more extended than this. The February 115 Calls closed out at .75 cents on Friday and will be trading well over $1.00 if we get to ~113.50 resistance early next week. Obviously we won’t be going in blind, as we’ll look for a short-term sell signal into resistance.
Long term, the weekly and monthly GLD charts look pretty great. As we stated earlier the 115-118 levels of resistance may cause some choppy action, but if your holding period is longer than a month or two I believe we see 130 this year, so long as we hold 100-105.
If you are a buyer of the GLD ETF you must wait at this point, as the risk/reward in not in your favor right now. I think we get a better buying opportunity in the 105-107 range.
How many times have you heard that? Every day? Every other day?
Well, if you have found that you yourself have said that, I’m here to lend a thoughtful hand and tell you that “Sitting on Your Hands” could equal cold, hard cash money – if you play your ‘options’ right. Get it?
Listen: If you are a trader, your JOB is to make money and constantly generate alpha day in and day out. If you manage a portfolio, it is a little different, but generating alpha (or atleasting collecting premium) is definitely under-utilized in this industry.
Listen, trading options is not easy. But here are the facts — about 70-80% of options expire worthless every single week. I feel like that’s a VERY high probability trade if you A) have an IQ higher than an ape and B) have the capability to do so, right? Rhetorical question – it’s a damn good strategy to generate alpha in a low VIX environment.
Case in point, today I really had no expectations for much movement. It has been a slow week, and I pondered taking the day off — but I said to myself, “Self, I can sell premium! Get off your ass!”
That being said, in order to conservative a little buying power and at the same time trade something with a little premium baked into the option, I love the UVXY.
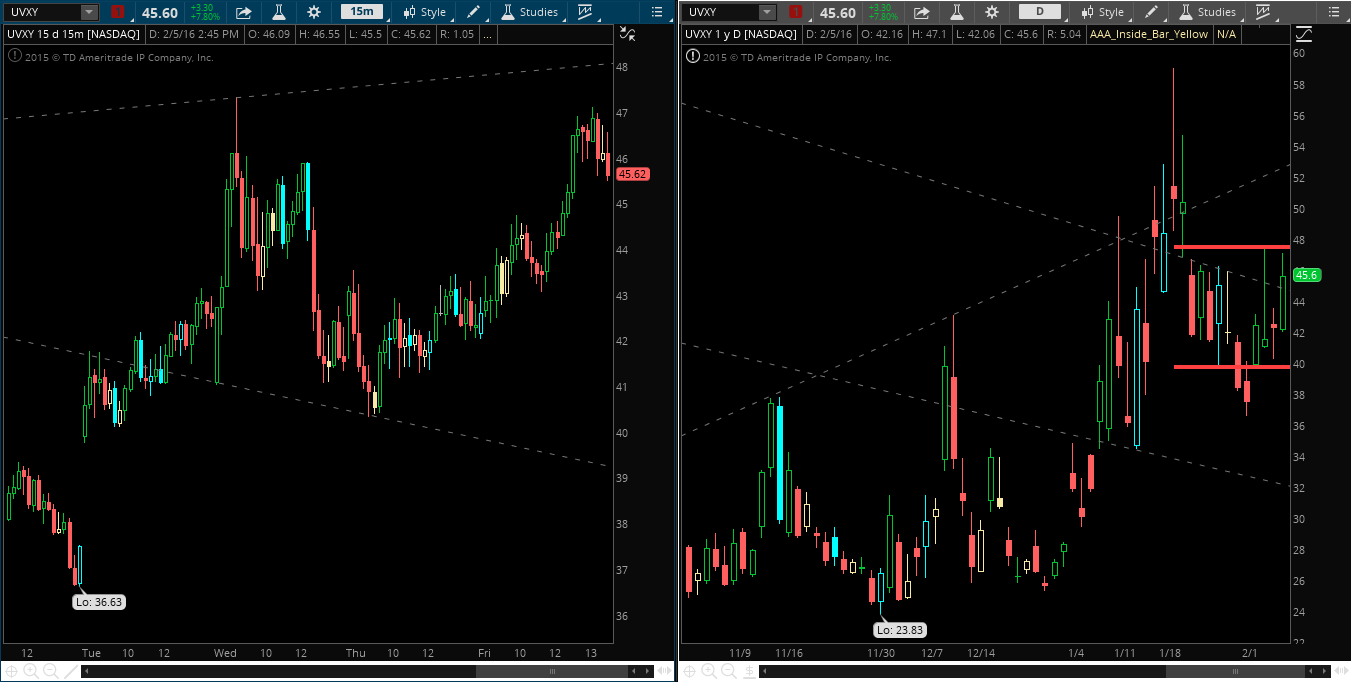
Below I have two side-by-side charts that we can use for this example – a 15-minute and daily chart:
UVXY 15-minute/Daily Chart
Off the open the market decides to swan dive and UVXY calls get jumpy — love the premium spike.
Now if you look at the daily chart you can see a well defined range for UVXY: 40 on the low side and 48 on the high side. A perfect situation for an option strangle (stay with me, I know the jargon may scare some people, but bare with me).
That being said, let’s sell some low side puts and high side call options around this range. The 40.50 Puts were selling around .30 cents with the 47 calls bidding at .40 cents.
Now, let’s assume we have 10 contracts each: we have collected a total of .70 per contract, or $700. Now the easy part…we wait.
As the market swan dives our puts quickly deteriorate into the depths of hell, to nothing, and we can close them out mid-morning at .02 cents.
However, as the market continues to puke like a Freshman in college after bonging Jungle Juice all night, our 47 calls start spiking. Here we have two options:
We can buy the stock (creating a covered call)
Simply sell our call option for a net profit
Option 1 is IMMEASURABLY better because we can put ourselves in a “guaranteed” win position so long as we buy stock below our strike price of 47.
Here’s what I did:
I ended up purchasing the stock around 46.50 as it climbed to the highs of the day (as 1 contract represents 100 shares, we should buy 1000 shares of stock, hypothetically). As it UVXY hovered around 47, we have no fear because we are covered long with stock. At this point we have a .50 cent gain in our stock, but the options have gone from .40 cents to .70 cents – virtually a break even trade. (+$500 on the stock, -$300 on the option)
I put my stop at even on the stock and let her ride. We have a guaranteed winning position if we play our cards right.
As we get into the last hour of trade I am stopped out at 46.50 (even trade for the long stock) and we only remain short our 47 Call Option. UVXY begins trading around $46 to end the day — all the while our remaining call options decay into an oblivion.
Yes we had to “trade around” our short call, but it was no sweat.
To make a long story short, the options market is where you should be living on Friday’s. Between option decay and extreme premium explosion during expiration, you are doing yourself a huge disservice not trading these products.
I wanted to provide a little bit of value here at iBC — rather than rant about the market.
Turn off CNBC, grab your favorite bottle of vino, and read this Shakespeare-esque diatribe against phony traders everywhere.
First I need to provide some backdrop.
I “ran into” a trader today on Social Media. Said ‘trader’ is a joke. He’s a phony. He couldn’t trade himself out of a wet paper bag if he tried. I don’t want to use the ‘F’ word, but I’m pretty sure he’s crossing the line (fraud….if you can follow along).
But hey, he has “30 years trading experience.” He must be legit, right? He incessantly posts his daily PnL on Social. Boasting his 4-figure gains daily. “I made $7,000 today drinking wine at my house in the foreign lands,” he proclaimed.
“I’ve had it,” I thought. “I’m calling bull shit.”
To make a long story short, we bantered back and forth for shits and giggles until he subsequently blocked me. Nothing accomplished.
But it got me thinking. Every DAY he posts his PnL from trading AAPL.
EVERY. SINGLE. DAY.
First: stop dry-humping AAPL like it’s your first prom date.
Second: if you must BUY stock, which one do you buy?
If you look on Social, everyone and their mother can apparently only buy long stock; dear God we would be shamed into the fiery depths of hell if we shorted this market (or better yet, sold options).
So let’s say that it will not change. I will ONLY buy stock with a long bias, even if the market is swan diving into an oblivion. What we must do here is identify the criteria for which we are buying stock, right? Certain stocks are green every day, every week, every month — even in bear markets. Find them.
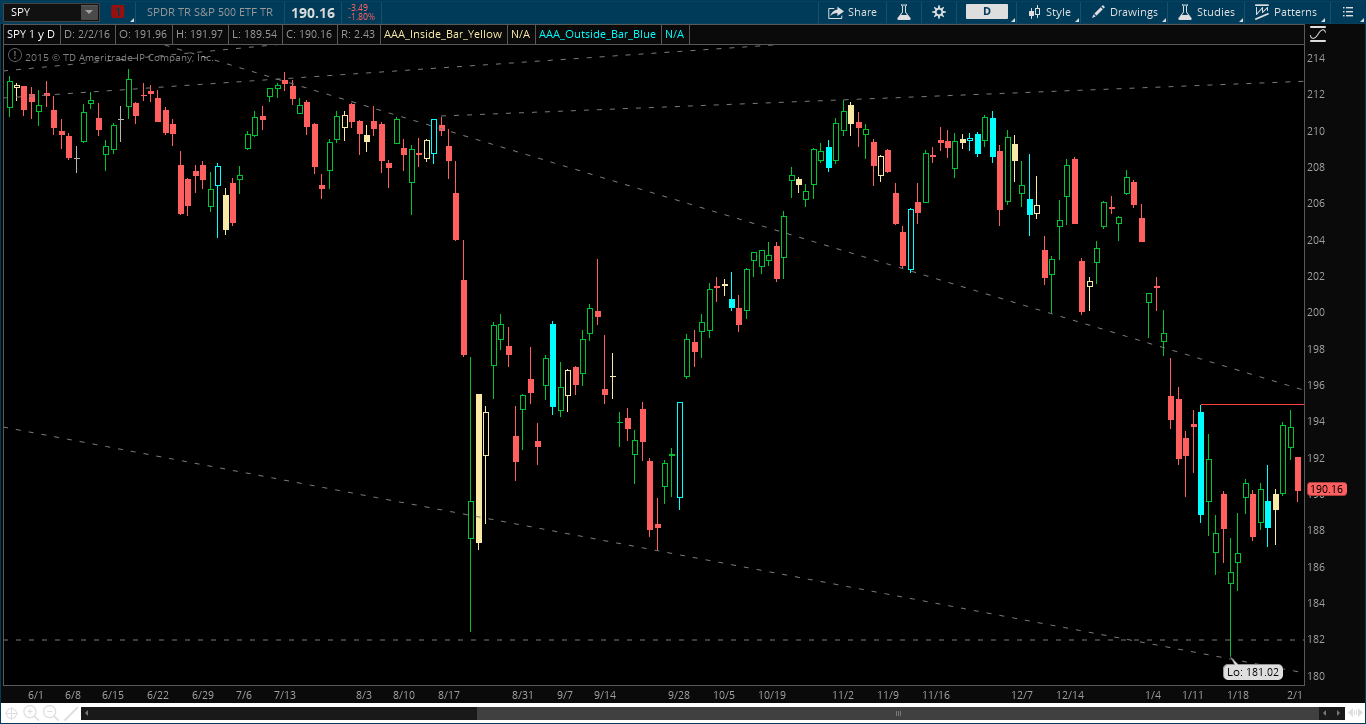
The goal here is find stocks that are trading higher than they opened on a specific time frame. For example, we opened at 191.96 today in the SPYs. For literally 98% of the the trading day, we were trading below this price and we have a red candle. All day, no buy signal. No real reason to test longs, as we are lower than we opened for the day, the week, and the month throughout the day today.
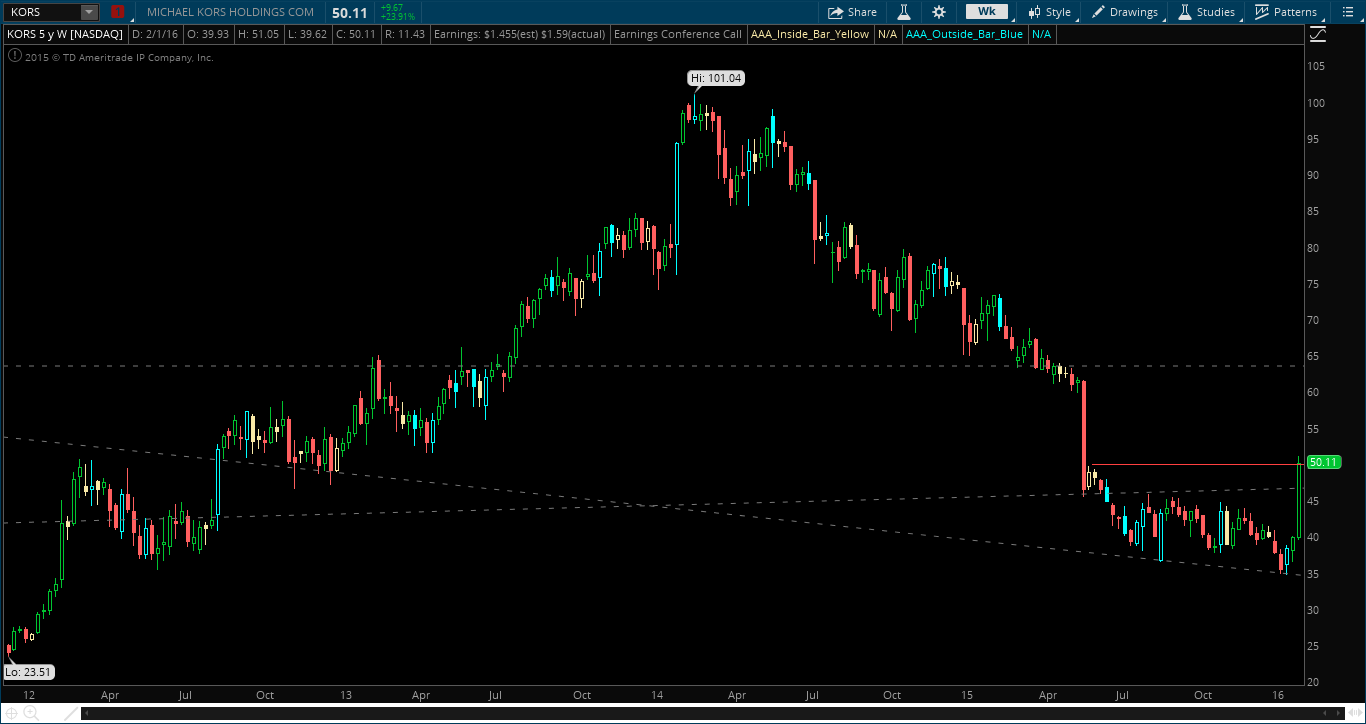
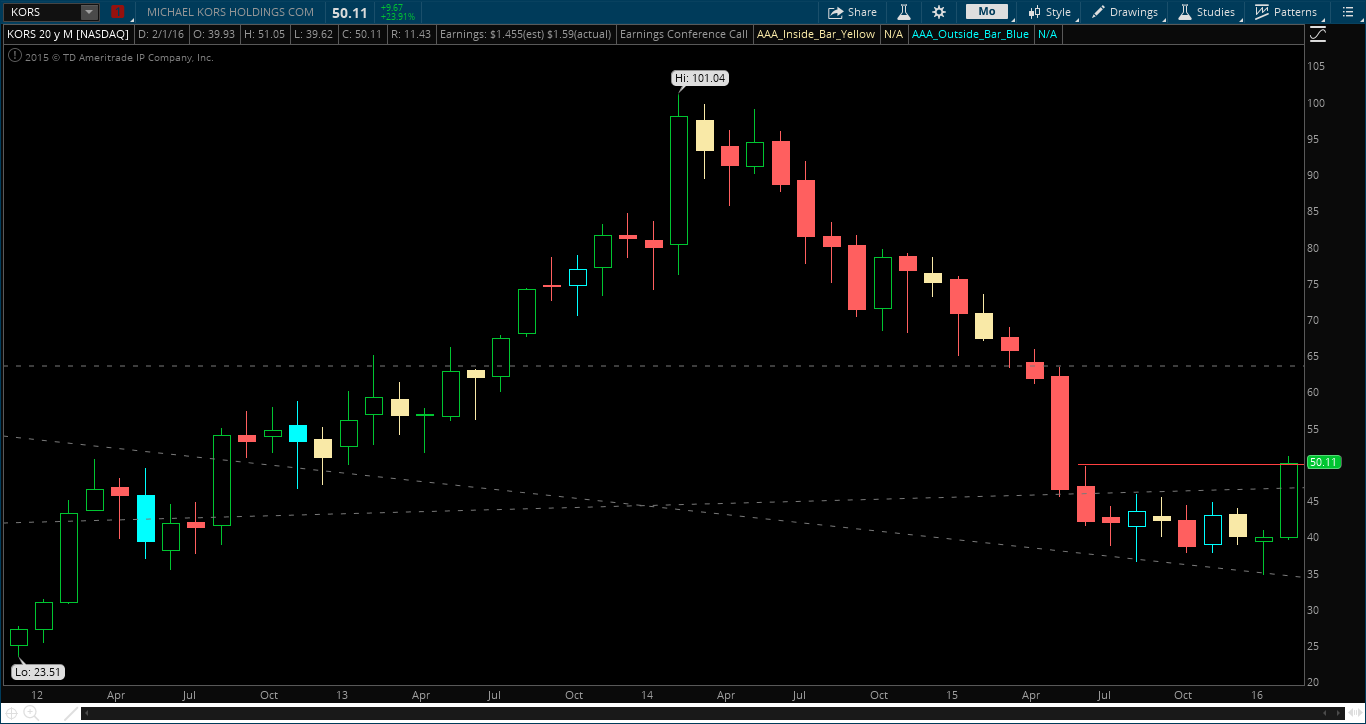
However, if you look at KORS (below), you can see that not only are we trading higher than we opened for the day, but we are trading higher on EVERY time frame. We are not within the prior months range, and we are most definitely breaking out. We cannot identify any sell signals on long time frames (day/week/month). Yes I understand it was a gap up due to earnings, but the rules still stand the same. We want to be trading in the direction of the trend, and I’d say this trend is bright green.
KORS Daily Chart
KORS Weekly Chart
KORS Monthly Chart
KORS is a great example in hindsight, but will also be in play the entire month. But there are also other ways to find stocks that you want to buy. Scan for stocks that are outperforming on the day/week. Scan for stocks that are trading above last weeks/months highs. These are all PROVEN stocks that have bucked the trend. Buy stocks that are on the highs when the market is on the lows – clearly they are getting bid up.
In summary, our goal as traders is not to prove to the outside world that you are a better trader than anyone else. Our goal here is to put ourselves in highly probable situations that we can take advantage of, and maximize profits. Start trading the trend, rather than fighting it.
Tue Feb 2, 2016 6:28pm ESTComments Off on One (Bounce) and Done: Slow-Bleed Lower
Our thoughts heading into this week were as follows:
Take out last weeks highs and creep higher until eventually heading lower in the coming weeks.
That’s it.
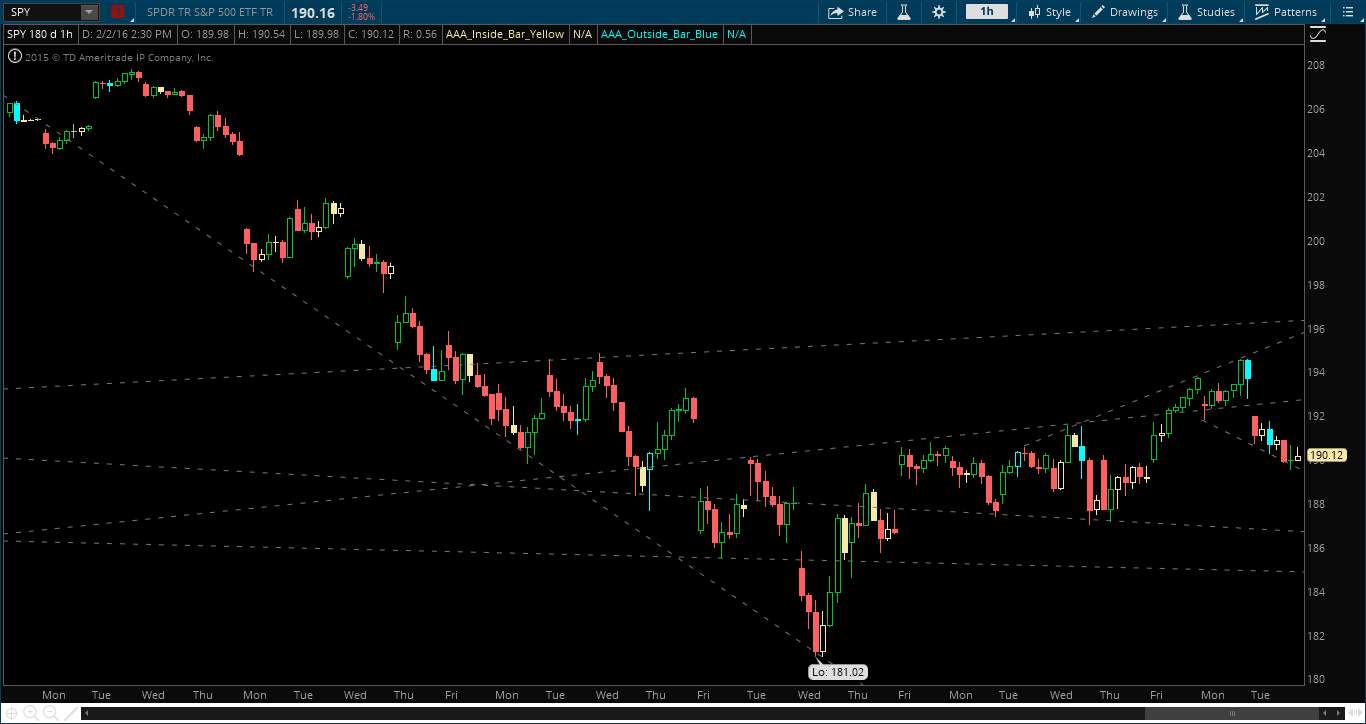
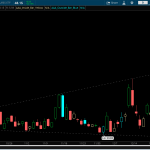
As you can see we popped up Monday and took out last weeks highs just briefly. As we came into today the futures shit on us and we opened down 1% and we were subsequently left to die helplessly all day. The slow bleed-out of death.
SPY Daily Chart
Is that it? Was Monday’s “rally” all the market could muster?
Now, I’m not a perma-bull nor a perma-bear. Frankly, I couldn’t careless where the market goes, I just want volatility. But, IF (big IF), yesterday’s action was all we can muster – it’s time to start protecting yourself. As of right now all time frames (Daily, Weekly, Monthly) are lower than they opened. Therefore, bias’ are to the short side.
As I’ve said for a week or so now – the lows from February are a huge level that we must hold (if you are in the bull camp). If we do hold them, we can assume that we will be inside month for the month of February (the trading range for February will be completely within the January range). An inside month now provides us with an ‘actionable signal’ as we call it — an equilibrium. Best case for the bulls is we go inside month in February, then take out the February highs in March.
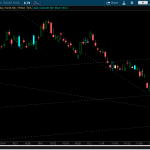
BUT – if yesterday’s rally was all we could muster in the short term, then this will get ugly quickly. As you can see in the 60-minute chart below, we see defined support around 186-187 in the SPY. Barring some preposterous gap up in the futures overnight (don’t count it out, I’m pretty sure the futures guys are on acid), this market get’s heavy very quickly.
SPY 60-Minute Chart
REMEMBER:
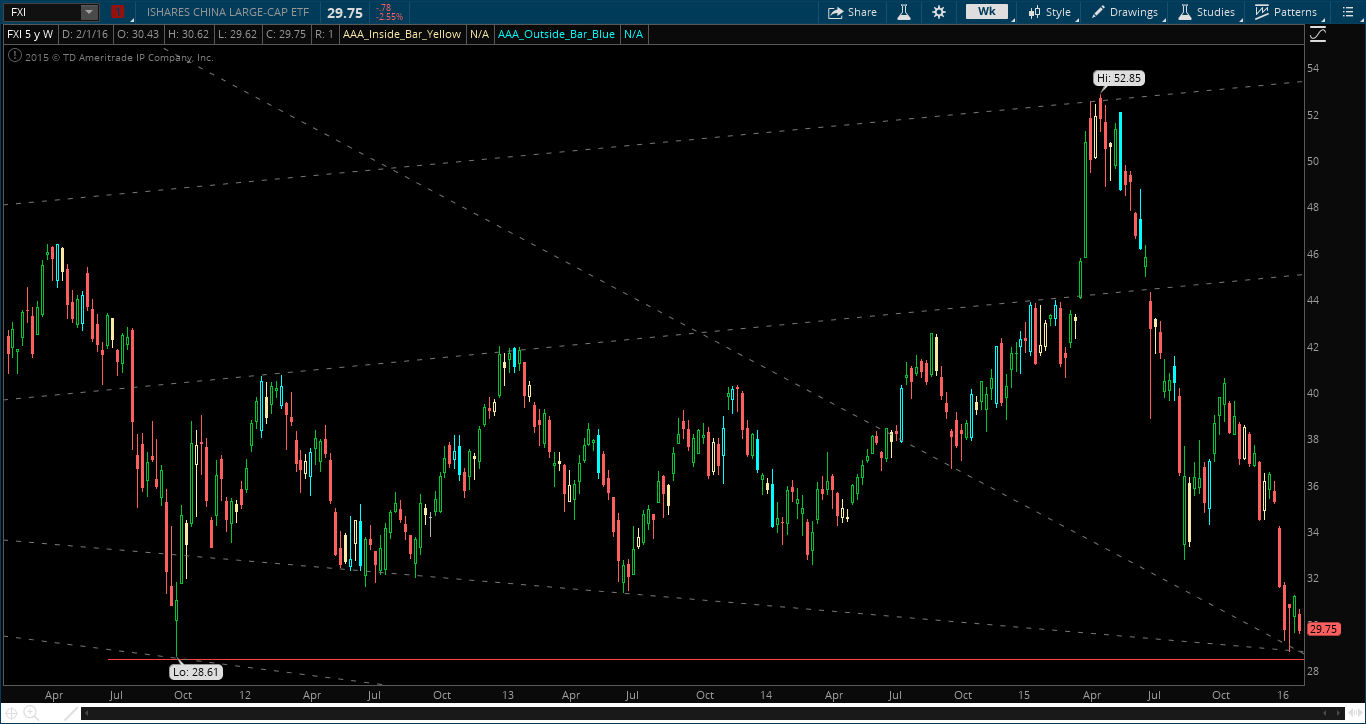
China Sucks.
Look at the FXI Chart. We have already taken out last weeks lows and potentially can take out the February lows. If FXI takes out 28.80 to the downside, you bet your ass the US markets will follow suit.
Sun Jan 31, 2016 9:06pm ESTComments Off on Eyes on The Financials
You know what charts look great when we close a week on the highs?
ALL OF THEM
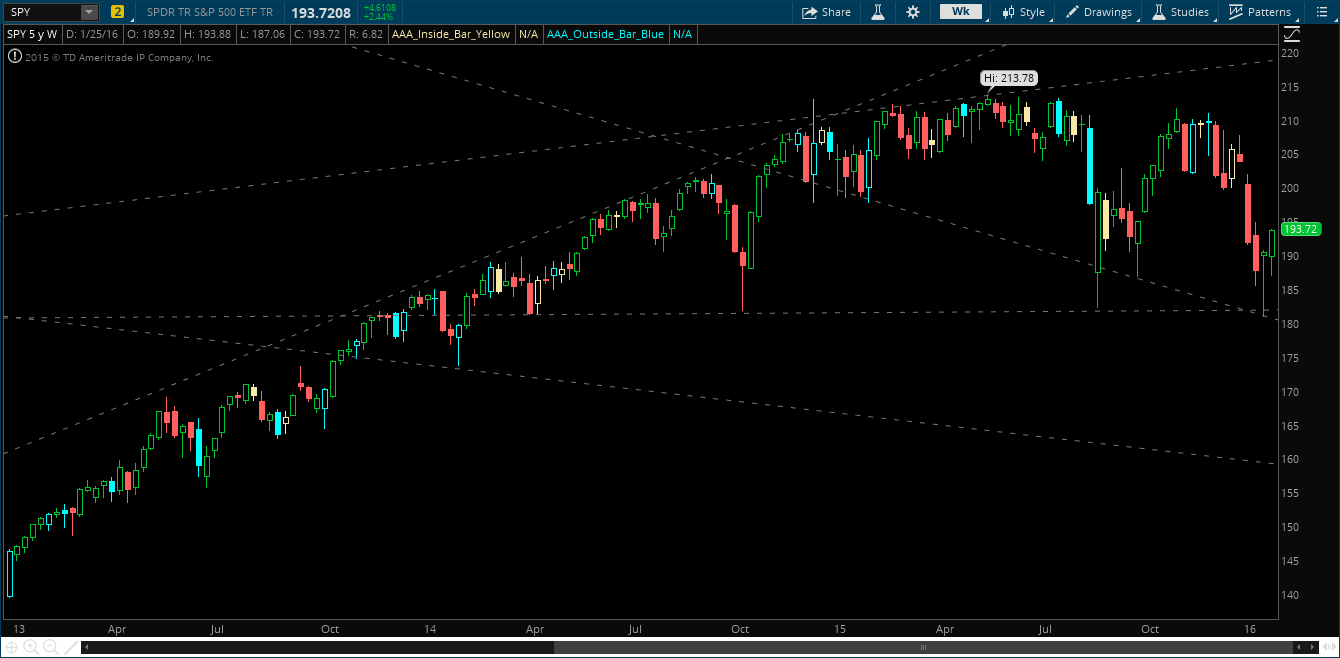
SPY Weekly Chart
My point here is that we need more information to really identify strength and weakness in this tape. Yeah, it looks like we’ll bounce higher, but how far?
For SPY we see that we have resistance (top of a broadening formation) at the outside day from January 13. Our next spot of resistance here is around 195-196 (posted last week).
As always, oil is going to play a major factor in the markets. If it stabilizes (and doesn’t rally) in February, we’ll want to see some noticeable leaders elsewhere if this market is to bounce higher. Here is where I am heading:
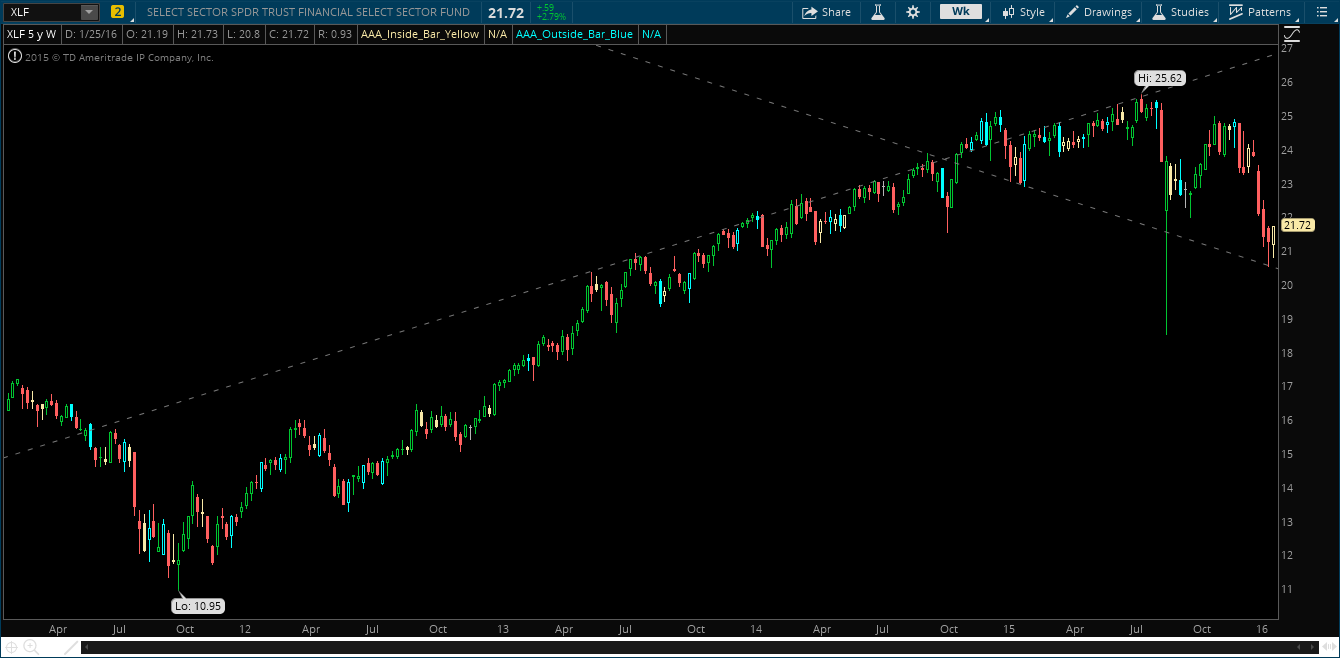
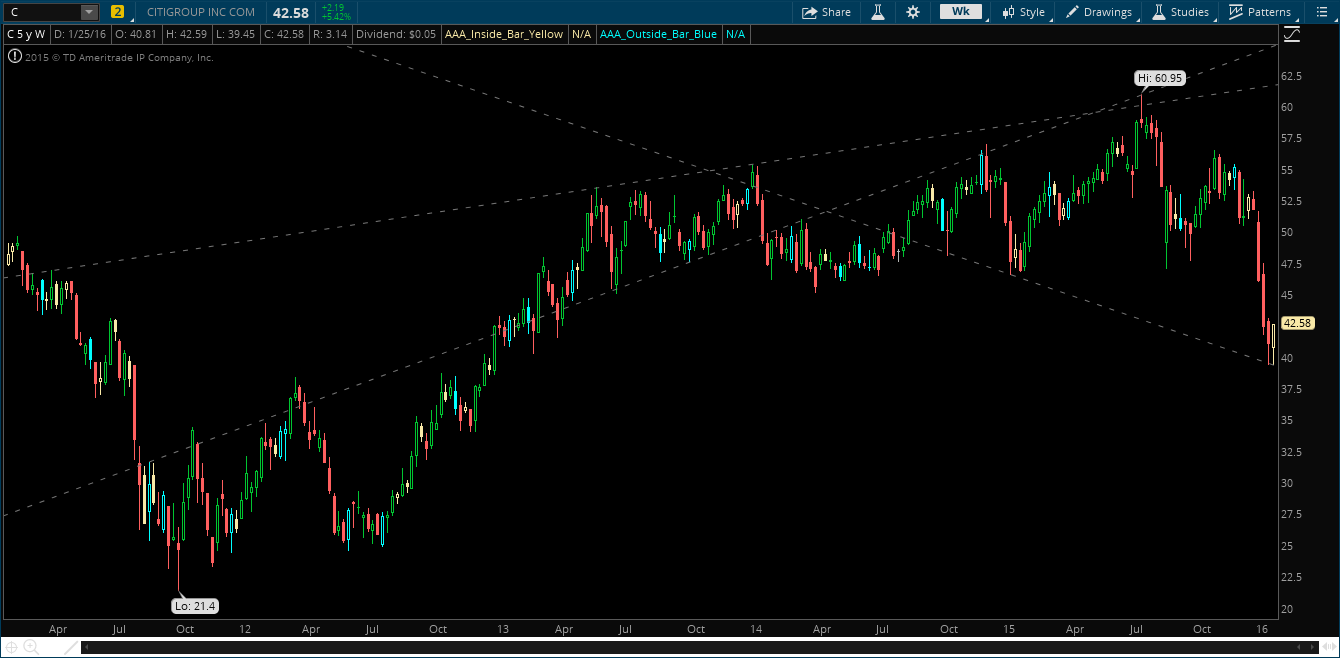
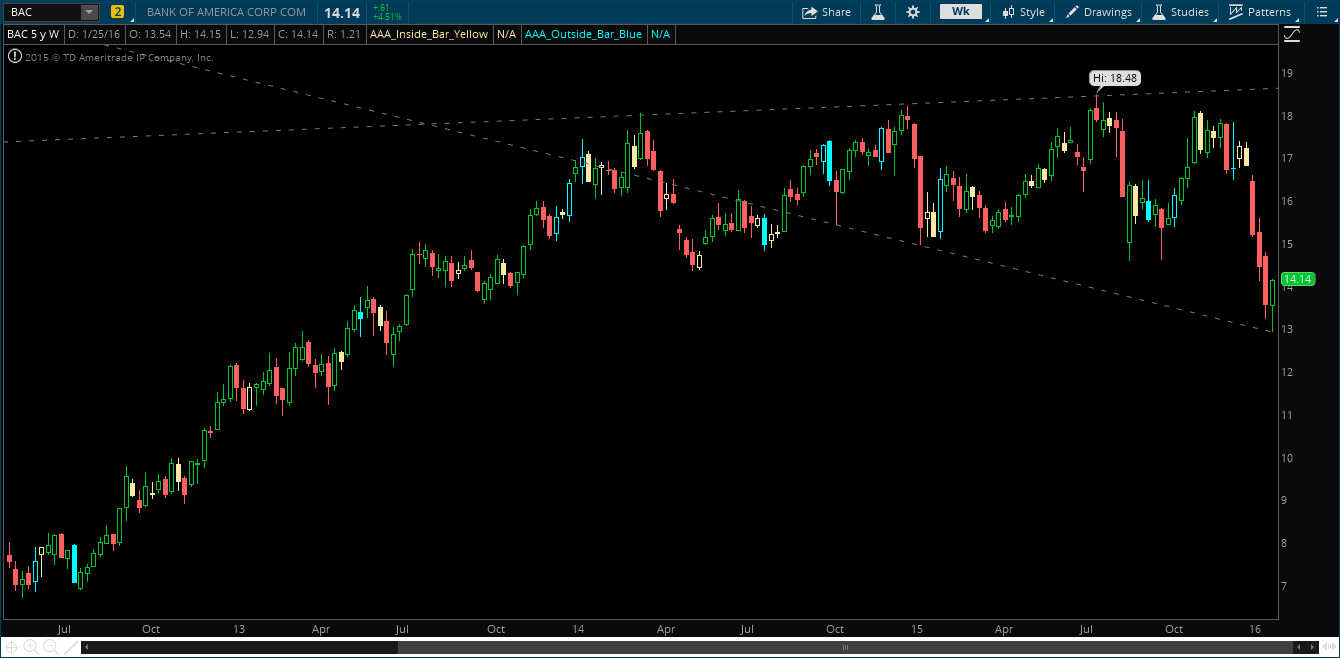
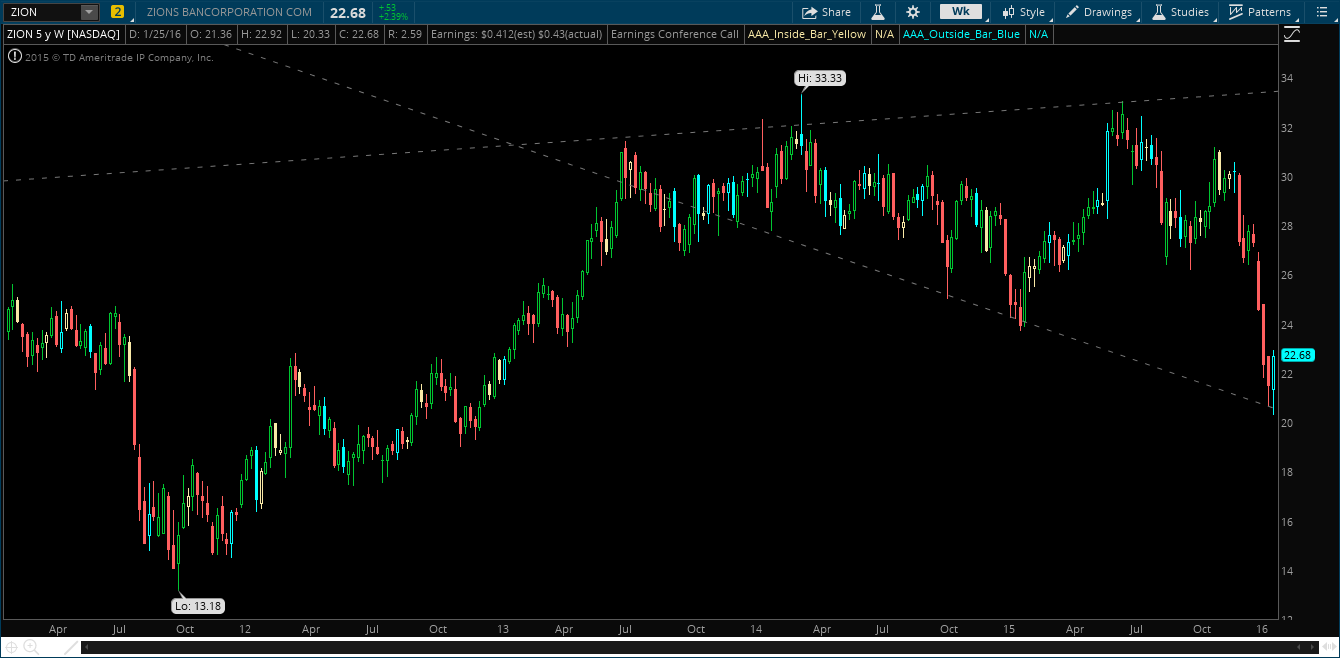
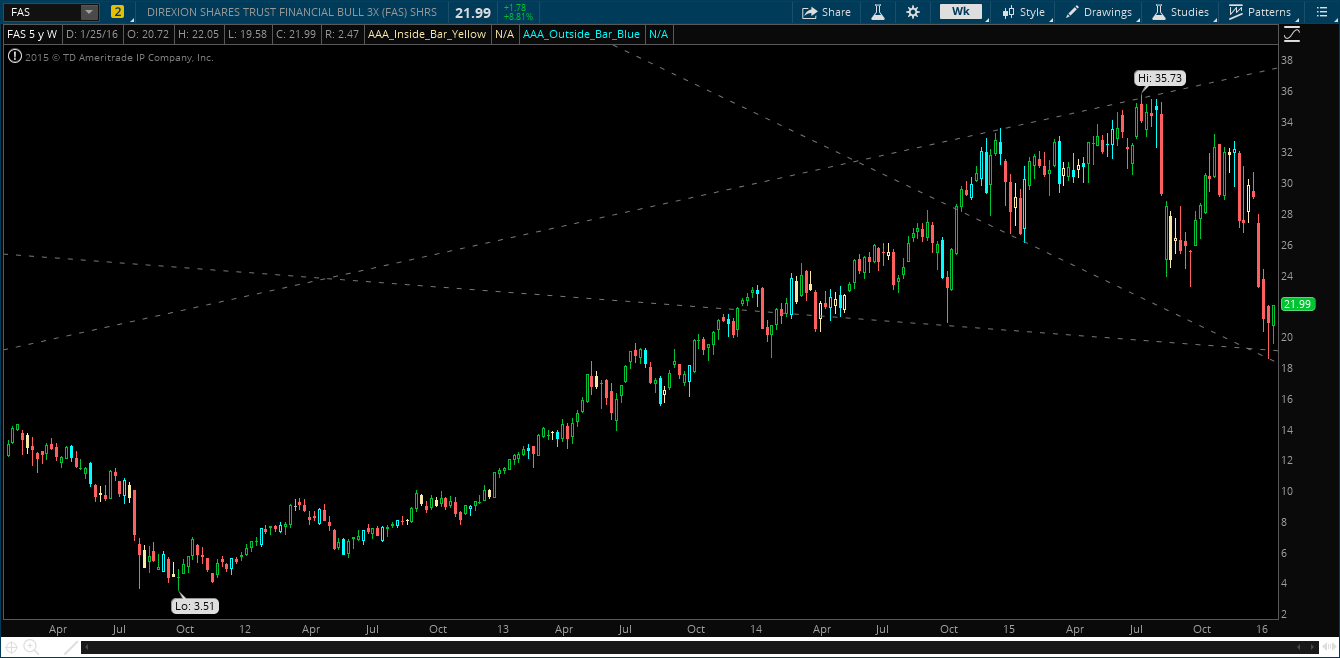
Into next week I will be watching mostly the financial sector (XLF). XLF Financials are inside week, and a break above 21.73 would trigger this signal. A move to 22.50 seems completely plausible. Citi has my main attention, but will also be watching GS, WFC and ZION a bit too.
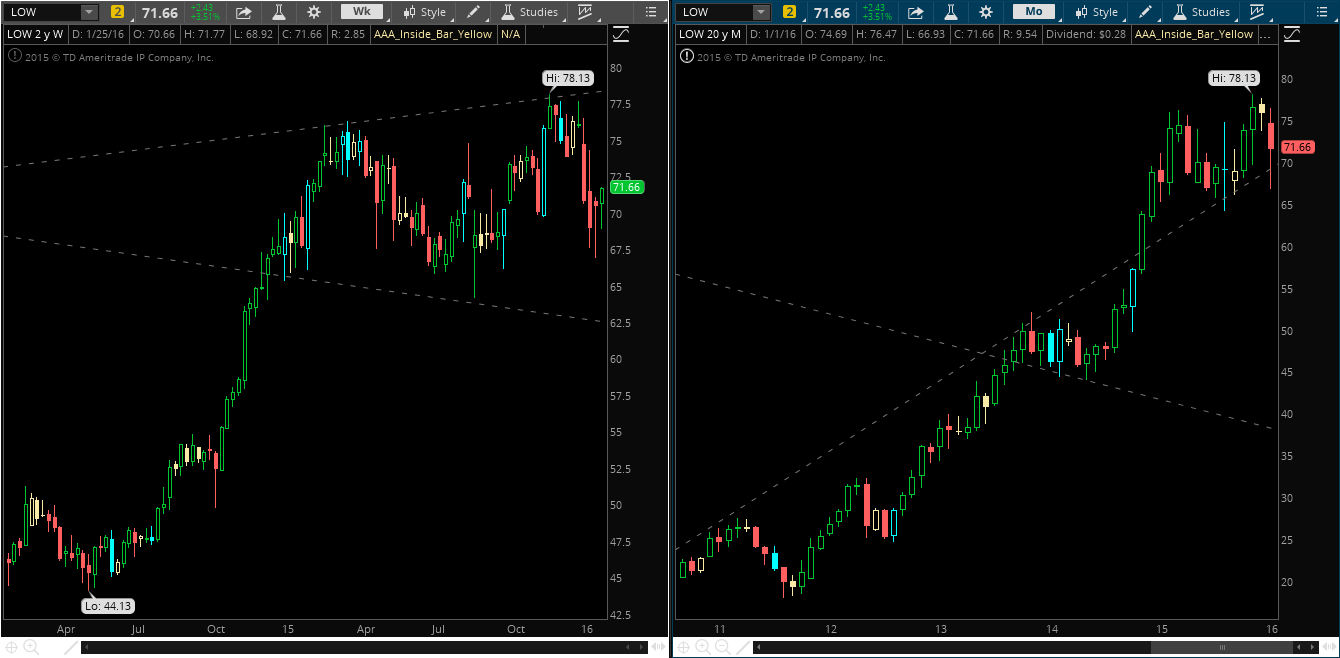
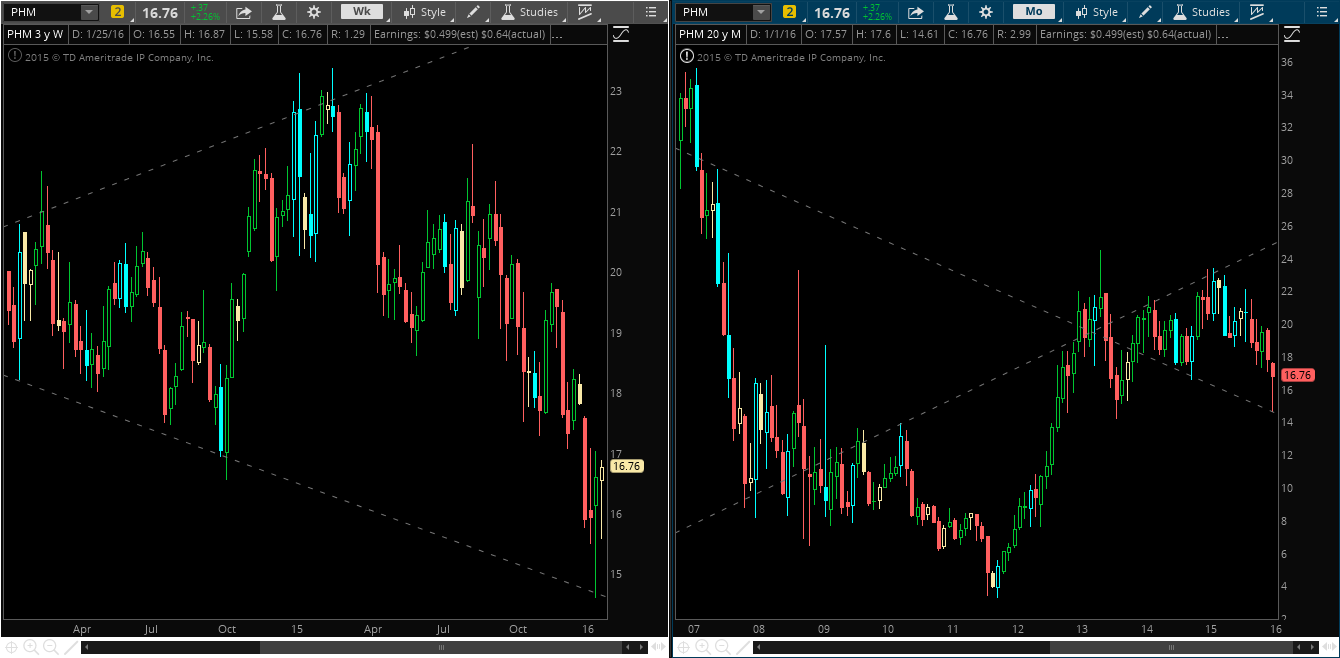
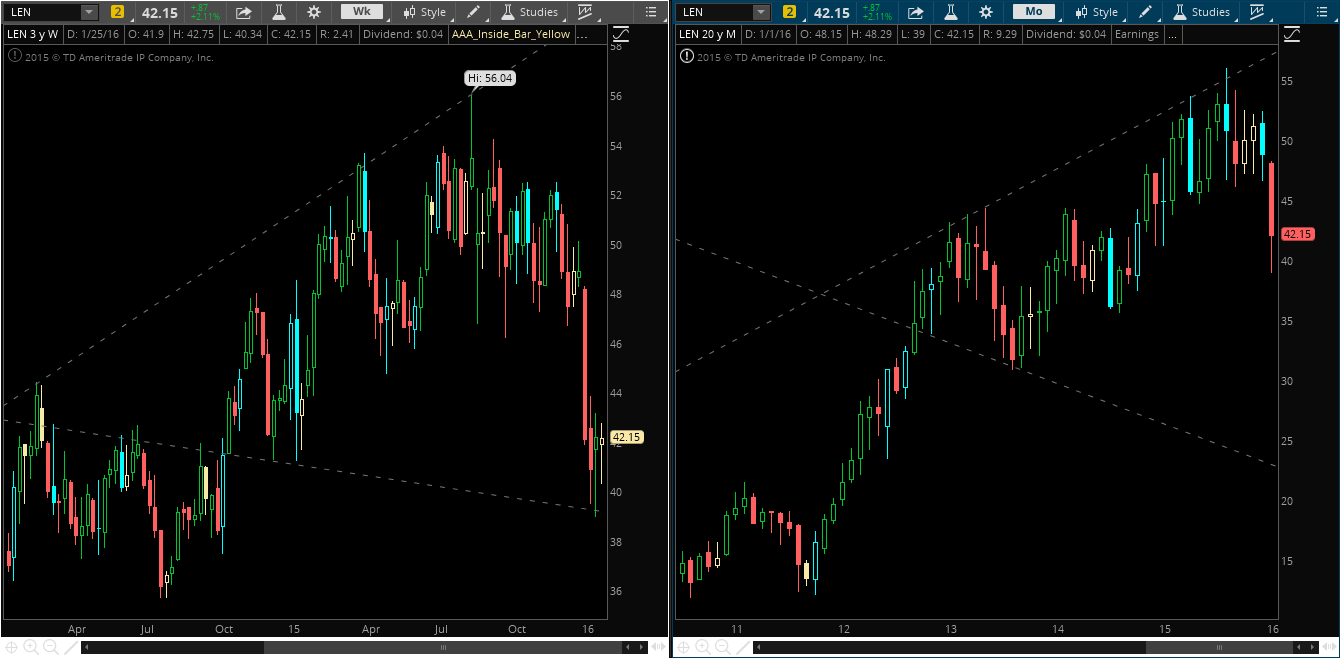
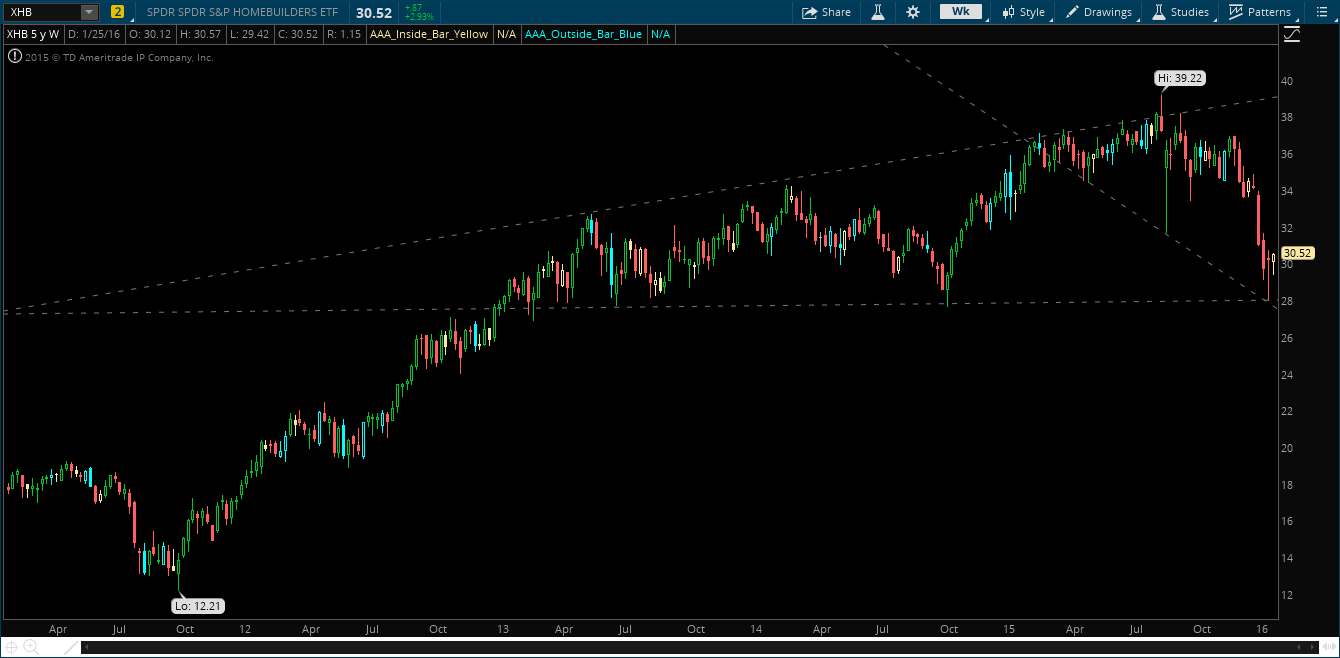
I also have a very small watch on the Homebuilders (XHB). XHB Homebuilders are also inside week and have been absolutely murdered the last two months. A move above 30.57 triggers this signal to the long side, with a first potential target of around 32. Not exactly a sector that I love, but Home Depot is insanely strong, and a few other charts look pretty solid.
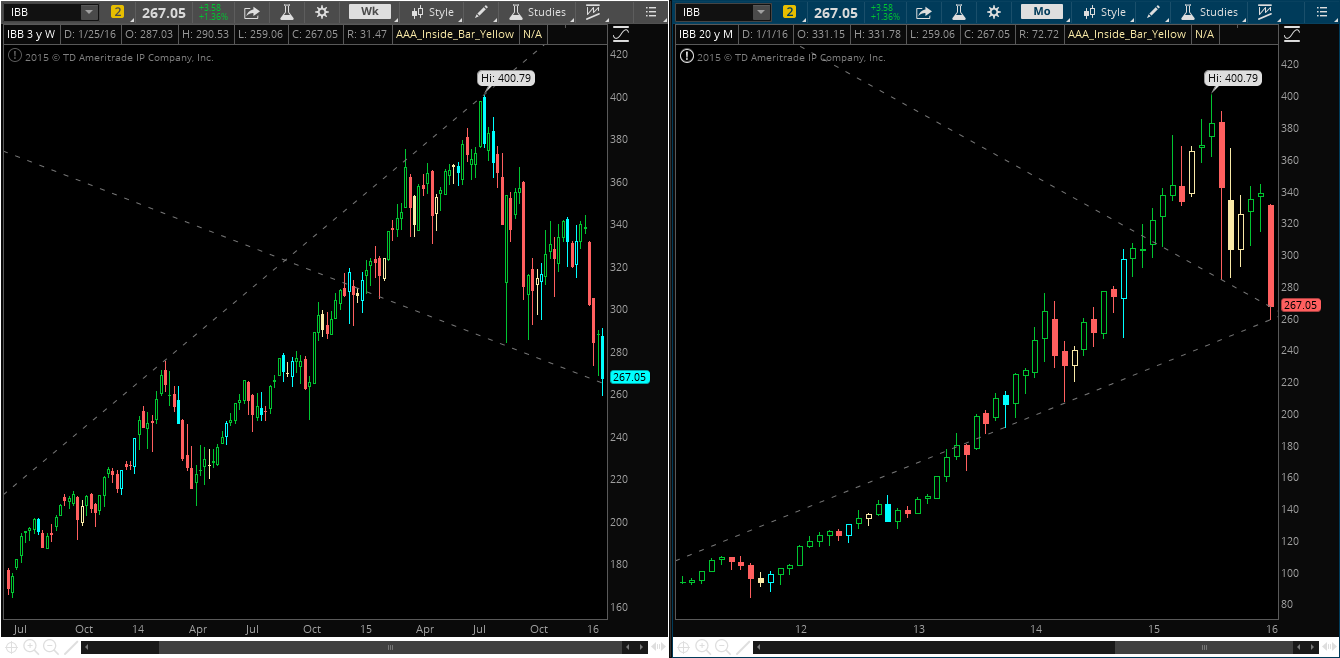
If the market decides to falter here, IBB has been our weak link. If we break below 260, the 230-240 range is almost a sure thing at this point – keep you’re eye on the Bio’s as we’ve seen some pretty steady selling here.
Below are a few annotated charts that I have on my radar:
What happens when the market drops 5% from the opening print of the week and then regains all losses to go green for the week? Hammer Time.
From a technical mechanics perspective we had a ton of stops set off from the August lows and the October 2014 lows. What this creates is an order flow vacuum, where sellers are done selling, longs are stopped out, and the majority of orders outstanding are either short covering or small natural buying. We wrote about this at noon on January 20th, three sessions ago – noting that testing longs is a very high risk/reward decision at that point.
That being said, we have hammer candles on all of the weekly charts. Hammer candles (as well as shooting star) fall into our “actionable signal” list here are Varel Research. What this tells us that is shorts/sellers are potentially on the wrong side of a trade, and buying pressure has led us back to highs. These signals are different than inside/outside bars, which we stress about a lot here, as we do not know exactly why hammers/shooting stars occur. Was it simply short covering? Or was it natural buying? That is what we are waiting to figure out in the coming week.
——————————————————————————————————————
That being said let’s take a look at the charts and see where this rally may take us.
In my opinion you only really need a few charts that will show us the potential move ahead of us. In periods of high volatility, traders need to hone their focus in a few stocks – as alpha is generated that much more quickly and your timing is very important.
So, if we look at SPY, USO, and UVXY we can see a few things line up.
For SPY we see that we have resistance (top of a broadening formation) at the outside day from 1/13. Our next spot of resistance here is around 195.
SPY Daily Chart
SPY Weekly Chart
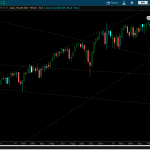
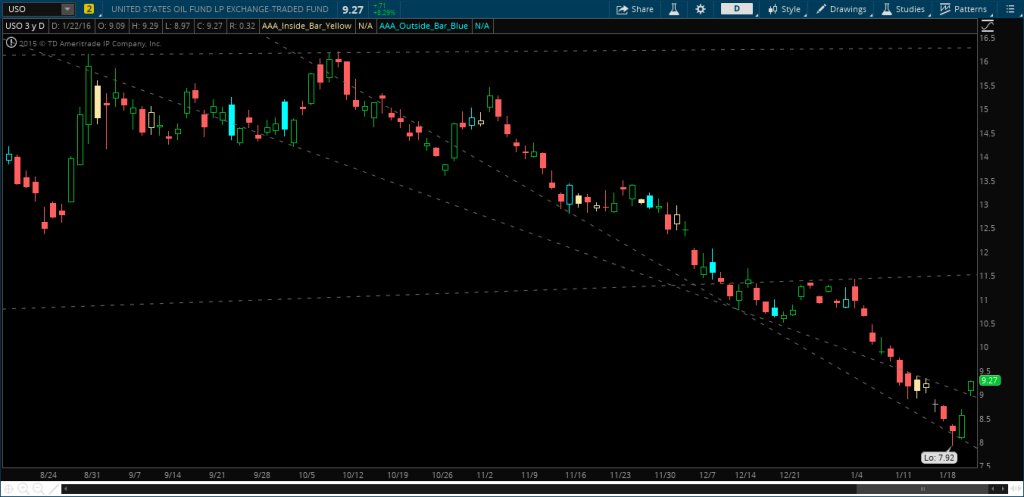
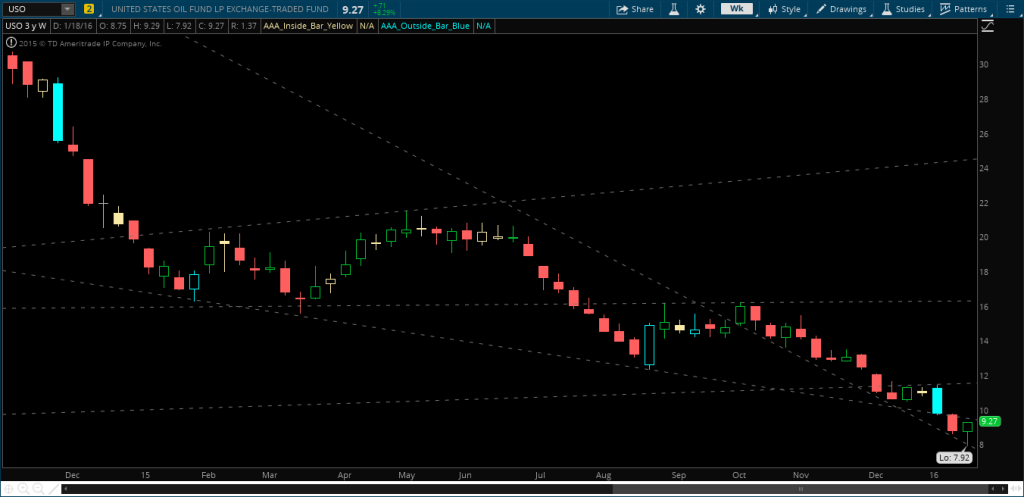
This measured move in the SPYs also lines up with a potentially large rally in the Crude Oil patch. As we can see in the charts, it is not out of the realm of possibility to see a move to 11.50 in USO. This would also line up with a move to 120 in SCO.
USO Daily ChartUSO Weekly Chart
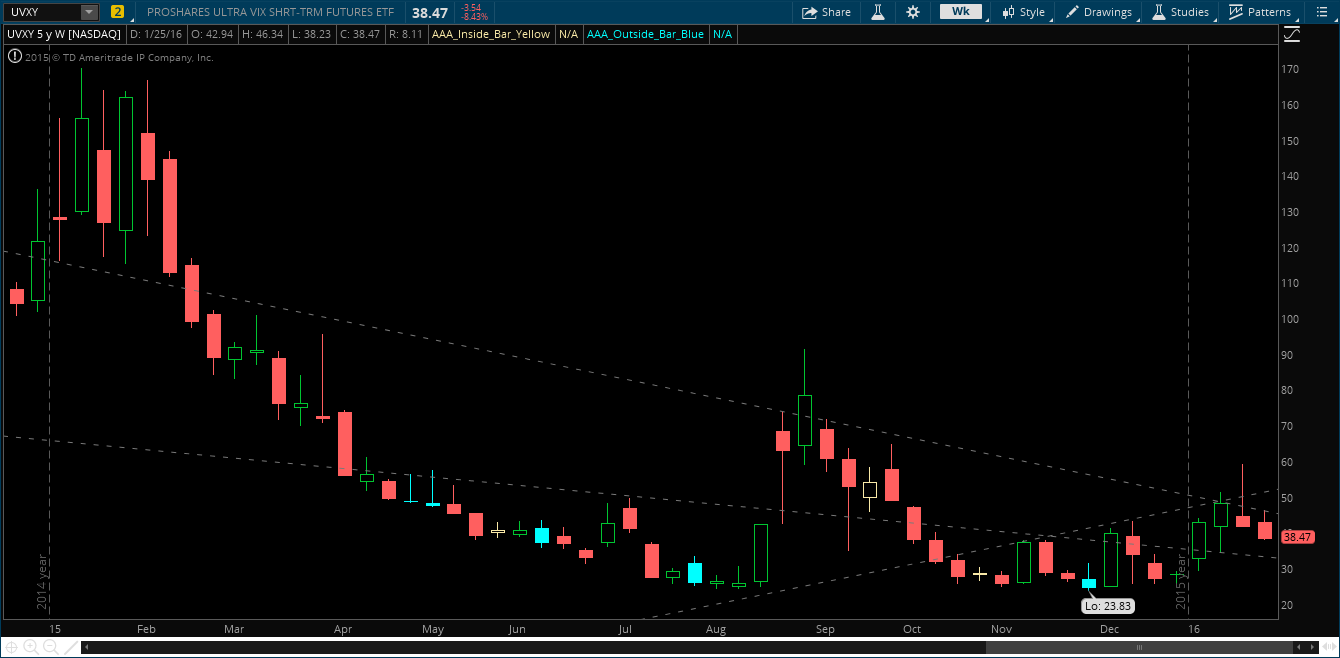
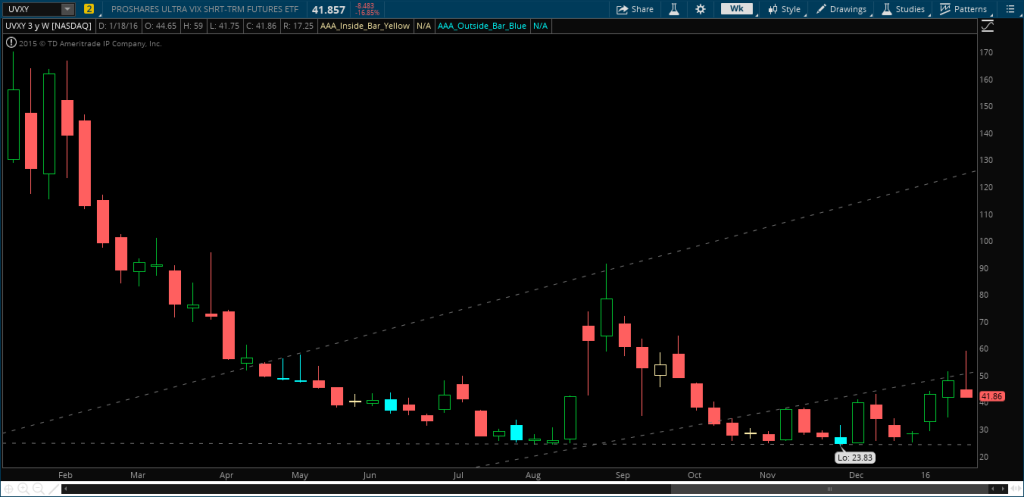
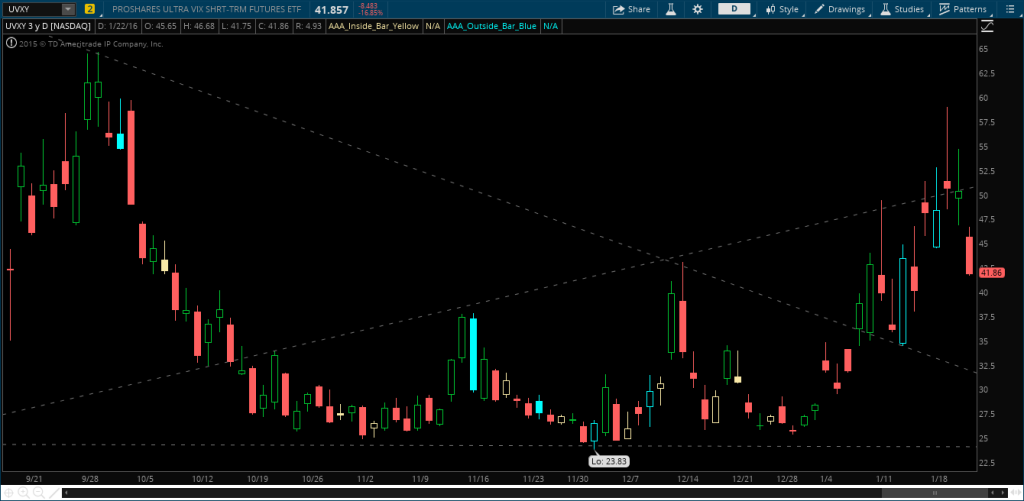
Lasty, the VIX products are absolutely doomed if this rally does go the way we think it will. If we start to rally and see the VIX products back into contago, UVXY will be printing in the low 30s next week.
UVXY Weekly ChartUVXY Daily Chart
Even if we look at other asset classes, the TLT bond ETF is weekly shooting star, and the GLD Gold ETF is reversal-setup (to the downside). Both of which signaling down-side moves and indicating strength in equities.
GLD Weekly Chart
TLT Weekly Chart
All that being said, who knows how long it will take for any of this to play out. This move to start the year was brutal, and we are not done going lower. Fortunately for the bulls it looks like we may make a move higher over the next few weeks. My approach for now is stick with my SCO short and generate alpha in the meantime trading SPY and UVXY. I think the move to 160 in the SPYs comes in March/April – so I’m holding out for the hay-maker until then.
With all of the gloom and doom running rampant, I’m hear to tell you that it is NOT that bad. Just a quick post, wanted to let ya’ll know that we haven’t flat-lined, we are still alive, and the opportunities are still out there.
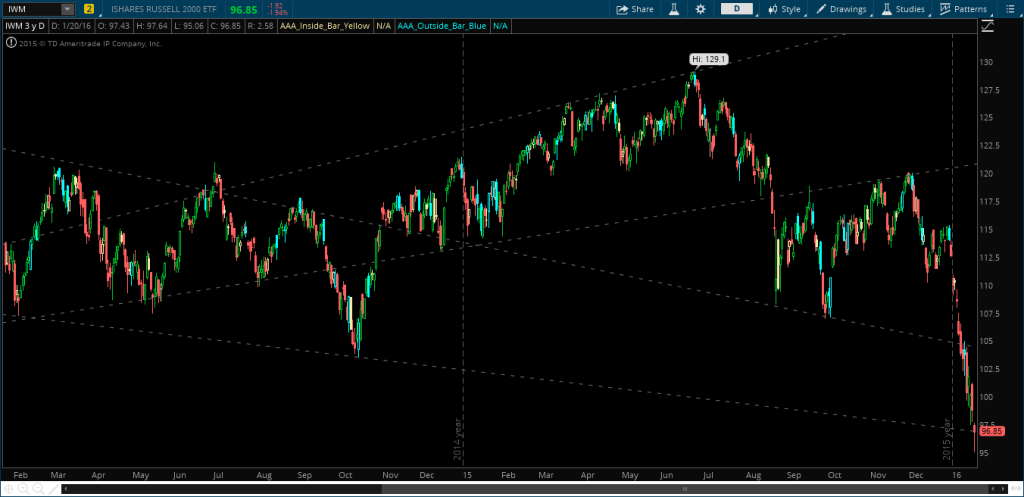
First, IWM is showing relative “strength” (god I hate saying that) — but, we are into broadening formation support again. What’s happening is an order vacuum of long term stops going off in the futures (taking out Oct ’14 lows) and now the market is left with short covering and maybe a few natural buyers. Selling is exhausting and profit-takers are near. Lots of short-thesis’ investors had the Oct 2014 lows as a target and are most definitely covering here.
IWM Daily Chart
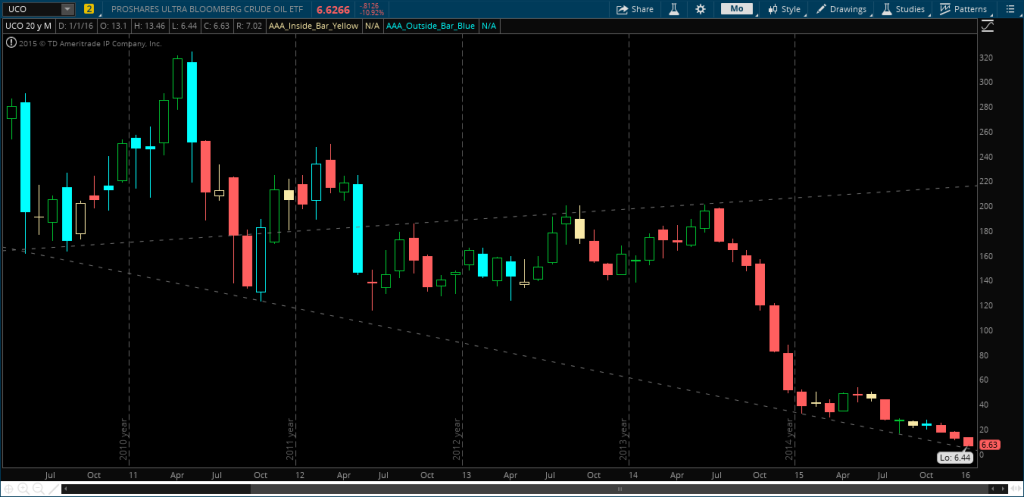
For this market to bounce, we have to have Crude Oil bounce — or even just not get absolutely KILLED, for a few days. Good news is the long term monthly chart is coming into support. The downside doesn’t seem that much further away – so oil stabilizing over the next week would be huge for the overall market.
UCO Monthly Chart
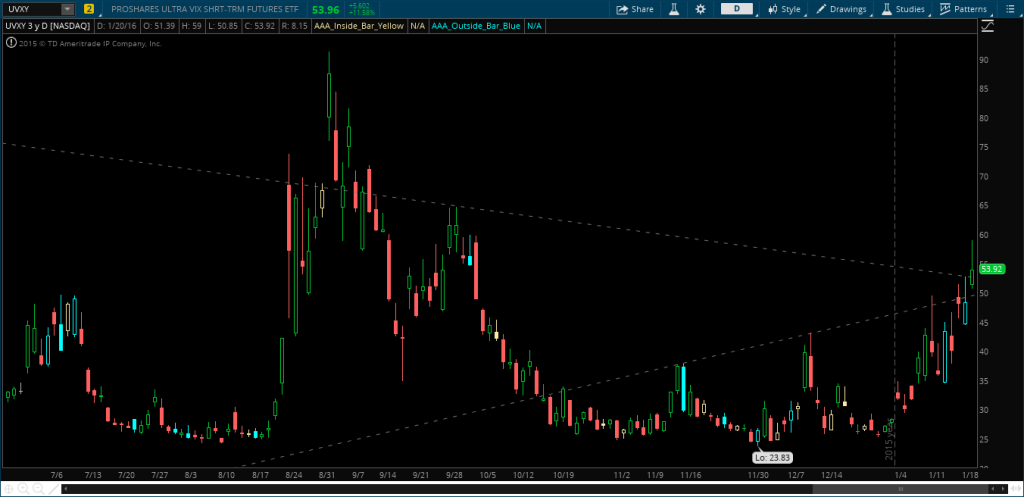
UVXY is setting up with a daily shooting star candle after this enormous run. With any stabilization of the market, this WILL get murdered. Stay on this one, do not miss the move down if the market rallies.
UVXY Daily Chart
For the riskier traders you can probably start testing longs here with small size. The risk to the downside is very small over the next few days if you keep your size light. If you are less risky, atleast let this market take out the prior days’ highs and stay above them, something the market has done once this entire year.
Hope this helps for the next few days, as the opportunities are everywhere these days.
Well, here we are Monday night and the streets are apparently filled with dead bodies (per social media of course). Oil is just getting annihilated without any regard whatsoever (what’s new). The Small Caps are taking the brunt of this beating, down 17% from the December 1 highs.
I have only one real thing to say now:
Get the F$%K over it.
It’s time to move on and stop debating whether or not this is a recession.
If you weren’t short into the New Year then tough shit. If you were long, then you obviously should have gotten out of the way. Hindsight is 20/20, as they say. And if you blindly bought the dip and got killed, then you just shouldn’t be trading.
But here’s the deal, so many traders want to piss and moan about “wahhhh I didn’t get short” or “wwaaaahhh why aren’t we bouncing, we are oversold.” For the love of god grow a pair and quit your complaining. The market does not owe you anything. Your fundamentals and macro thesis’ are crap in periods of high volatility like we have had. Yes, the market will normalize and slowly we will resume some sort of trend – be it long or short. But in the meantime, leave the volatility to the traders. Accept that fact and move on.
SO….
What does all this mean going forward?
After this huge move and (seemingly) China settling down, it appears the relief rally is highly probable. At the least, pressing shorts is not worth the risk/reward. When will it happen and how long will it last? Who knows. But, there are a few things you MUST be watching in this upcoming period of lower volatility.
FIRST AND FOREMOST:
If you are a trader and you are not trading the VIX products (UVXY/VXX) then you need to consult your local Rabbi and possibly get your brain scanned. These products are DESIGNED TO DECAY AND GO TO ZERO OVER TIME. Yes, for all you quant majors I understand that there are periods in which this is not true (backwardation). However, these products are VERY tradeable and must be watched. If we have a relief rally, UVXY will get absolutely DESTROYED. Sell the calls, buy the puts, and short the stock – because this stands NO chance when we have the right circumstances at hand.
SECOND
All of the selling we have seen the last two weeks has been futures driven – and what that means for us technical traders is that almost all charts are going to look the same. SO, in the short term, stick to trading the index’s until we can identify natural buying (relative strength). Yes, FANG stocks have been the go to, but let’s wait and see if they continue to be that trend.
LASTLY
Earnings is upon us, each morning you should be identifying these news-related gaps and trading them accordingly. Oftentimes we see gap-and-go’s or gap-and-reverse’s, these are VERY tradeable as well.
All in all, keep risk off the table this week and be patient. There are NO indications either direction on where we are headed. Just relax.
Overall, I will be watching the main indices (SPY, IWM, and DIA) to start off. Note (below) that IWM is daily hammer into support, our first hint that the relief rally is coming. ALSO, you MUST watch oil this week.
I am keeping a very close eye on SCO – the 2x leveraged inverse oil ETF. These options are juiced (indicating a 20pt move into February) and I will be looking to sell calls here. These ETFs get destroyed during re-balancing and can generate significant alpha.
Thu Jan 14, 2016 11:04am ESTComments Off on So Goes Oil, Goes the Market
Markets have been ever-so-gloriously getting KILLED and it has been epic.
Now we wait.
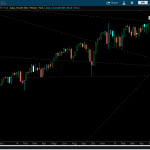
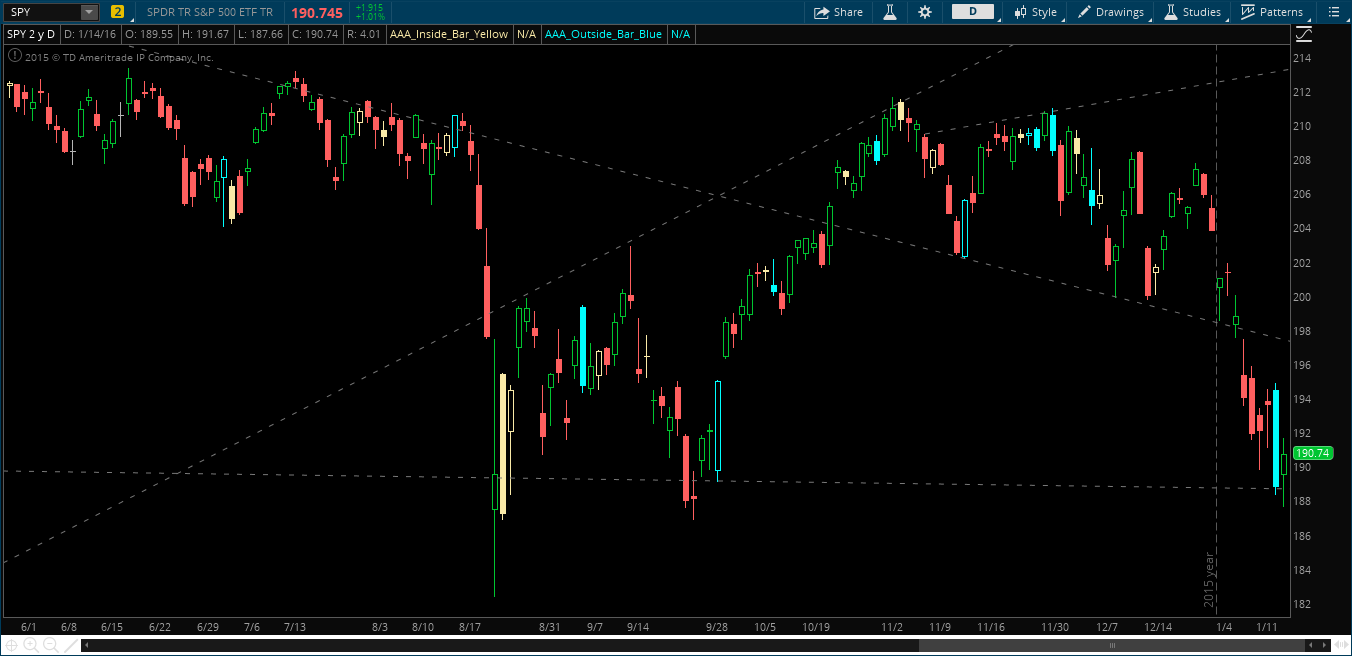
Is 188 in the SPYs the line in the sand and we bounce from here? The jury is still out on that. Time frame continuity says we are red on all time frames (except the daily chart from today). IF we hold today’s lows, it would seem like a bounce to 198-200 is in the cards for next week. We did test a small long position this morning with the SPY 190 C for next week, a bounce seems overdue here.
SPY Daily Chart
It’s almost clear that we are waiting on the commodities to stabilize to see if it is liquidation of all asset classes going forward.
Take a look at Crude – inside day into support. Inside days represent equilibrium, a pause in selling in this case. Is the trend going to continue and we just destroy the oil patch? Or are we going to get some buyers into this level and a possible reversal? I’d watch this going forward, as it may be the key to this market bounce.