You know what charts look great when we close a week on the highs?
ALL OF THEM

My point here is that we need more information to really identify strength and weakness in this tape. Yeah, it looks like we’ll bounce higher, but how far?
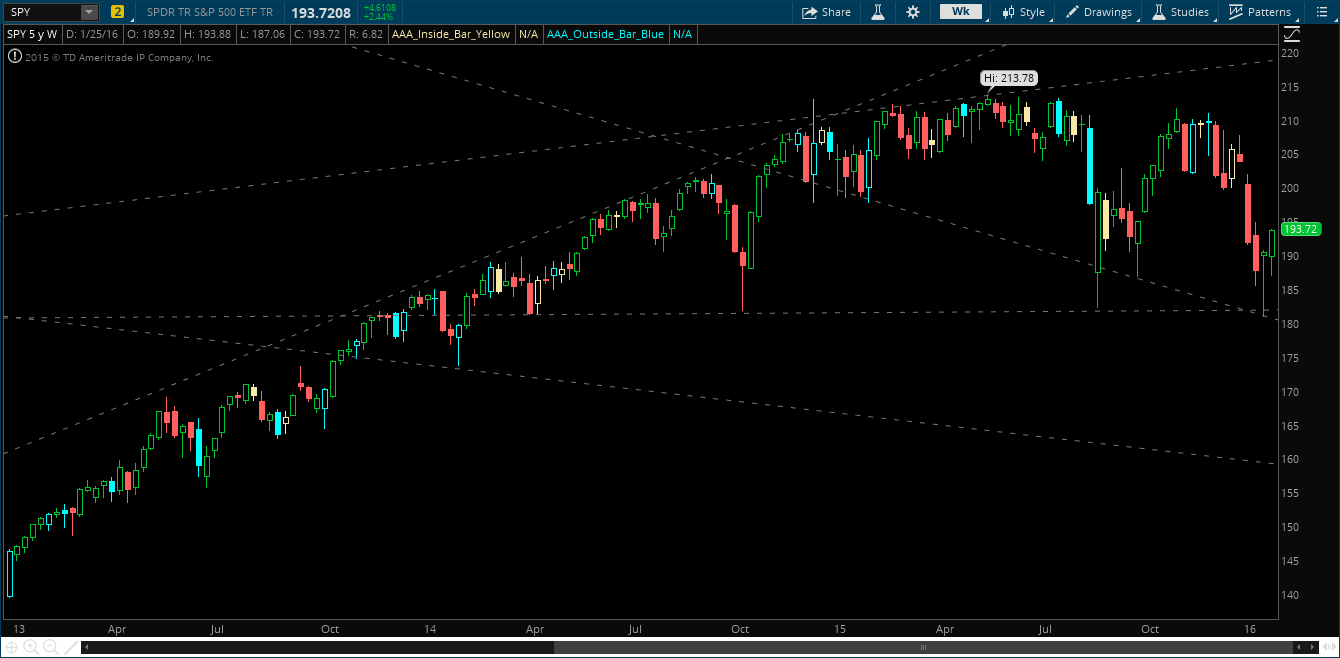
For SPY we see that we have resistance (top of a broadening formation) at the outside day from January 13. Our next spot of resistance here is around 195-196 (posted last week).
As always, oil is going to play a major factor in the markets. If it stabilizes (and doesn’t rally) in February, we’ll want to see some noticeable leaders elsewhere if this market is to bounce higher. Here is where I am heading:
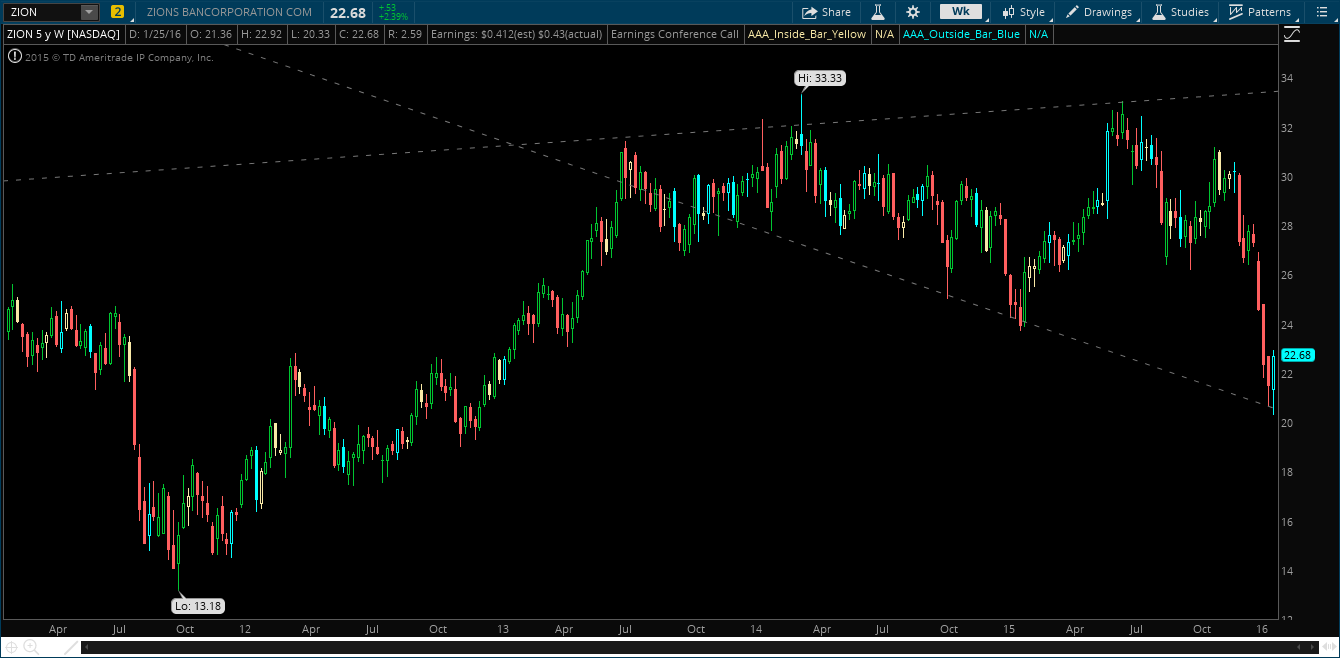
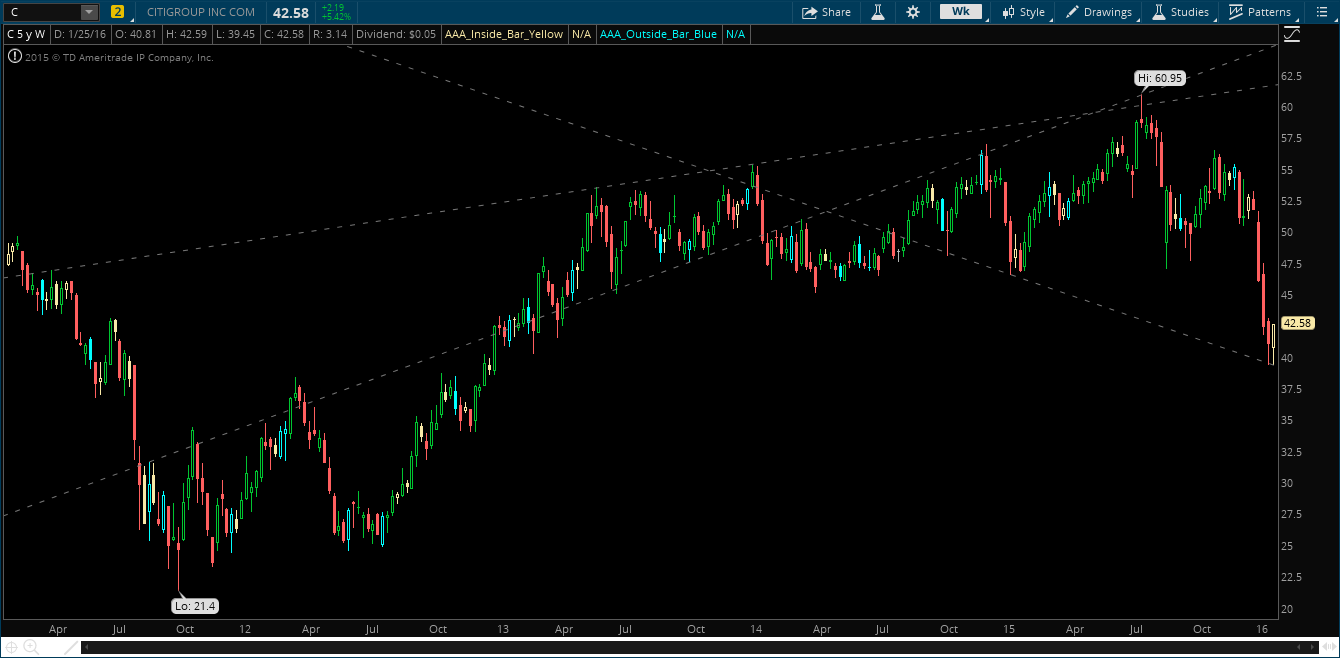
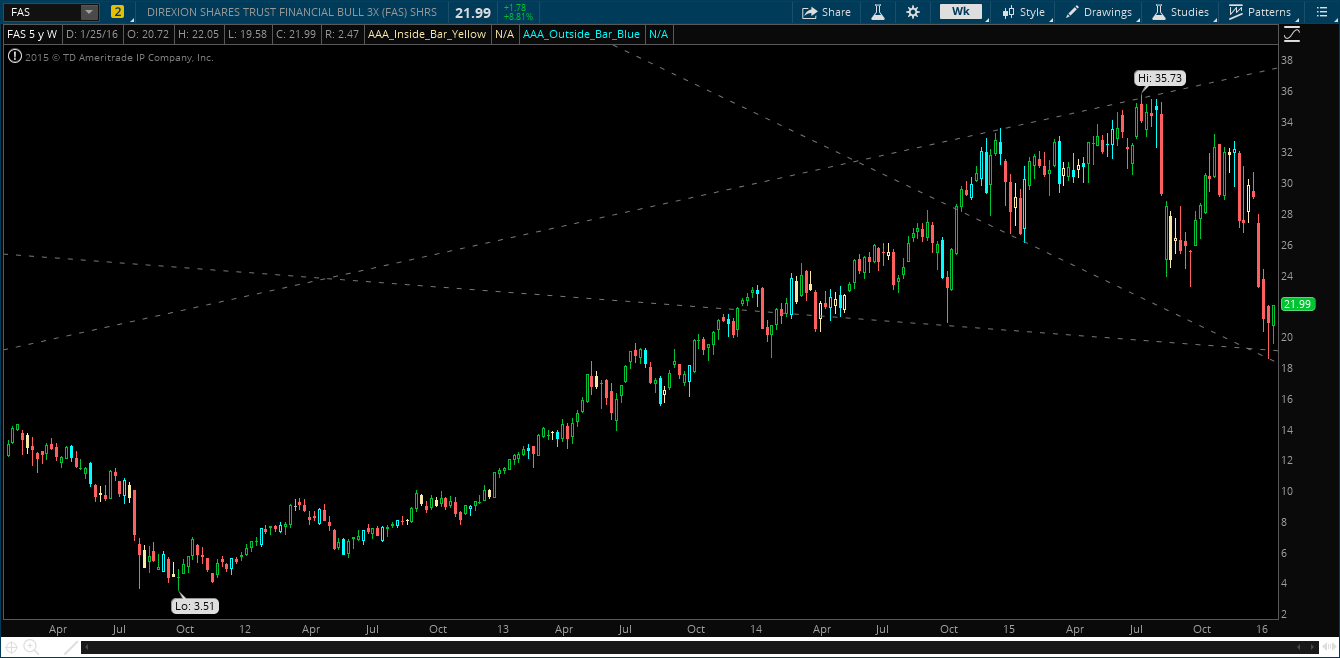
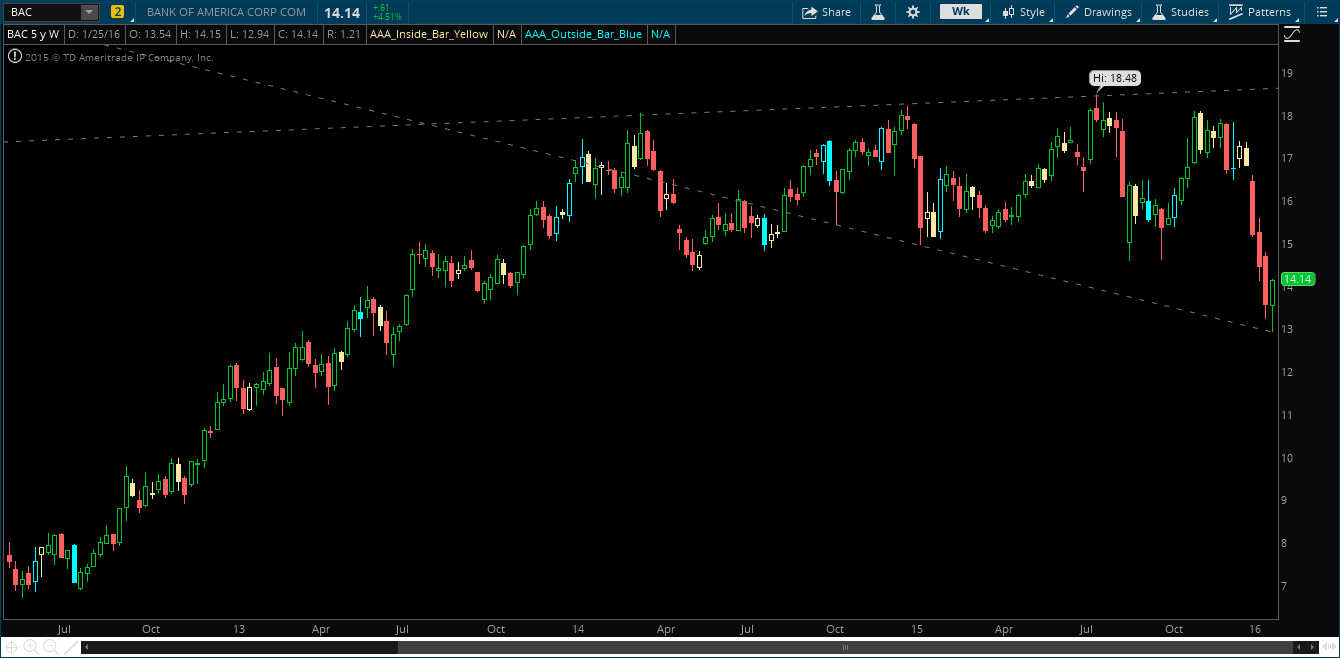
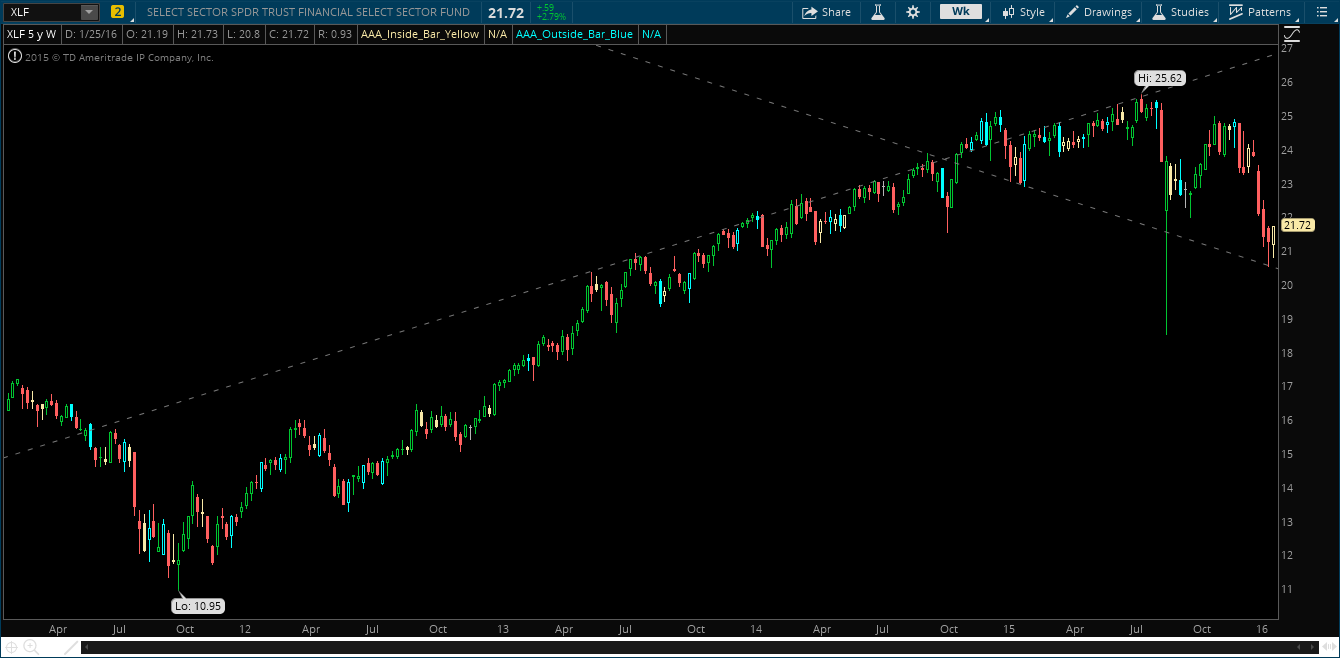
Into next week I will be watching mostly the financial sector (XLF). XLF Financials are inside week, and a break above 21.73 would trigger this signal. A move to 22.50 seems completely plausible. Citi has my main attention, but will also be watching GS, WFC and ZION a bit too.
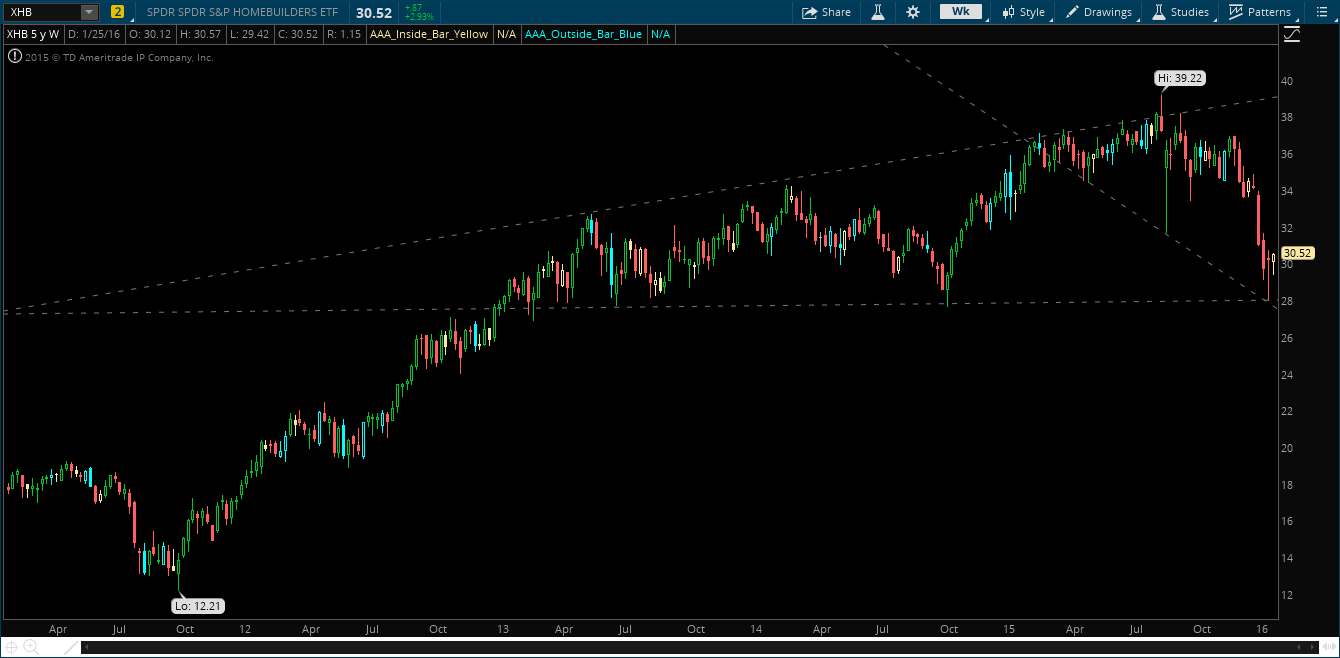
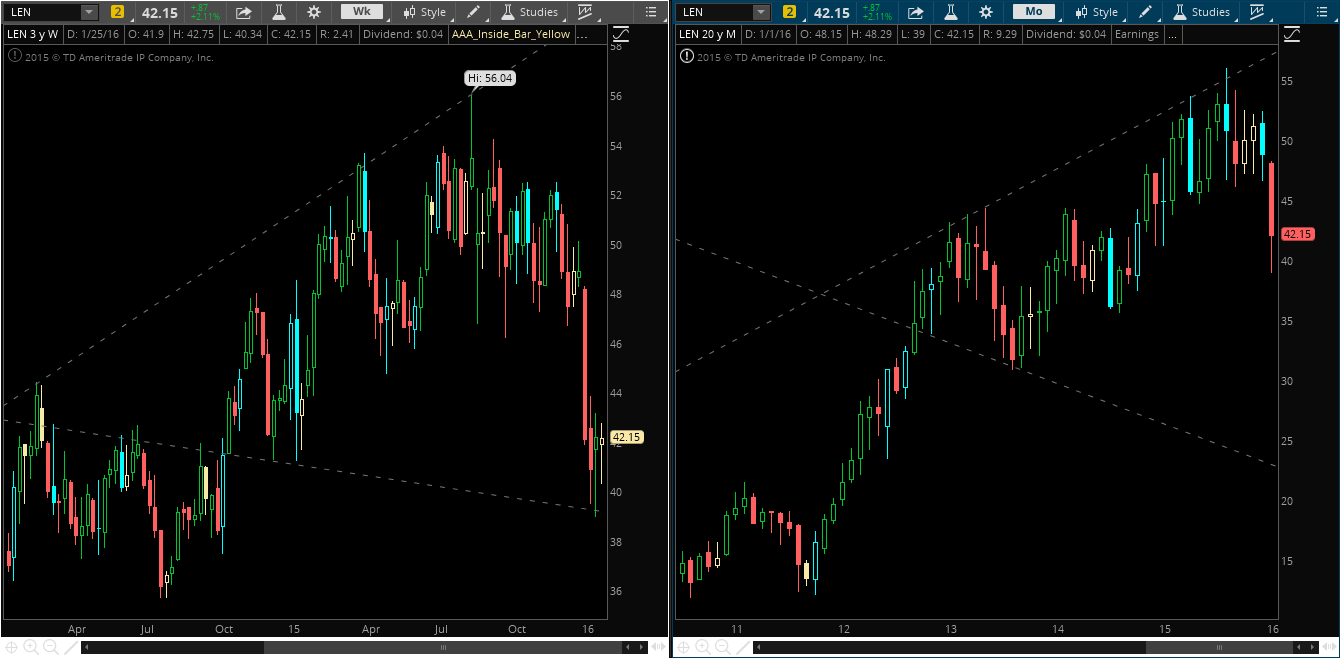
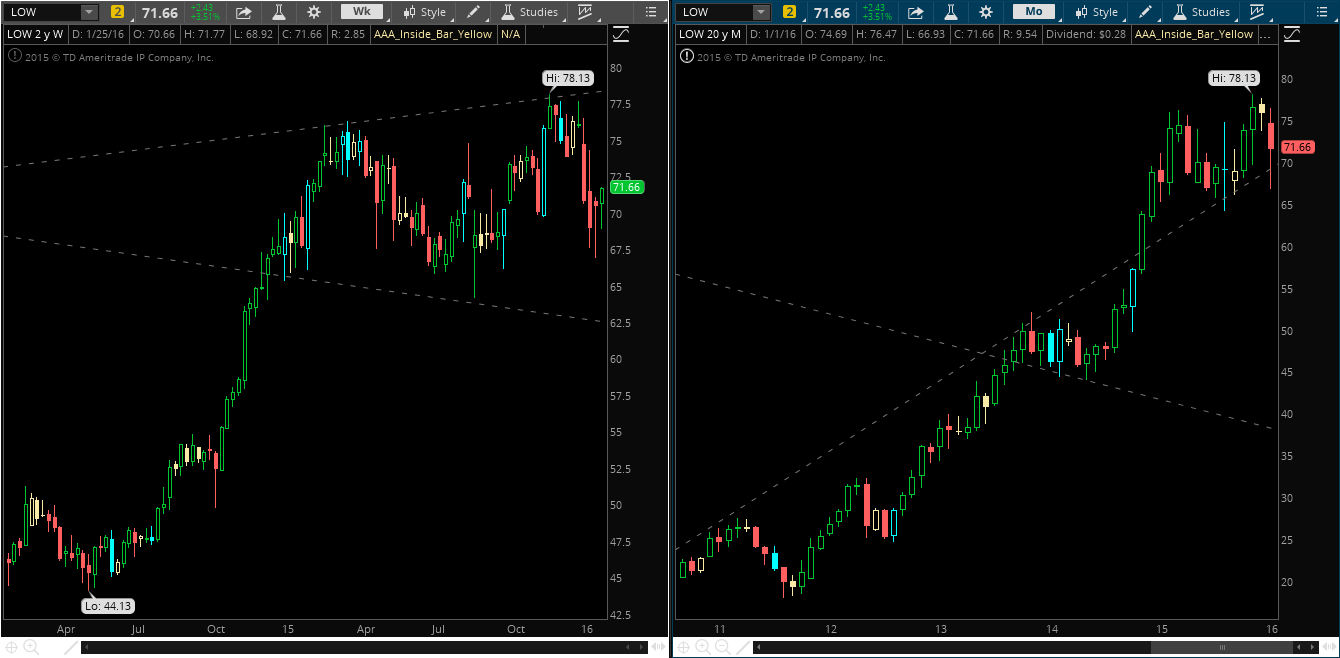
I also have a very small watch on the Homebuilders (XHB). XHB Homebuilders are also inside week and have been absolutely murdered the last two months. A move above 30.57 triggers this signal to the long side, with a first potential target of around 32. Not exactly a sector that I love, but Home Depot is insanely strong, and a few other charts look pretty solid.
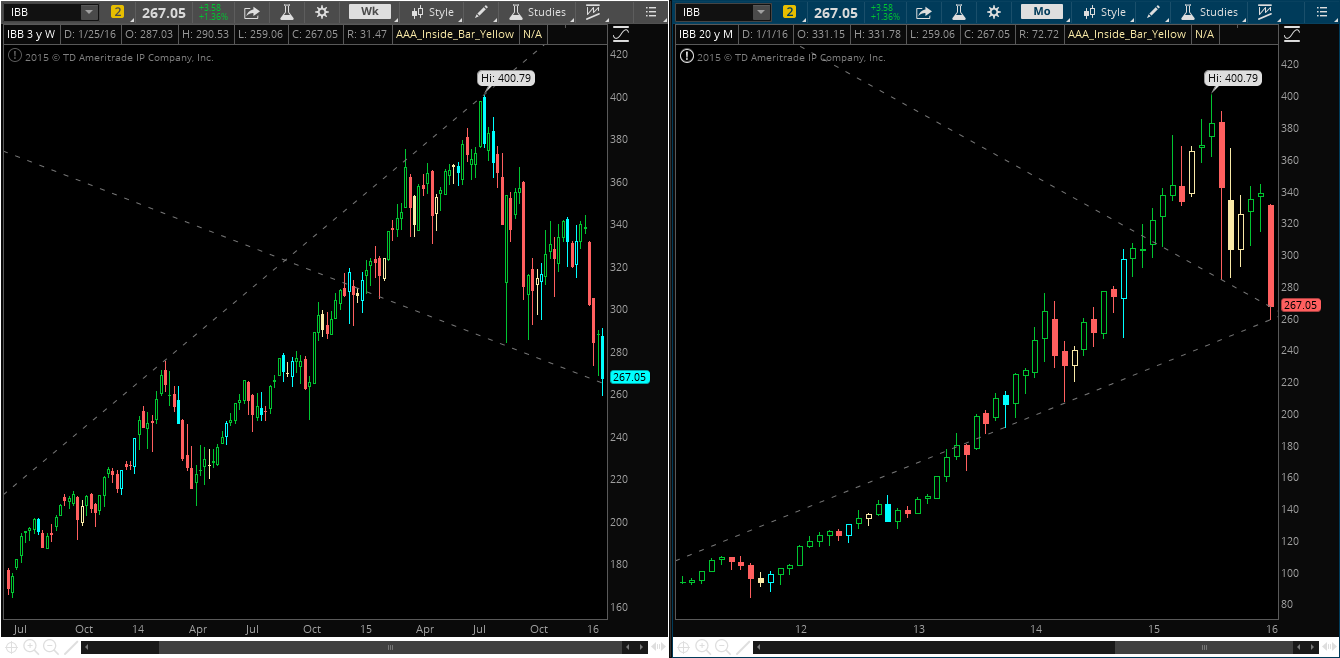
If the market decides to falter here, IBB has been our weak link. If we break below 260, the 230-240 range is almost a sure thing at this point – keep you’re eye on the Bio’s as we’ve seen some pretty steady selling here.
Below are a few annotated charts that I have on my radar: