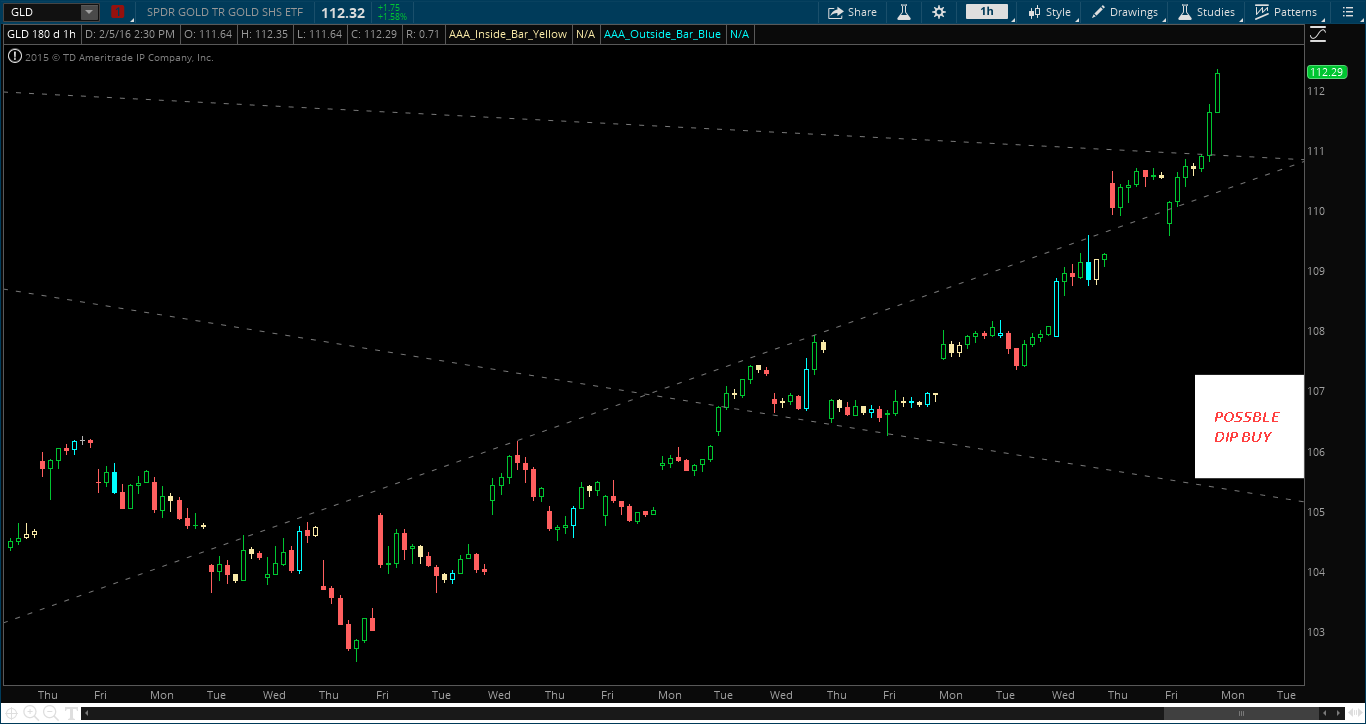
This run in Gold in 2016 has pretty pretty epic, and I am rather pissed I haven’t traded this whatsoever. That being said, let’s take a look at the charts and analyze some price action and see where we are potentially headed.
On the Daily chart you can see we are getting pretty extended, especially after Friday’s bullish-engulfing day. As we steam roll higher we have resistance at 113-114; a good spot to take some profit, or sell some calls, if you’ve been long this ETF all year.
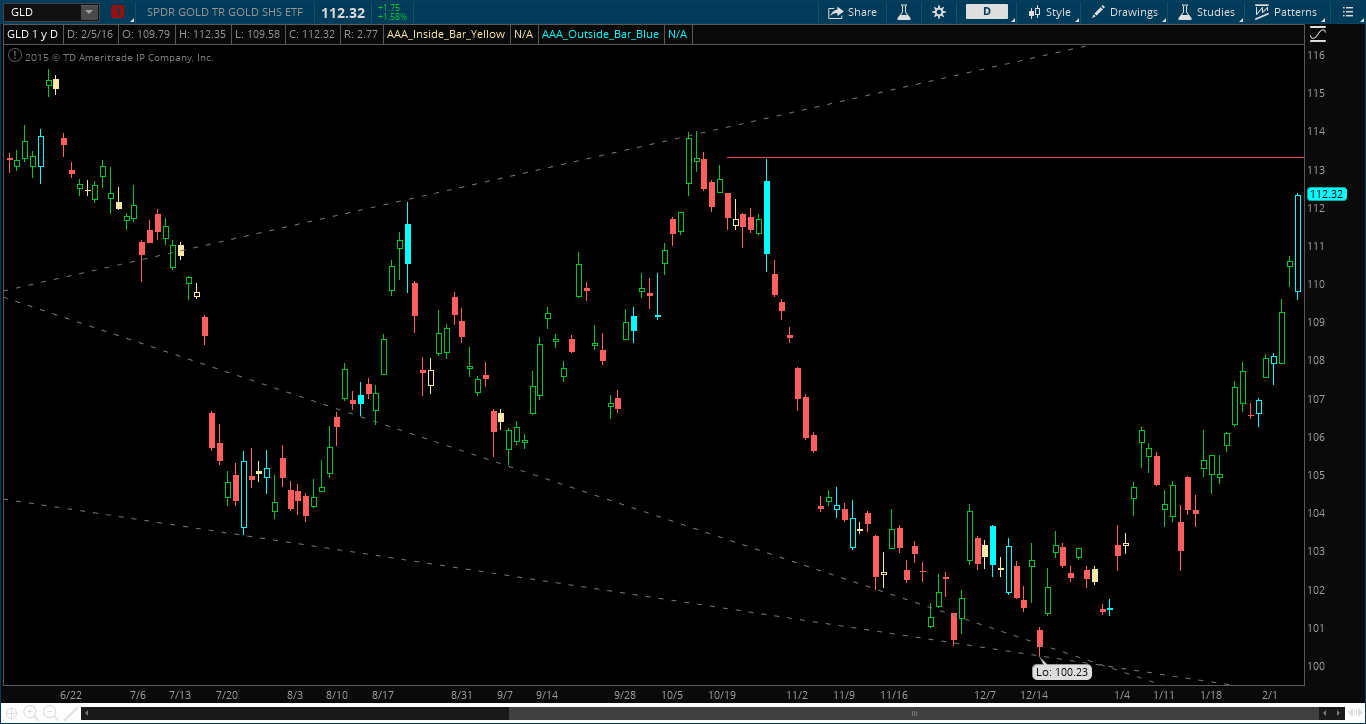
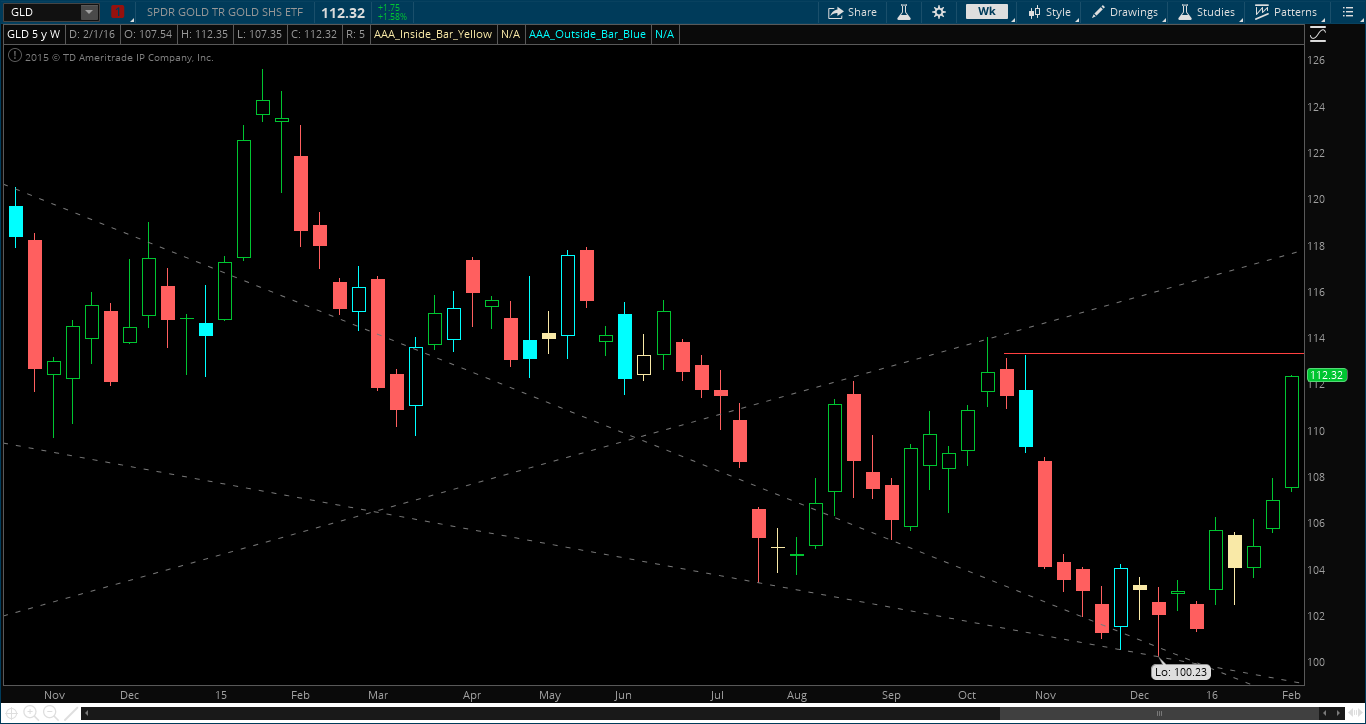
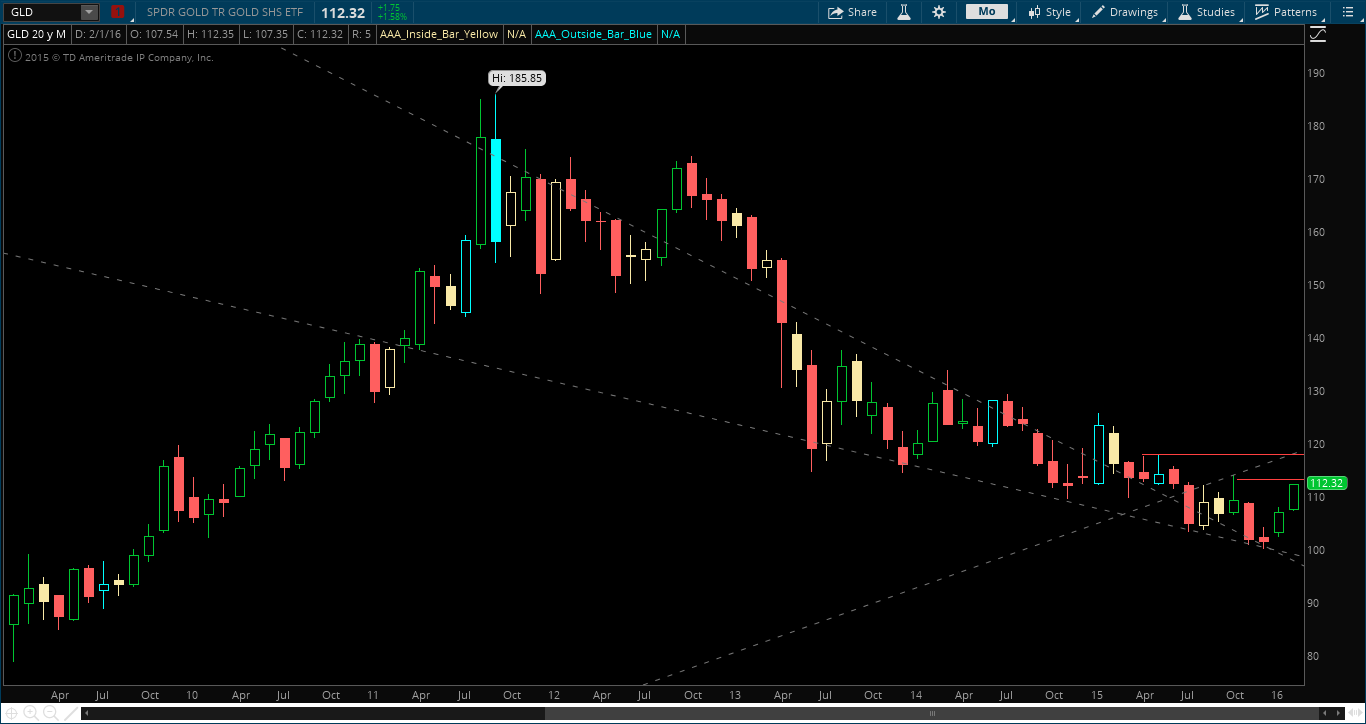
On the weekly/monthly charts you can see that the 115-118 level of resistance might cause some problems, or at least a small stall in price action.
So this all being said, where does that put us if we have totally missed the boat? What’s the plan on GLD going forward?
Seeing as I missed it, I’ll probably be selling near-term options if we get much more extended than this. The February 115 Calls closed out at .75 cents on Friday and will be trading well over $1.00 if we get to ~113.50 resistance early next week. Obviously we won’t be going in blind, as we’ll look for a short-term sell signal into resistance.
Long term, the weekly and monthly GLD charts look pretty great. As we stated earlier the 115-118 levels of resistance may cause some choppy action, but if your holding period is longer than a month or two I believe we see 130 this year, so long as we hold 100-105.
If you are a buyer of the GLD ETF you must wait at this point, as the risk/reward in not in your favor right now. I think we get a better buying opportunity in the 105-107 range.