With all of the gloom and doom running rampant, I’m hear to tell you that it is NOT that bad. Just a quick post, wanted to let ya’ll know that we haven’t flat-lined, we are still alive, and the opportunities are still out there.
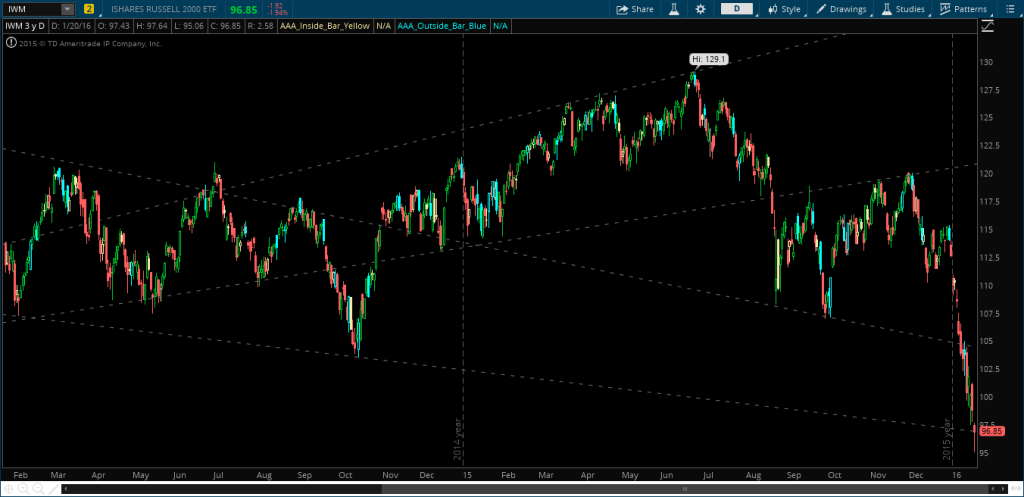
First, IWM is showing relative “strength” (god I hate saying that) — but, we are into broadening formation support again. What’s happening is an order vacuum of long term stops going off in the futures (taking out Oct ’14 lows) and now the market is left with short covering and maybe a few natural buyers. Selling is exhausting and profit-takers are near. Lots of short-thesis’ investors had the Oct 2014 lows as a target and are most definitely covering here.
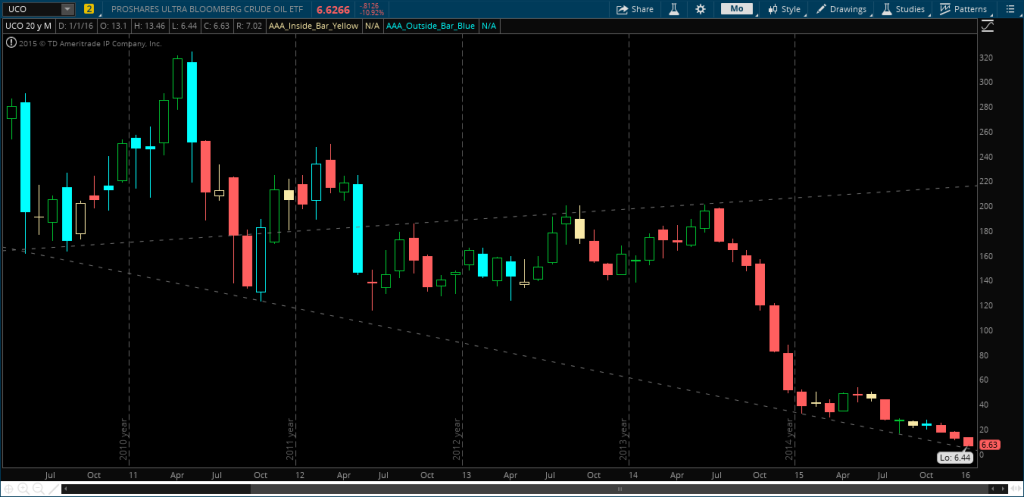
For this market to bounce, we have to have Crude Oil bounce — or even just not get absolutely KILLED, for a few days. Good news is the long term monthly chart is coming into support. The downside doesn’t seem that much further away – so oil stabilizing over the next week would be huge for the overall market.
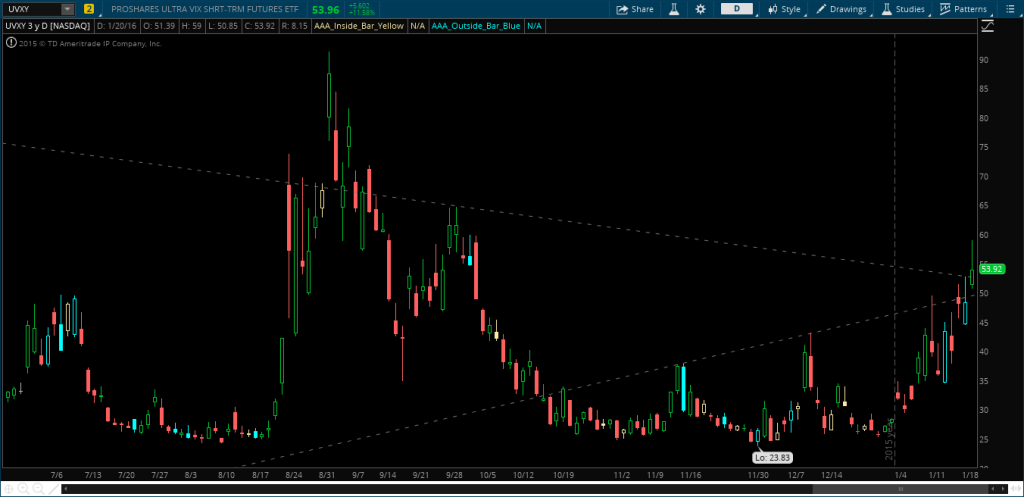
UVXY is setting up with a daily shooting star candle after this enormous run. With any stabilization of the market, this WILL get murdered. Stay on this one, do not miss the move down if the market rallies.
For the riskier traders you can probably start testing longs here with small size. The risk to the downside is very small over the next few days if you keep your size light. If you are less risky, atleast let this market take out the prior days’ highs and stay above them, something the market has done once this entire year.
Hope this helps for the next few days, as the opportunities are everywhere these days.
If you enjoy the content at iBankCoin, please follow us on Twitter


Nice dude thanks