What happens when the market drops 5% from the opening print of the week and then regains all losses to go green for the week? Hammer Time.
From a technical mechanics perspective we had a ton of stops set off from the August lows and the October 2014 lows. What this creates is an order flow vacuum, where sellers are done selling, longs are stopped out, and the majority of orders outstanding are either short covering or small natural buying. We wrote about this at noon on January 20th, three sessions ago – noting that testing longs is a very high risk/reward decision at that point.
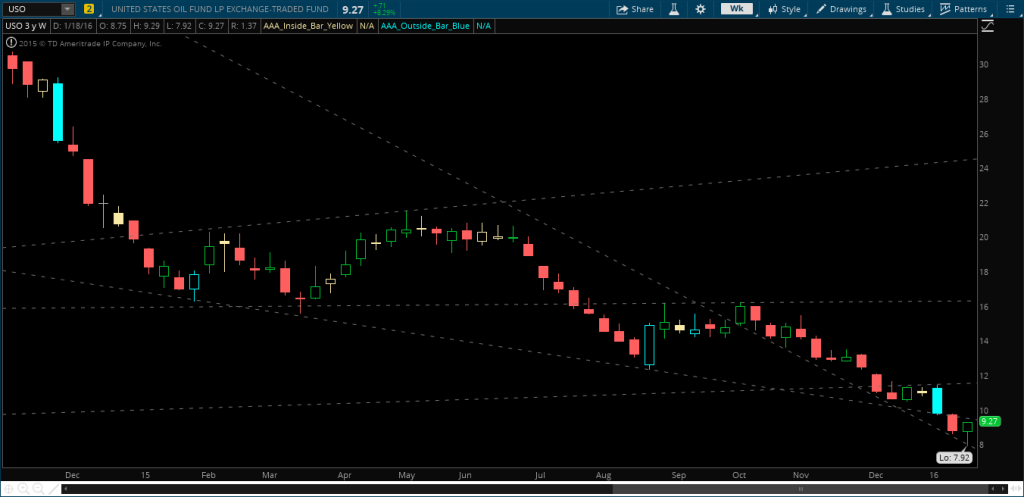
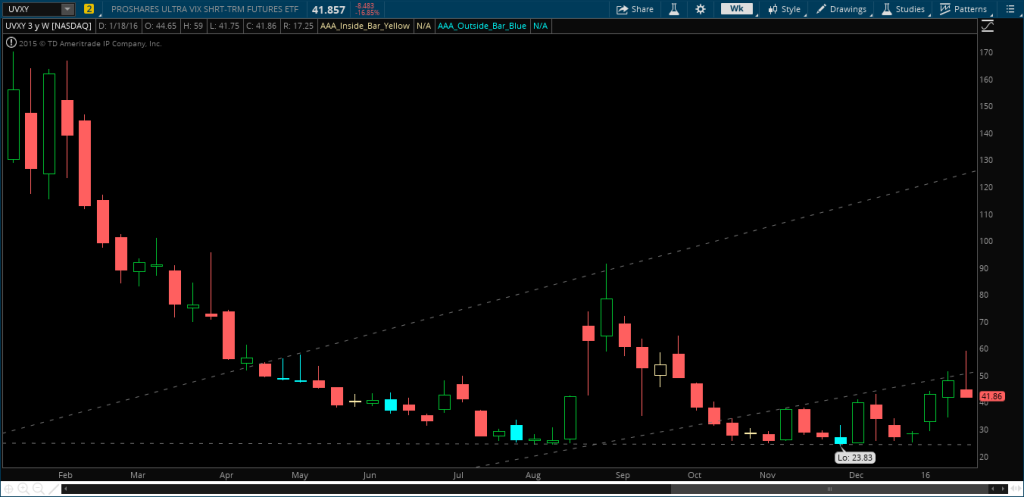
That being said, we have hammer candles on all of the weekly charts. Hammer candles (as well as shooting star) fall into our “actionable signal” list here are Varel Research. What this tells us that is shorts/sellers are potentially on the wrong side of a trade, and buying pressure has led us back to highs. These signals are different than inside/outside bars, which we stress about a lot here, as we do not know exactly why hammers/shooting stars occur. Was it simply short covering? Or was it natural buying? That is what we are waiting to figure out in the coming week.
——————————————————————————————————————
That being said let’s take a look at the charts and see where this rally may take us.
In my opinion you only really need a few charts that will show us the potential move ahead of us. In periods of high volatility, traders need to hone their focus in a few stocks – as alpha is generated that much more quickly and your timing is very important.
So, if we look at SPY, USO, and UVXY we can see a few things line up.
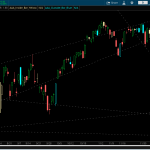
For SPY we see that we have resistance (top of a broadening formation) at the outside day from 1/13. Our next spot of resistance here is around 195.
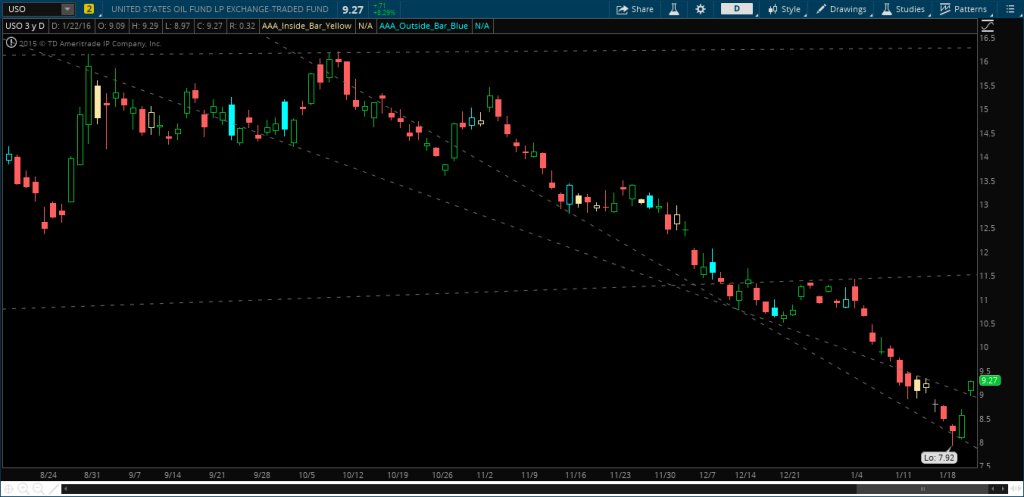
This measured move in the SPYs also lines up with a potentially large rally in the Crude Oil patch. As we can see in the charts, it is not out of the realm of possibility to see a move to 11.50 in USO. This would also line up with a move to 120 in SCO.
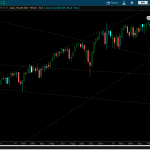
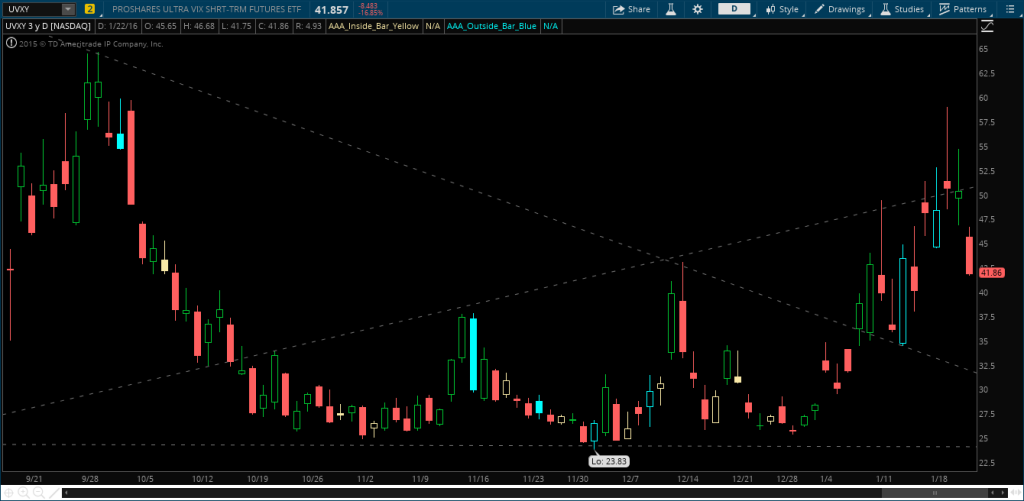
Lasty, the VIX products are absolutely doomed if this rally does go the way we think it will. If we start to rally and see the VIX products back into contago, UVXY will be printing in the low 30s next week.
Even if we look at other asset classes, the TLT bond ETF is weekly shooting star, and the GLD Gold ETF is reversal-setup (to the downside). Both of which signaling down-side moves and indicating strength in equities.
All that being said, who knows how long it will take for any of this to play out. This move to start the year was brutal, and we are not done going lower. Fortunately for the bulls it looks like we may make a move higher over the next few weeks. My approach for now is stick with my SCO short and generate alpha in the meantime trading SPY and UVXY. I think the move to 160 in the SPYs comes in March/April – so I’m holding out for the hay-maker until then.
If you enjoy the content at iBankCoin, please follow us on Twitter


One comment
Pingback: Eyes on the Financials | Varel Research