Tue Jan 12, 2016 2:42pm ESTComments Off on GUNDLACH’S MAILMAN (ANALYST): “LONG OIL”
Out of the crevices of Jeff Gundlach’s mailman’s ass crack we have decided that oil will rebound TODAY.
Yeah traditional technical’s don’t show shit, that’s for sure.
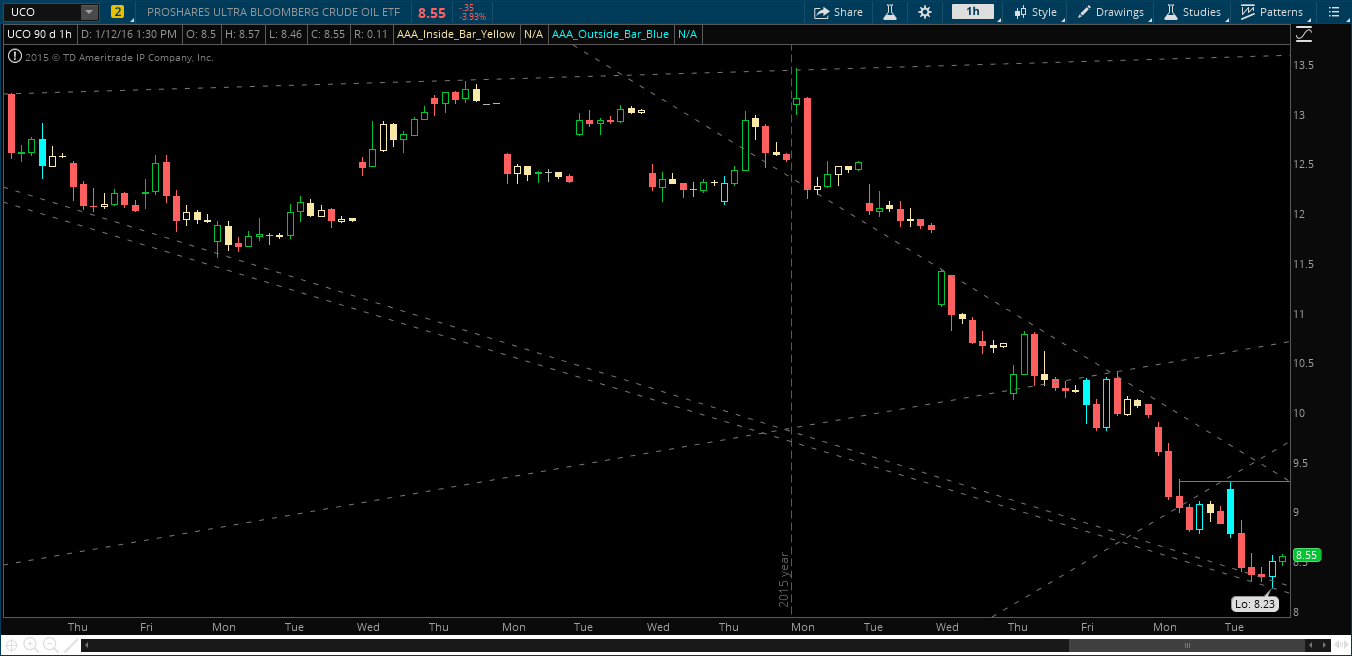
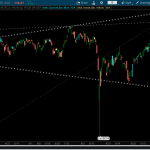
But what we analyze here, and hell maybe even Gundlach’s mailman does too, is that we have reached a broadening formation low. As you can see in the chart below, we have reached broadening formation support. So maybe every blind squirrel does, in fact, find a nut.
UCO 60-Min Chart
I have been looking for a scalp long in oil for sometime now, and was wrong the first time. This time, now that I have Mr. Gundlach on my side, I shall prevail. Energy bears have had their fun, now let me scalp my shekels.
Long a shit-ton of the Jan4 UCO 9 Calls as of literally right this minute – as we break the 60-min hammer off of broadening formation support.
Stop is at 8.20 (if the options are even worth anything at that point), with high end targets of 9.50 and 10.50.
Cheers Jeffrey!
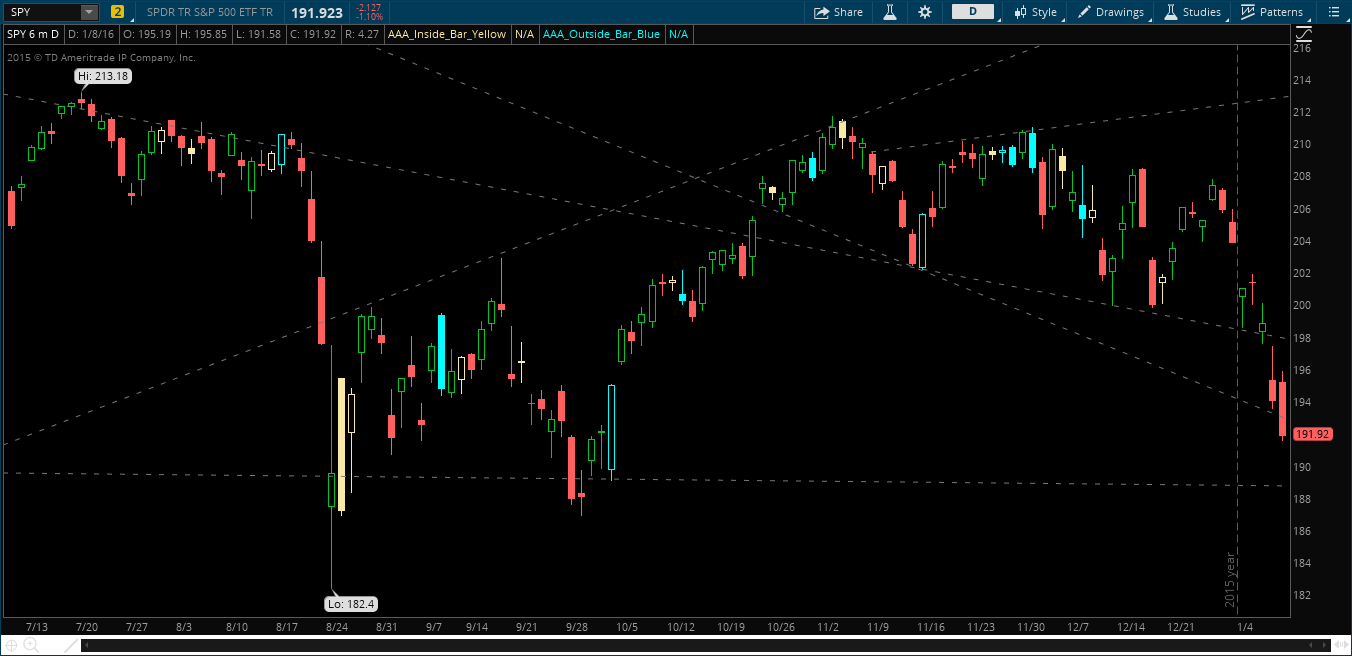
After a 1,000 point down move in the Dow this week I LOVE seeing people on the Twitters that they are sitting in cash. Are you f*cking kidding me! Cash is most definitely NOT a position this week. You should be bathing in all the coin you banked this week.
I get it, unless you came into the New Year short (which you should have) it was a little tricky early in the week.
Monday: Daily Hammer and we close on highs. Definitely tough to hold short, and a good spot to test longs even.
Wednesday: THINK OF THE PSYCHOLOGY here. If everyone is testing new longs over the last two days, and we gap lower — we now have a HUGE participation group on the wrong side of market direction. At this point it is time to test shorts gain.
Thursday/Friday: You’re right – press your damn shorts. Stop sitting around in “cash” because you feel safe.
SPY Daily Chart
From a trading perspective. The market over the last year or so has been slow and basically trendless – not my forte for trading. My thesis’ take longer to play out and may reverse and change my opinion quickly. But, when you get that glimmer of volatility (August, and now this week) your skills get put to the test. If you don’t make money during these periods, you need to re-think your process. Social Media is LITTERED with traders that panic during volatility – which astounds me. Volatility is your friend, not your enemy as a trader.
My advice going forward is this:
SPY short-term low target is 189 for next week.
The market will NOT crash. This happens when no one is ready for it.
It’s NOT time to press all-in short anymore (yet). The market will re-set up again (to the long side or the short side). Patience.
Yes we will bounce, yes it will be trade-able. Longs should be a one-night stand, not a long-term relationship.
The best traders stand out in these periods of high volatility. Find them (@varelresearch and tons of other traders here at iBC) and learn their processes. The opportunity this week was AMAZING.
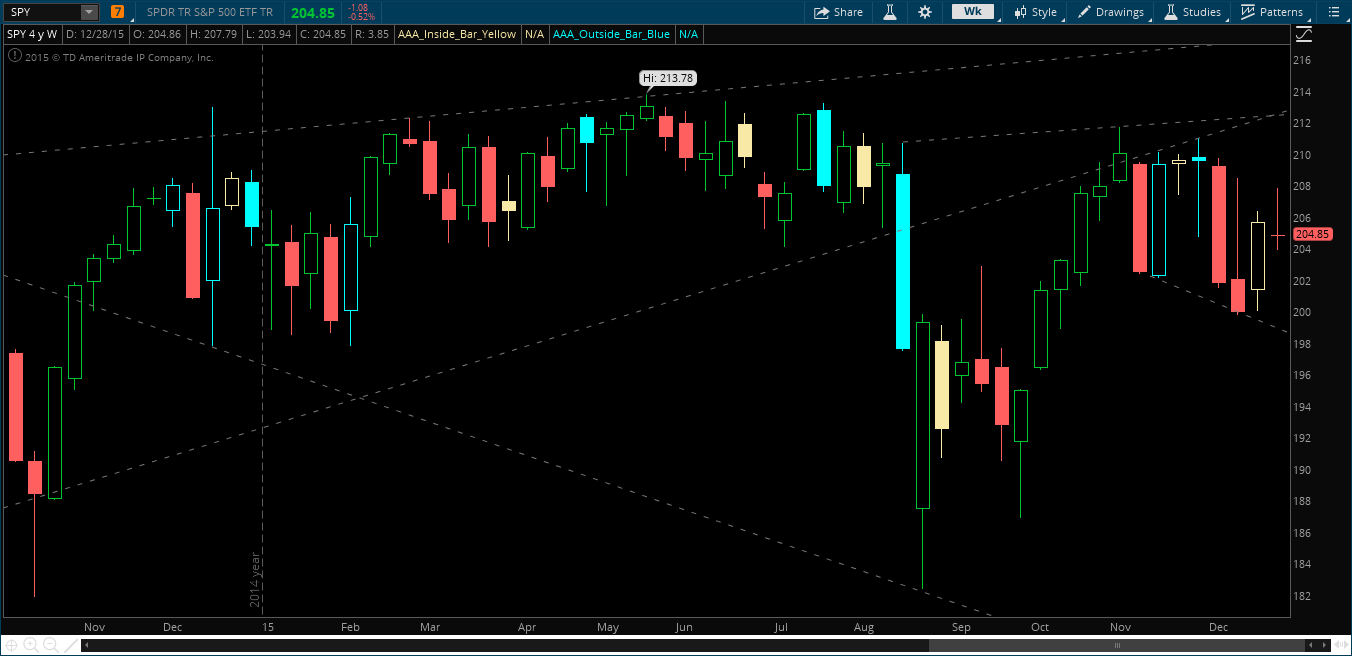
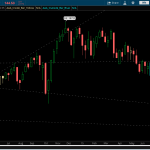
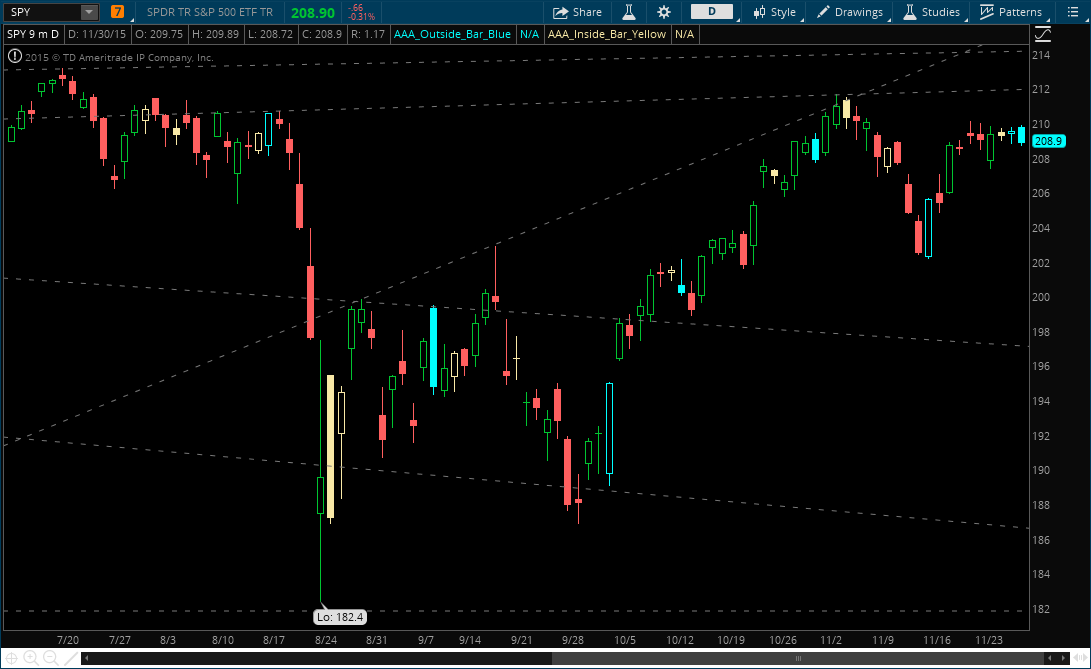
The charts are pointing toward a very weak opening to 2016. Ready for the carnage?
SPY Weekly Chart
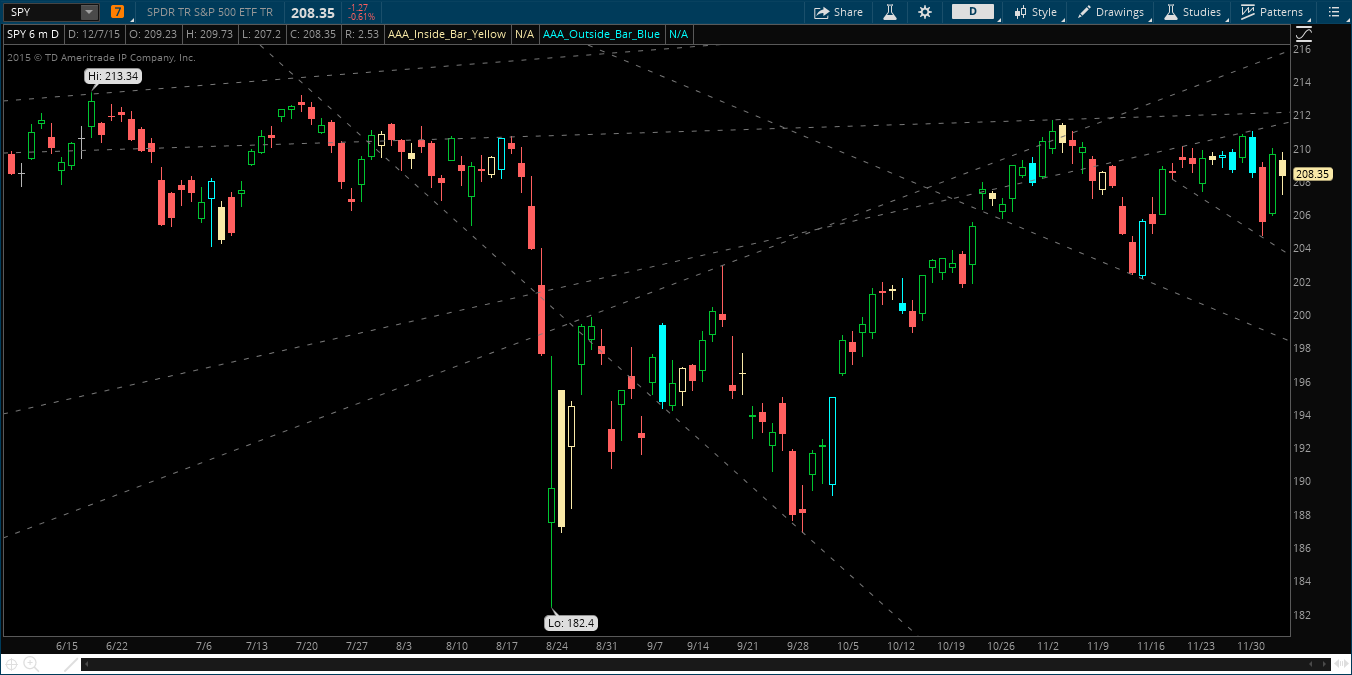
On the SPY weekly chart we have a reversal-setup: the strongest, most effective short-term indicator we look for. From a technical mechanics perspective we have the following:
1.) The last week of the year, SPY and DIA went inside week and up. New longs are now long SPY above last weeks highs of 206.33
2.) Shorts are beginning to get stopped out as SPY climbed above 206 and tested as high as 208.
3.) A trigger of this reversal setup, below 203.94 (this weeks lows), brings back in new shorts, and longs from the prior week are being stopped out.
4.) Time Frame Continuity – Depending on the opening print, it is safe to assume if/when we take out 203.94 we will then be red on all time frames: Day, Week, Month, and even Year.
Full Time-Frame Continuity + Reversal-Setup = CARNAGE.
As SPY began to break below 206.33 yesterday, I started a small short position. If/when we take out 203.94 I will be adding to it with massive size.
Did you read the post from Sunday? Have you taken note of the importance of inside bars? Posted here, here, and here as well.
As we noted, Inside Bars represent an equilibrium – bulls could not take us higher, and bears could not take us lower (than the prior time frame). A tug of war if you will. The break of these equilibrium’s are often that final tug that the respective bears/bulls need to propel the next move. Look back and any chart and start analyzing the importance of inside bars – quite possibly the most important (and under-utilized) aspect of technical analysis.
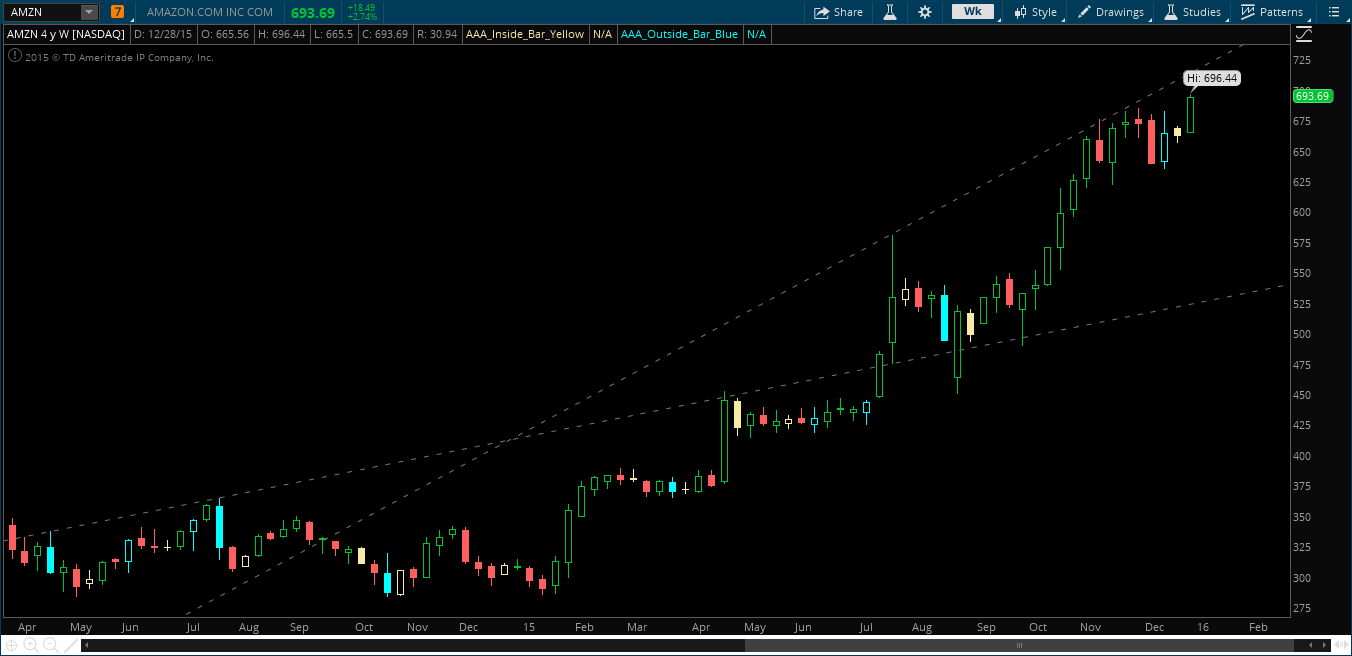
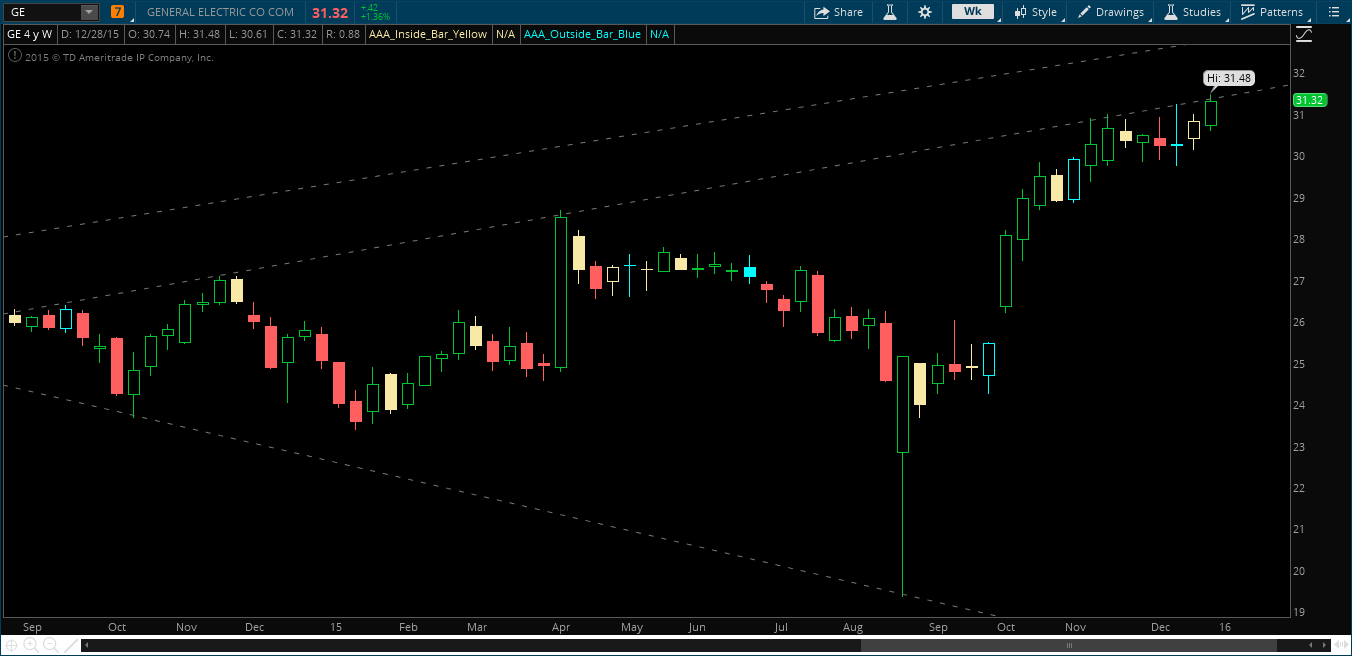
Notable inside week breaks:
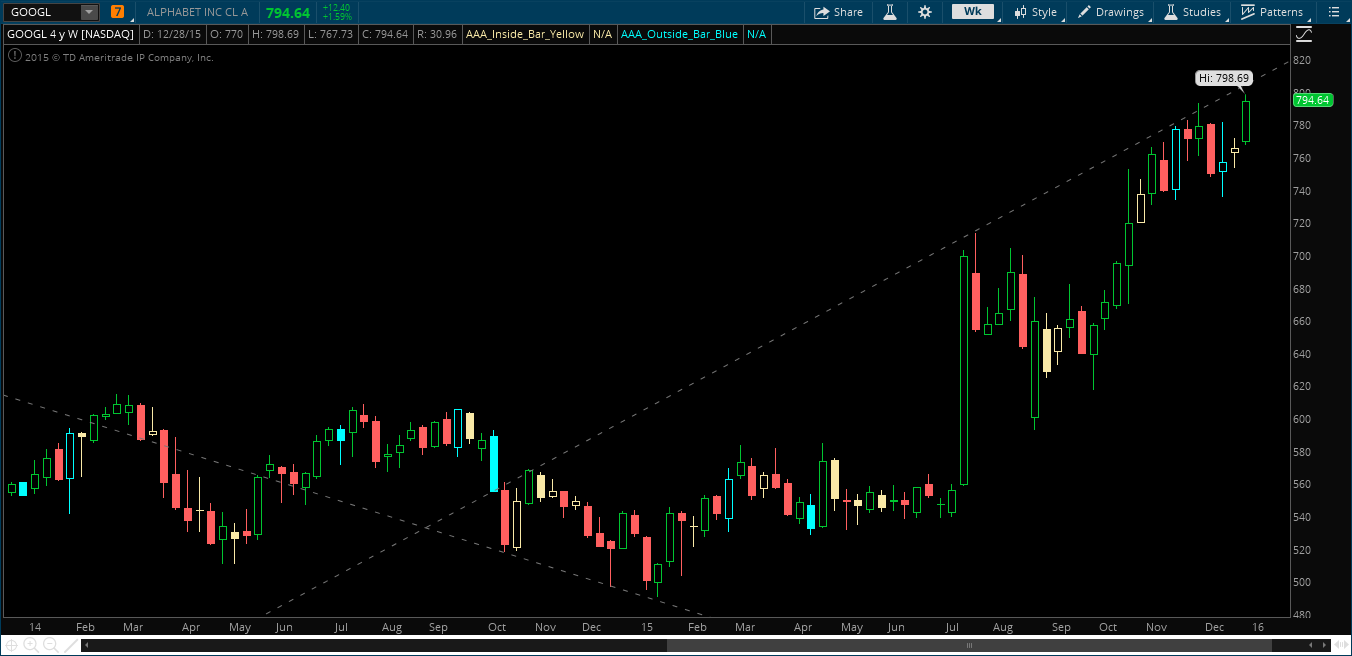
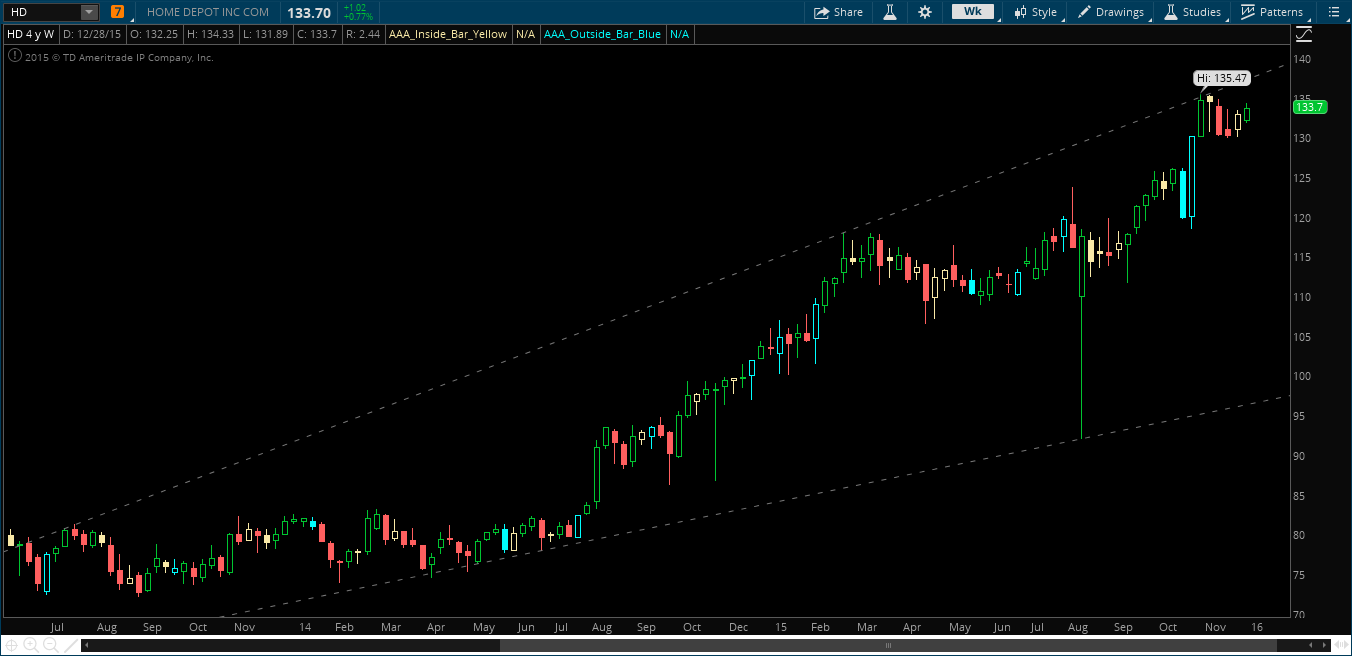
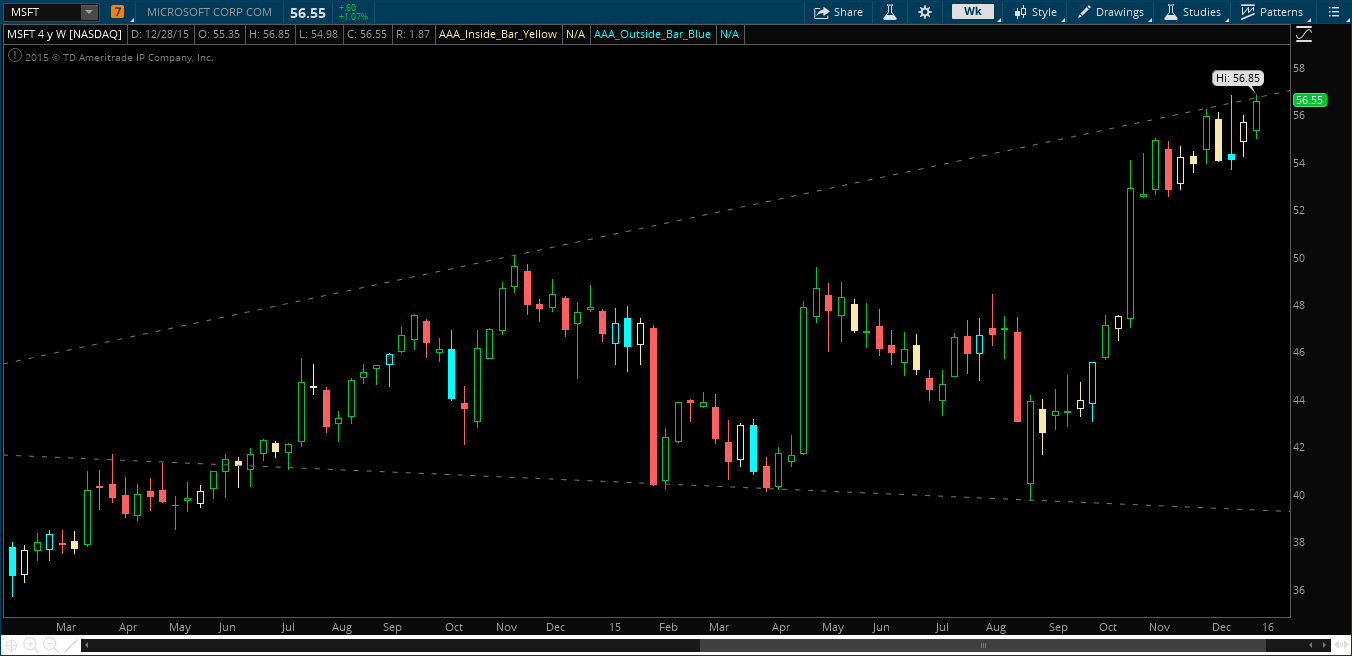
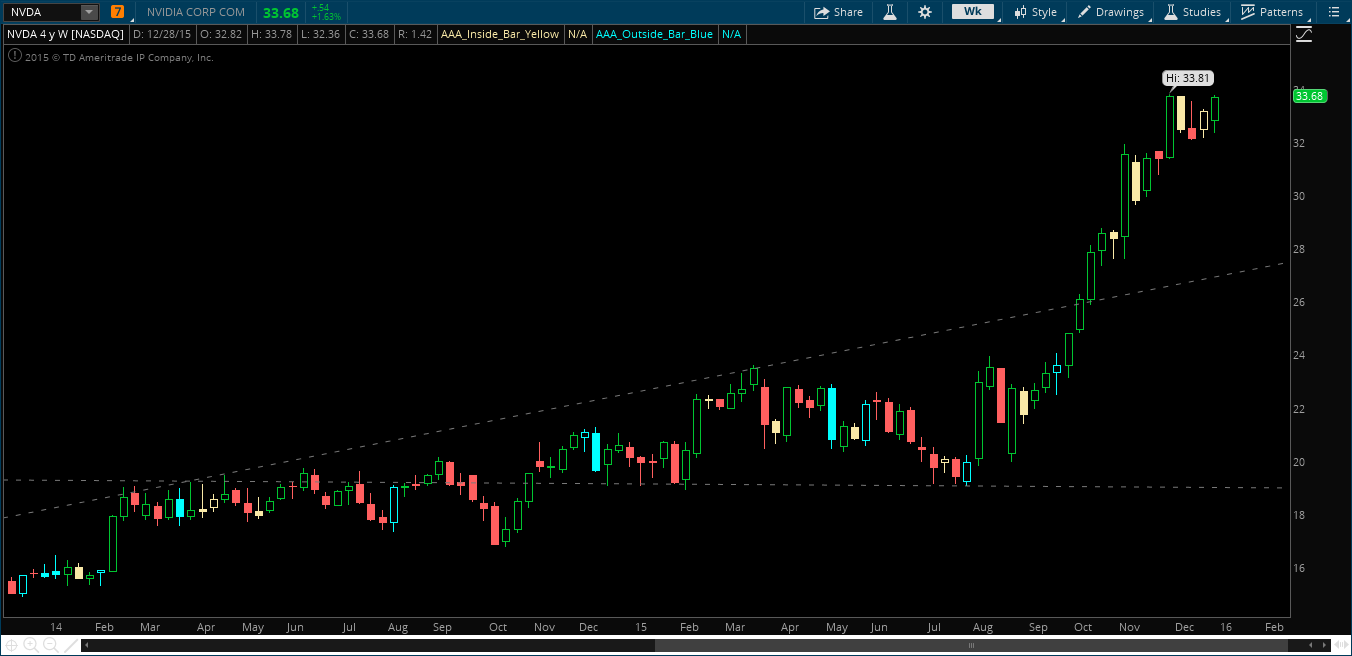
GE, AMZN, NVDA, GOOGL, MSFT all broke their inside weeks and made new 52-week highs. Grade A setups that paid very well into Tuesday.
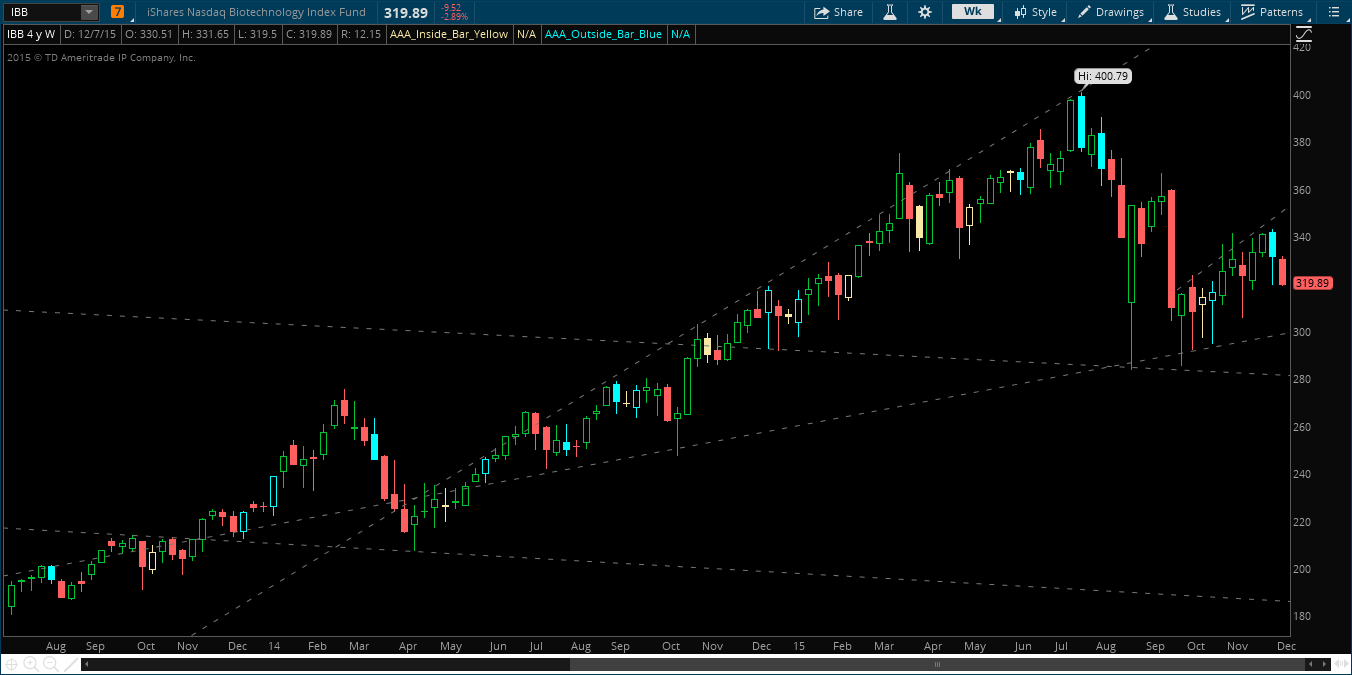
The biotech “bubble” is about to explode in your face, are you ready for it?
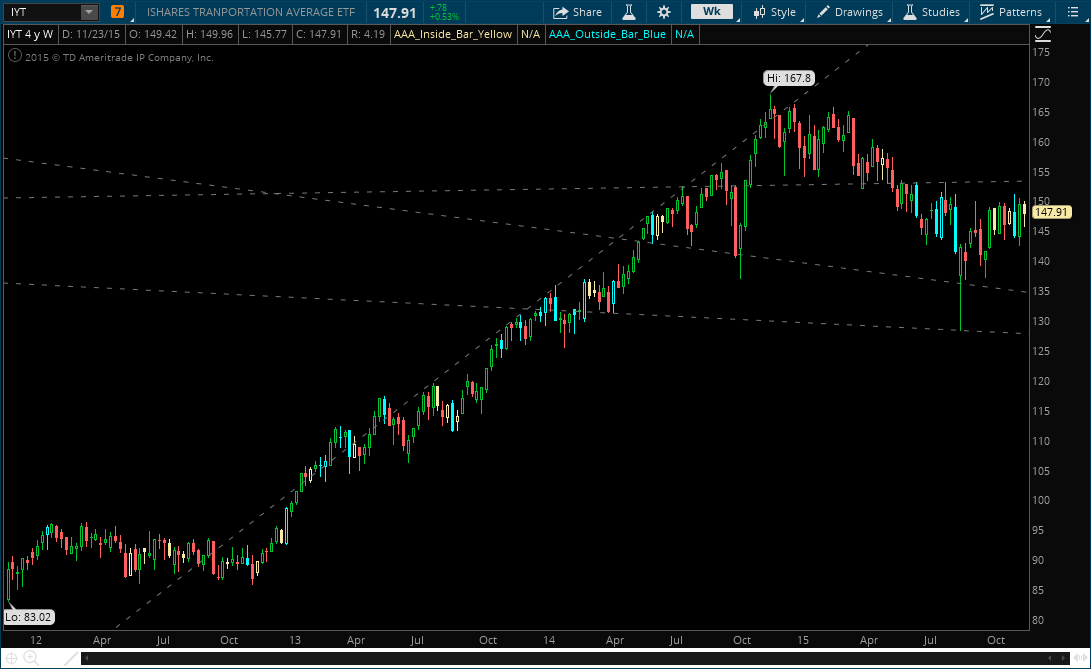
Across the other sectors we have a lot of things going on – Rails (Transports) are getting annihilated (which was expected and posted here 3 weeks ago) along side the obvious Oil/Energy raping we’ve seen (also posted here, two months ago). Banks are doing absolutely nothing thanks to the Fed meeting this week, so the jury is still out there. While Consumer Staples, Industrials and Consumer Discretionary are well off their recent highs, and selling volume is escalating after the low-volume rally.
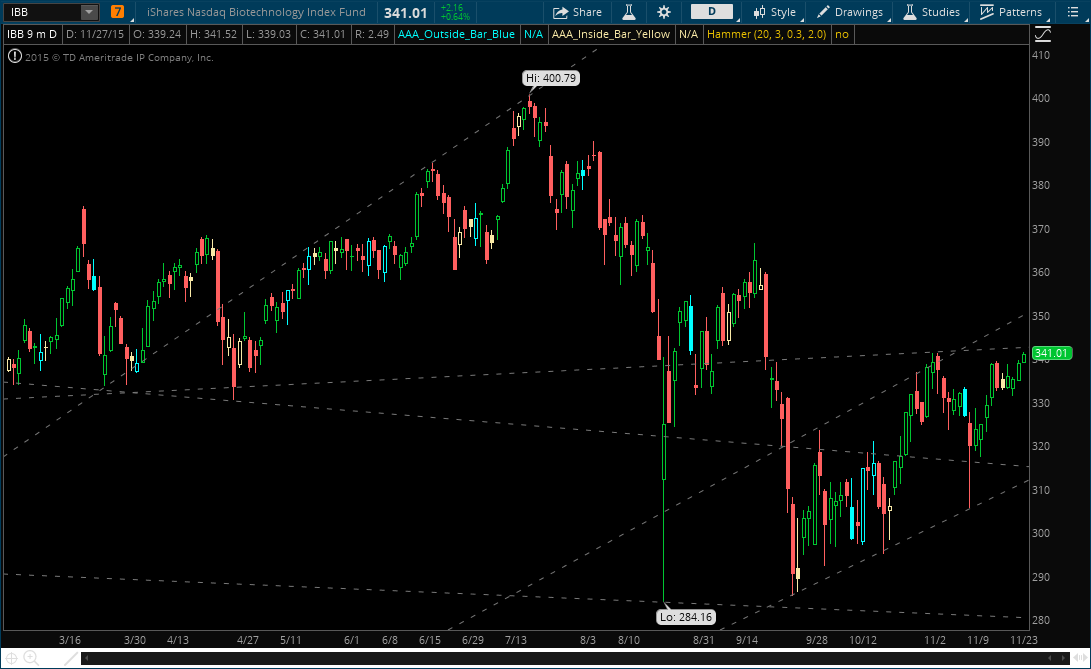
This leaves us with the lowly Biotech stocks, not really doing much of anything. Friday’s close of 320 puts us right at the same price we were trading at in August. If you look at the weekly chart (below) you’ll see a very slow creep higher, making slight higher-highs week after week, but no strong rally like we saw in the broader markets. Clearly, Bio’s are hanging on by a thread, and if you blink, you may miss a great opportunity to cash in huge.
IBB Weekly Chart
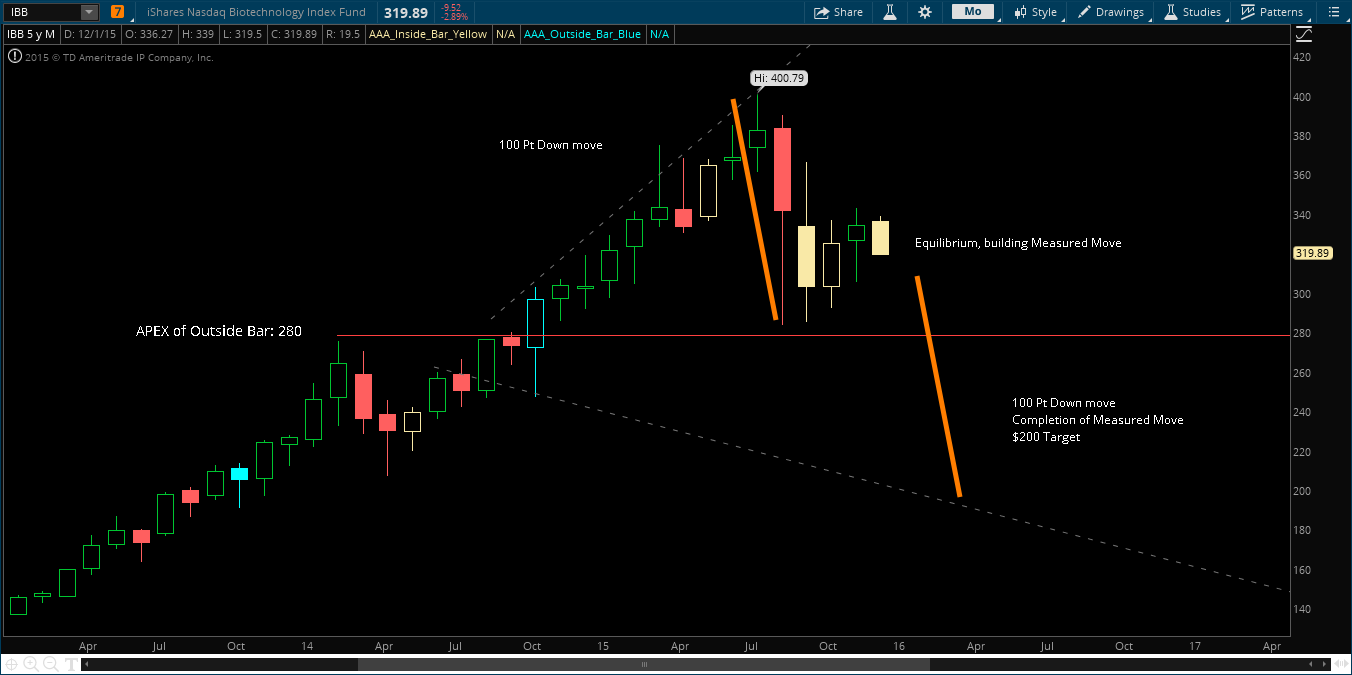
If we bring the chart out a bit and take a look at the monthly chart, we really start to see a great picture of the potential magnitude of what could take place over the next few months – and it looks bad. As we posted in October, the down move we saw in August was the first domino to the potentially fatal blow the markets. Over history, we see that these moves are often retraced 100%, and then the original move continues with authority (also posted here).
Therefore, if we take a look at the price action, we have a massive move brewing over the next few months. As we know, stocks trade in a series of broadening formations, and that outside bars represent fractal triangles and serve as high/low-end targets. Therefore, if we complete this monthly broadening formation, which is supported by the “measured move” theory, we have an absolute liquidation in the biotech sector on the forefront of 2016.
IBB Monthly Chart
If we take it level-by-level we have some key areas to note. First, the APEX of the triangle is 280. This will most definitely serve as short term “support” if you will, and will be our first target if we break down below 310. It’s is safe to assume we’ll see a stall out around 280, as the APEX of at triangle sees the most volatility. Below 280, however, we have smooth sailing down to 220-240 range.
The question here is how do we play this? It’s a tough answer to muster, because capital constraints, time frame, and timing all are major factors. For those of you that have capital limitations, look into the inverse ETFs (BIS for example). As IBB is so expensive and volatile, I believe playing this with options is very effective. If you have margin, selling the calls will be paying very huge. If not, you’re timing needs to be very good, as buying naked puts will be the way to go.
Stay tuned for our updates, because this will be a heavy focus over the course of the next 1-3 months.
Tue Dec 8, 2015 12:39am ESTComments Off on ATTENTION: Traders Only XXX
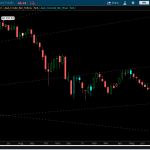
The action the last three to four sessions is great for day-trading, and that’s about it. Hypothetically yes you can put on long/short positions based off of this recent range, but you have no edge at this point, it’s a straight up gamble. It is very easy to get caught up in the wild gyrations of intra-day madness, but if you look at the daily chart of the SPY you can see that we are still trading in a +/- 2% range in the last month.
SPY Daily Chart
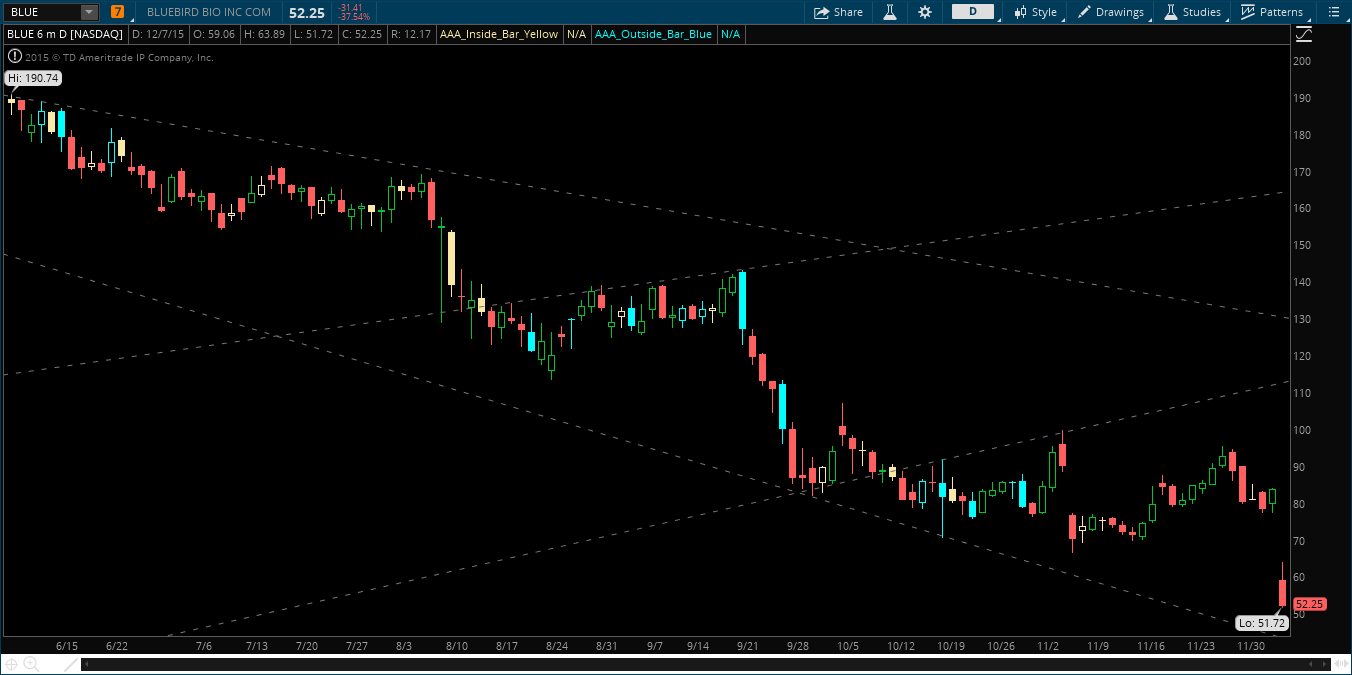
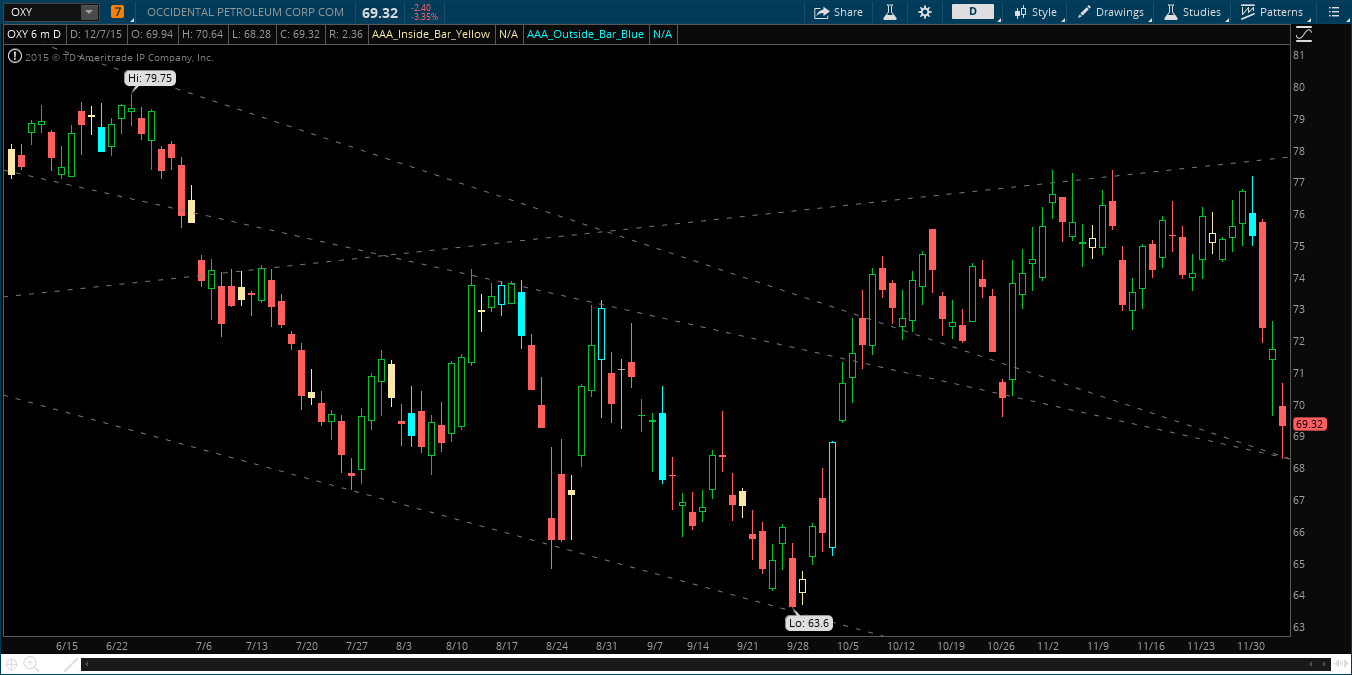
That being said, I think a little advice is due here for traders. In this environment, if you’re going to trade, make sure you are trading in the direction of the SPY for that day AND (most importantly) you are trading a position that is not inside on the day. For example, today we opened at 209.23 and almost never traded above that price (red on the day all day long), additionally we were inside all day long. As we know, inside days are actionable signals that represent an equilibrium between buyers and sellers — this type of environment is very choppy and very difficult to trade. Further, as long as we were below 209.23, we are trending to the short side and want to look for stocks that are taking out the prior sessions’ lows (aka they are not inside day). For example, OXY and BLUE were very tradeable:
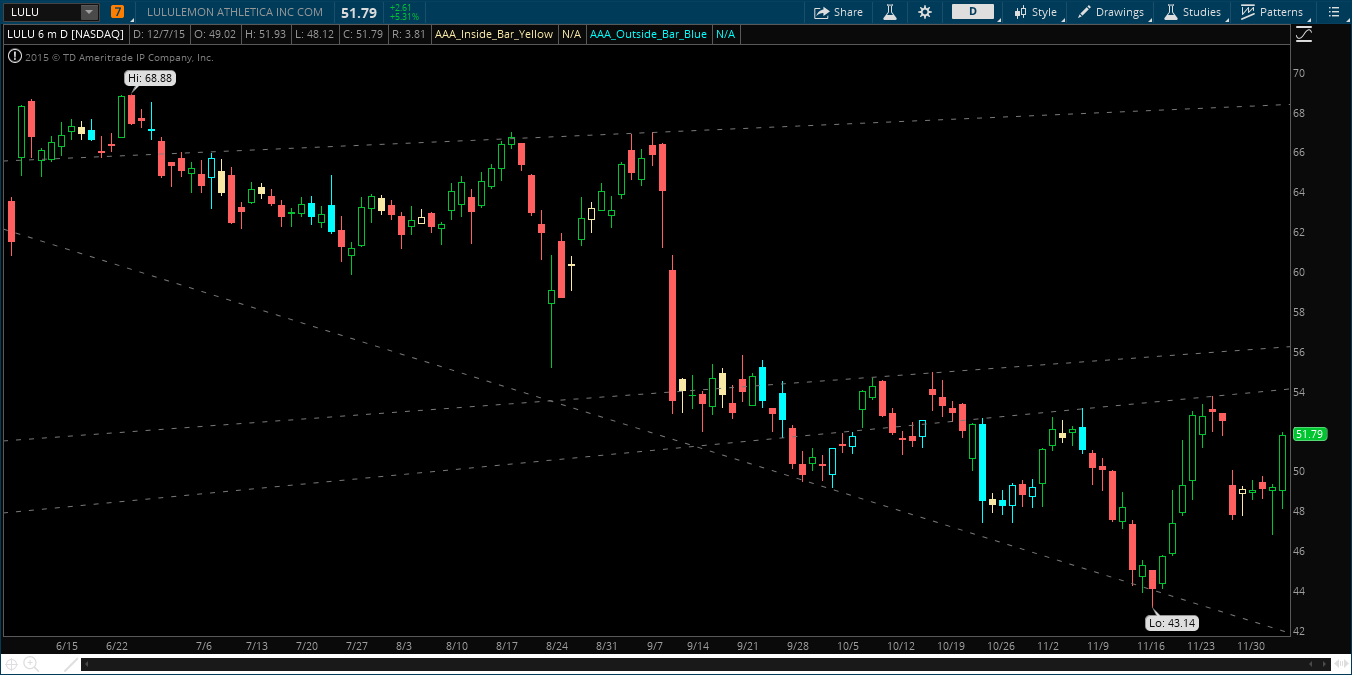
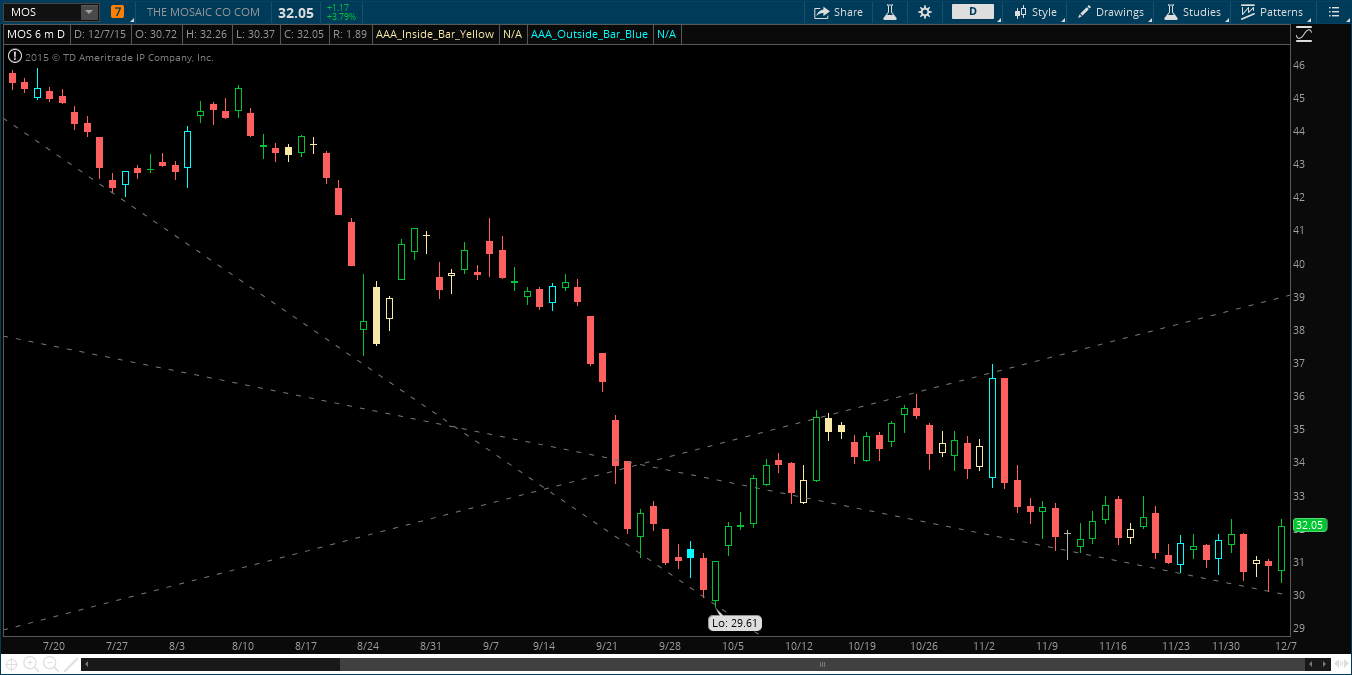
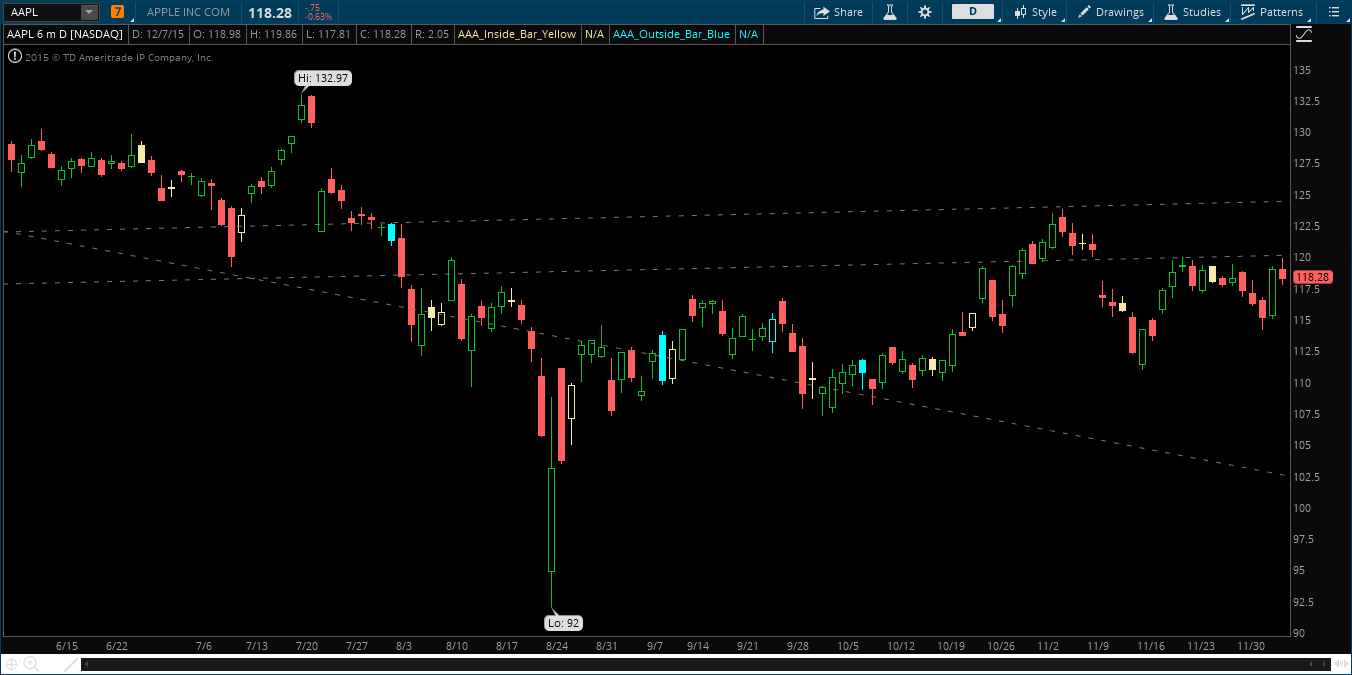
On the other side of the coin however, we have the ‘natural buying’ that is very easy to identify on days like today. While SPY sat inside day all day, stocks like LULU and MOS painted the tape all day and it was very obvious that someone in there had a huge buy order. From a psychological perspective, if you are short these names you are scrambling – as the market isn’t doing shit and your stock is getting run up your ass. Finding these types of setups are huge on days like today. Natural buying is different than a stock that is trading above the prior days’ high, though (see AAPL below). So make sure to try and identify the difference. These stocks are obviously very tradeable and should be a high priority on days like today.
The moral of the story here is to have a very keen eye on what the SPY is actually doing on a larger time frame: NOTHING. Do not get caught up in intraday volatility, and focus on relative strength/weakness throughout the day. Side note – take time every morning and follow a list of stocks that have gapped up/down on news. These stocks are Alpha-generating machines as natural buying/selling must occur.
What a B-E-A-UTIFUL DAY! Last night I went chart-drunk and posted all of the sector charts – and every last one had bearish signals coming in to today. I understand what I do may seem foreign, but I know that if you analyze price correctly you will always be trading directionally in the proper direction based off of actionable signals. As we took out yesterday’s lows in the SPY, we then took out last weeks lows. Additionally, we have time frame continuity to the downside in ALL SECTORS (trading lower than we opened on all major time frames). All of these was a recipe for destruction. Thanks Obama!
I did cover all of my day-trade short positions by the close, and only remain long TWTR via long term calls. Here is the list of signals I posted last night on Stocktwits/Twitter:
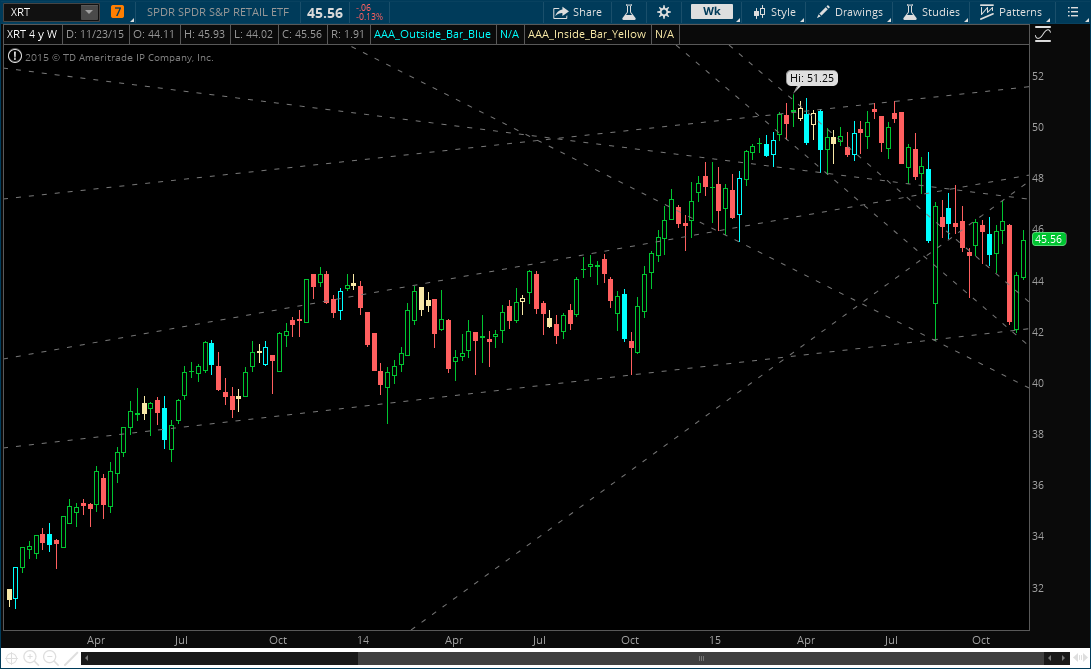
XRT Retail – Reversal-Setup on the Daily Chart
IBB Biotech – Daily Shooting Star
XLI Industrials & IYT Transports – inside week and down
SPY – Outside Day (Confirmation today triggered reversal-setup on the Weekly Chart)
XLE – Inside day and down on Wednesday (triggers reversal-setup on Weekly Chart).
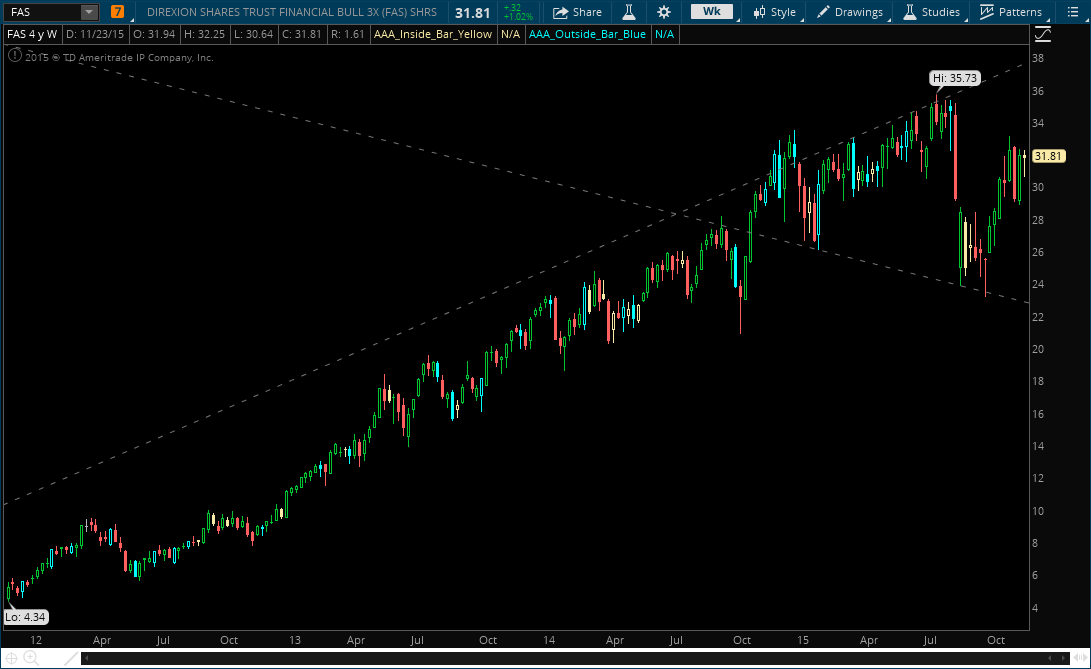
FAS – Bearish Engulfing Day (triggers reversal-setup on Weekly Chart).
The term relative strength, in all its subjective glory, ranks as one of my top 5 most important aspects of trading. And for the record, I don’t mean Relative Strength Index (RSI). The problem with RSI is its complete lack of Time Analysis. Stocks can remain “overbought” or “oversold” over long periods of time, a la, AAPL for four years (2009-2013). I believe that AAPL had an RSI over 70 this entire time. So does this mean we are not to buy this? Worse yet, does this mean we should short?? Furthermore, it completely lacks the concept of a bear market. For example, Crude Oil (USO) currenlty has an RSI of 32. Oil has been in a bear market for over a year – and it takes months, if not years, to get out of these conditions. As a trader, you want to be shorting bear markets as often as possible – bear markets are your friend. Yet again, RSI, when used by itself, is a complete disaster.
Additionally, RSI does not take into account the technical mechanics or the psychology of trading. For example, if I am short a stock that has an RSI of 80 (scale is between 1-100), in the thought that it is “up too high,” we are betting that a HUGE group of market participants are on the wrong side of a trade. Why would it be that YOU, Johnny Hammersticks, is the one guy that knows the stock is up too high? Why not join the party and get long with EVERYONE ELSE.**
Additionally, it is IMPERATIVE to think about what the other side of the trade would be, and how that group of investors are feeling, what they are seeing, and potentially where their stops would be if the stock moved against them. As such, a good trader would know these spots and levels and be long the stock KNOWING that if this “overbought” stock went higher, there is no possible way those short the stock could remain short. It is clear that RSI is a lagging indicator. Therefore, we need to focus on building core positions into a strong RSI.
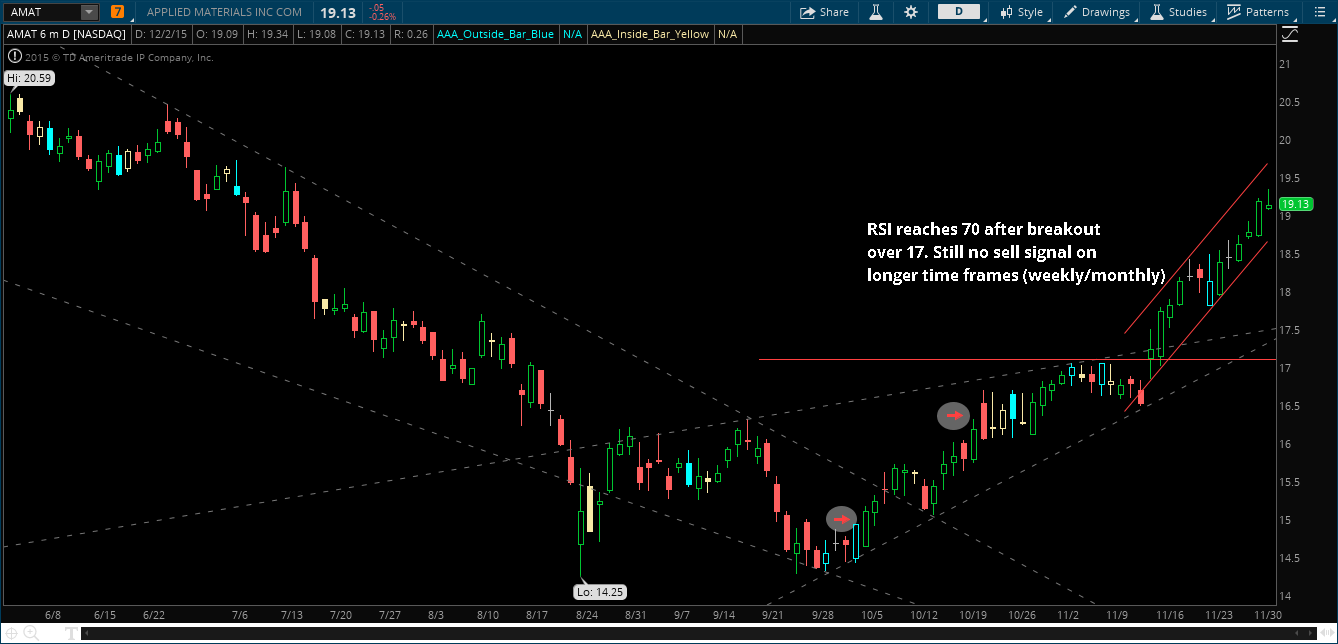
Case Study:
I went to FinViz.com and ran a scan for stocks with an RSI over 70. First on the list is AMAT. We obviously do not know what stocks will eventually reach these “overbought” or “oversold” conditions, but the goal here it to be in these positions as they reach these levels – and then ADD to them as necessary. Your biggest winners are the stocks that you add to as your thesis confirms (yes, dollar-cost averaging is a fools game). As we analyze price and time, our goal is to buy stocks into support as the longer time frames are green (higher than they opened for that period).
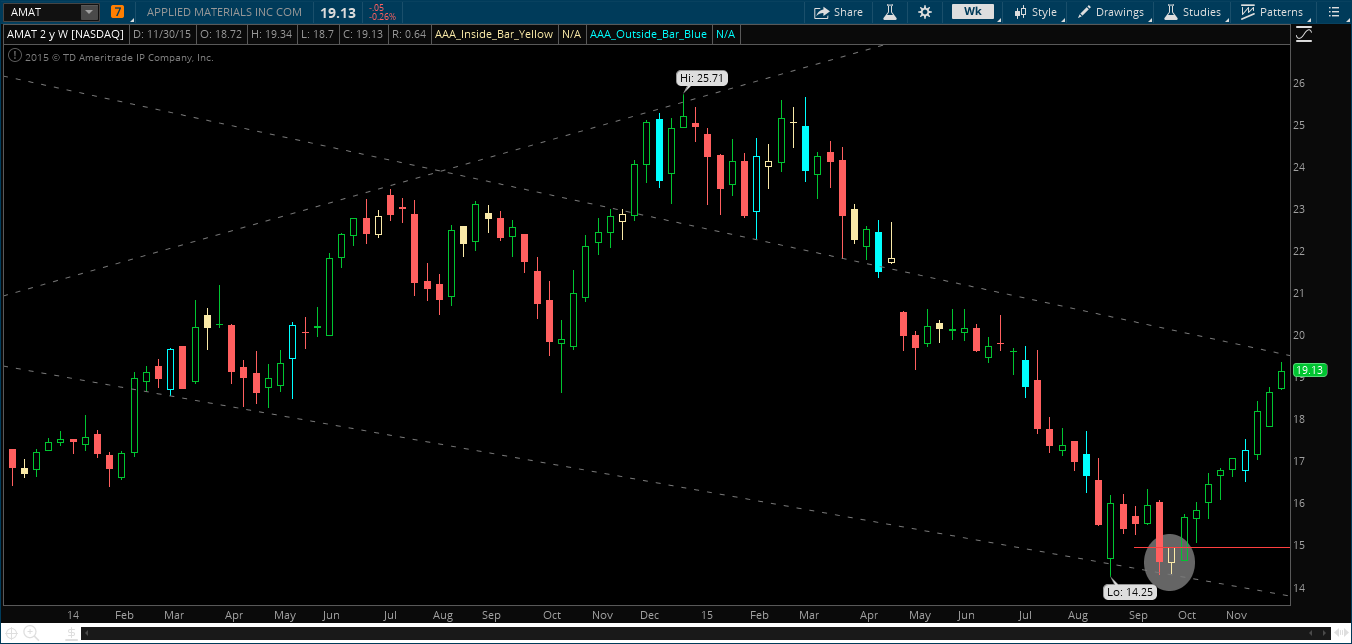
1.) Trade initiation: AMAT goes inside week the week of 9/28 at the bottom of it’s broadening formation. We are long our starter positions on the inside week break the following week from 14.95. At that point in time when we breach this equilibrium, it is the first week of October, and we are higher than we opened on ALL time frames (Time Frame Continuity).
AMAT Weekly Chart
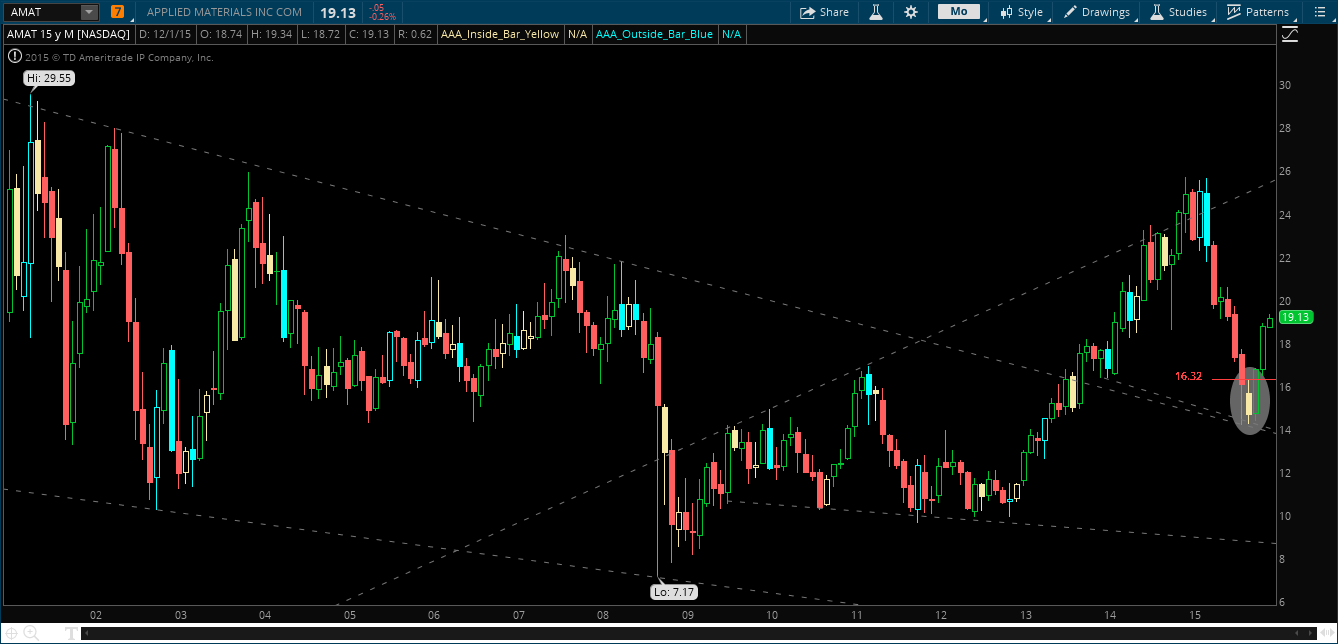
2.) Adding: AMAT goes inside month and up later in the month of October at 16.32. Here we ADD to our position because we have another actionable signal (equilibrium) breaking and FULL TIME FRAME CONTINUITY. Here the RSI is building, but still not reaching overbought levels. Our average cost at this point (if we added an equal position) is only 15.64. Monthly chart below:
AMAT Monthly Chart
In conclusion, if you would have waited to buy AMAT as the RSI reached 50, your first initiated buy would be around $17, best case scenario. Rather, we are in at an average of 15.64 and then ADDING AGAIN over 17. After we clear 17 we let the market do all the work until we see a sell signal on a longer time frame, or full time frame continuity to the downside. Daily Chart analysis below:
AMAT Daily
**As we know, stocks constantly trade in a series of broadening formations – trading to higher-highs and lower-lows on all time frames. So, don’t get me wrong, on smaller time frames there will be periods to get short and be profitable. However, unless the longer-term signals are red, or they are showing sell signals, we are playing against the house with duece/eight.
Mon Nov 30, 2015 2:11pm ESTComments Off on Trading In Low Volatility
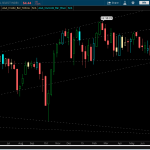
Monday morning kicks of today with a slow bleed in the morning, as traders still await some form of clarity. If we look at the SPY daily chart, we can see that we are going outside/outside day, after the inside day last Wednesday. In effect, the markets haven’t moved since November 18th
SPY Daily Chart
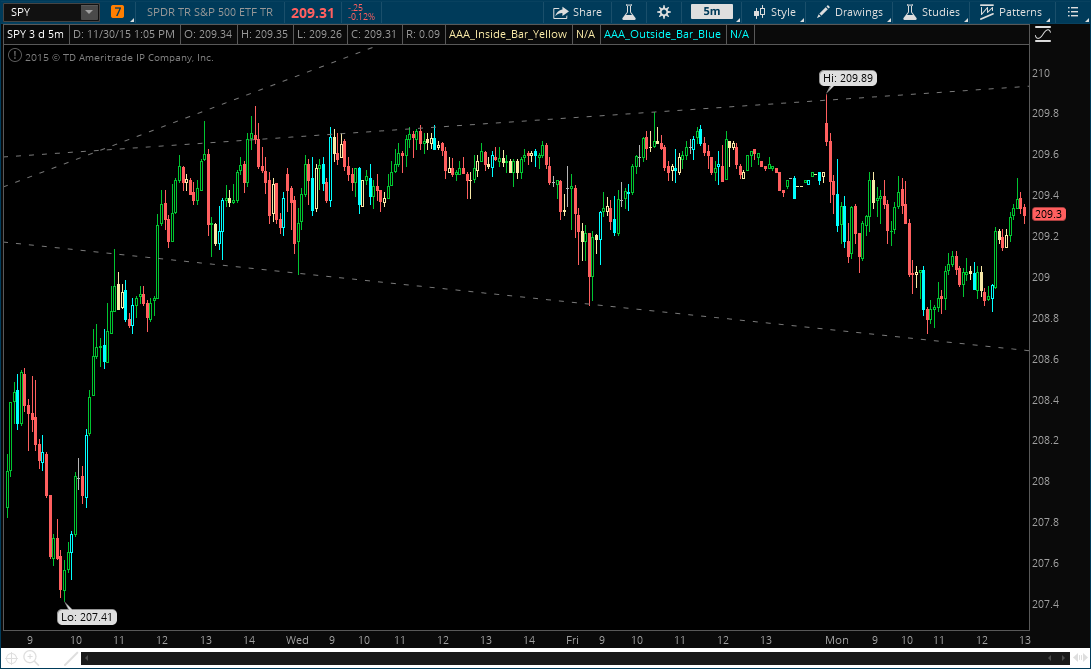
That being said, however, during periods of low volatility you can still slowly position yourself according to your thesis. If you believe the market is going to go up into the end of the year (as I do), you have to focus on getting the best price possible. Buying the highs and the potential “breakout” is not a conceivable plan when the market volatility has dried up. I hate the term “buy the dip,” but in essence you have to test small positions as markets fall into support (or rise into resistance if you are bearish). Whenever you are buying into support, it’s imperative to keep a tight leash on your positions and never let these short-term trades become long-term lovers.
As such, let’s look at the 5-minute chart from this morning. We fell into support around 10:50AM, providing you a solid risk/reward scenario if we held above 208.50 or so. Here I did get long the SPYs for a trade – moving my stops up to break-even. If SPY holds 209 for the day, this may provide a key level to hold swing positions against.
Sun Nov 29, 2015 11:14pm ESTComments Off on Squanto Speaks
Listen Peasants, I’ve had enough. You Puritan fools have yet again failed to do much of anything of value; sitting there helpless, weak, feeble. Just as the original settlers perished during that first winter in 1620, you all are well on your way to following in their footsteps. Lucky for you imbeciles though, John Smith, being the true bad ass that he was, decided to grip life by the balls and settle the shit out of Plymouth Colony. From there, he hired himself Squanto (technically he kidnapped him, but that’s neither here nor there), an interpreter that was the only reason that greedy white bastard accounted for much of anything. Therefore, call me Squanto, because I’ll be leading you worthless schmucks out of the woods into glorious national dominance:
Listen, it’s really not that difficult to understand what’s going on right now in the markets – NOTHING. After the “mini-flash crash” that we had in August and the subsequent October rally, the absolutely glorious annihilation in the commodities, the Chinese flatline, and the mixed bag of crap within the other dozen or so sectors – it is expected to see the market not doing much of anything.
The trading/investing industry is full of “pros” that will tell you exactly what the market is going to do one month, three months, nine months from now – but the facts are that price is NEVER guaranteed. These fools, the serfs that will shine the dung off your boots, provide you no value. And as such, you much approach the market lightly.
In this environment we MUST treat the market as if it was a series of “If/Then” statements. If the market goes up, then we do “X.” If the market goes down, then we do “Y.” Stop risking your life trying to be John Smith when you can just as easily be his neighbor and reap the benefits of his shitty judgement.
That being said, it’s time for a down and dirty Pilgrim Style analysis of what’s going on:
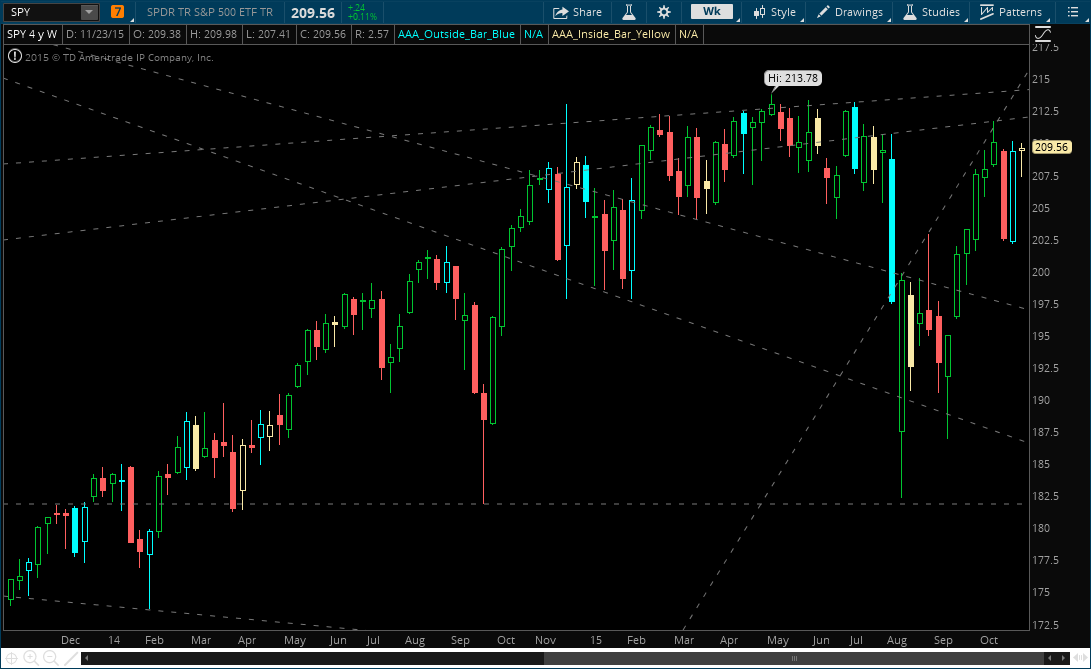
SPY: SPY goes inside week into the first week of December. The weekly highs/lows (209.98/207.4, respectively) should be your trigger longs/shorts if we get a clean break either direction.
SPY Weekly
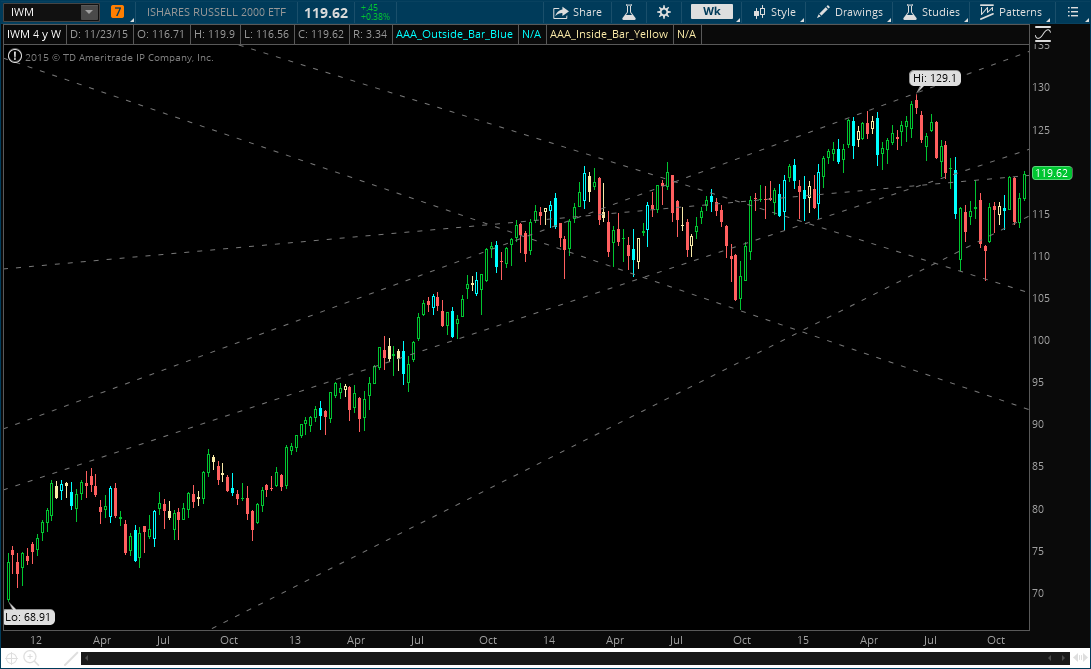
IWM: IWM has been much stronger of the last few sessions, and if we see the SPY go inside week and up, this is where you pour your money.
IWM Weekly
IBB Biotech: Biotech (and small cap) look absolutely phenomenal. A slow month of November is coming to a close, but if we can stay above 340 look for this to be a leading sector.
IBB Daily
Trannies are also inside week and the jury is still out. Above last weeks high we may want to test a few longs, but some of the rails are still looking weak:
IYT Weekly
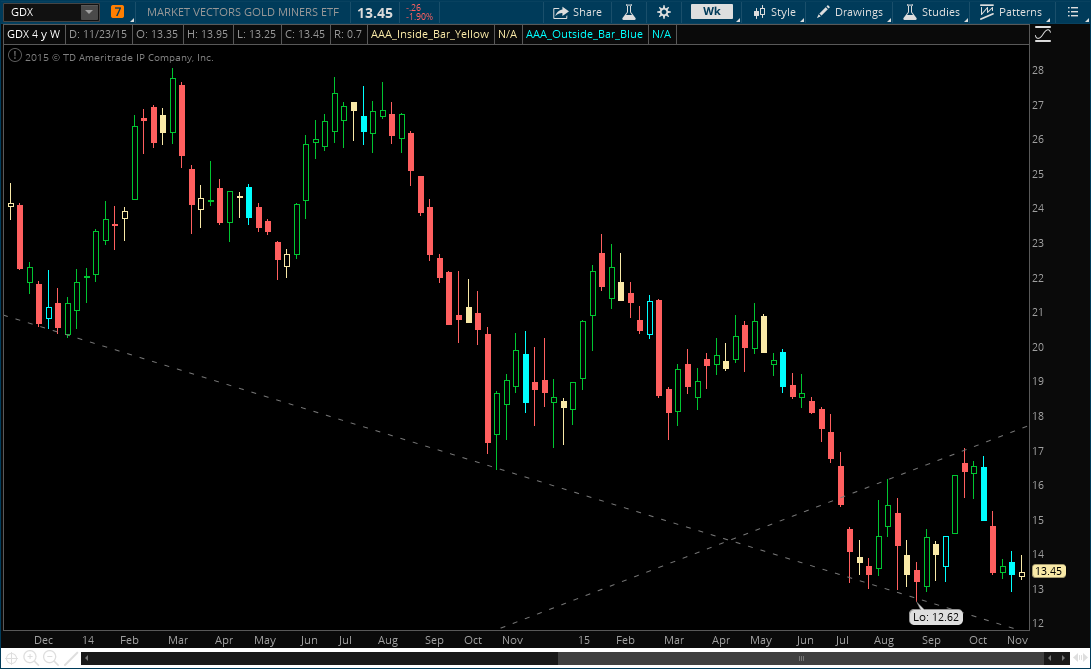
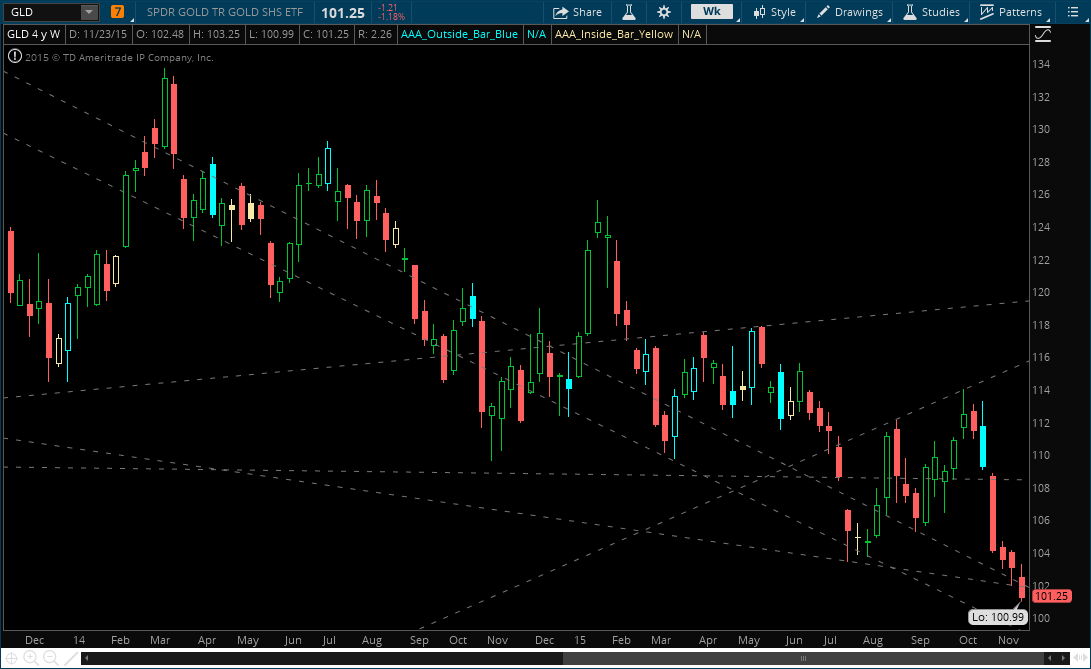
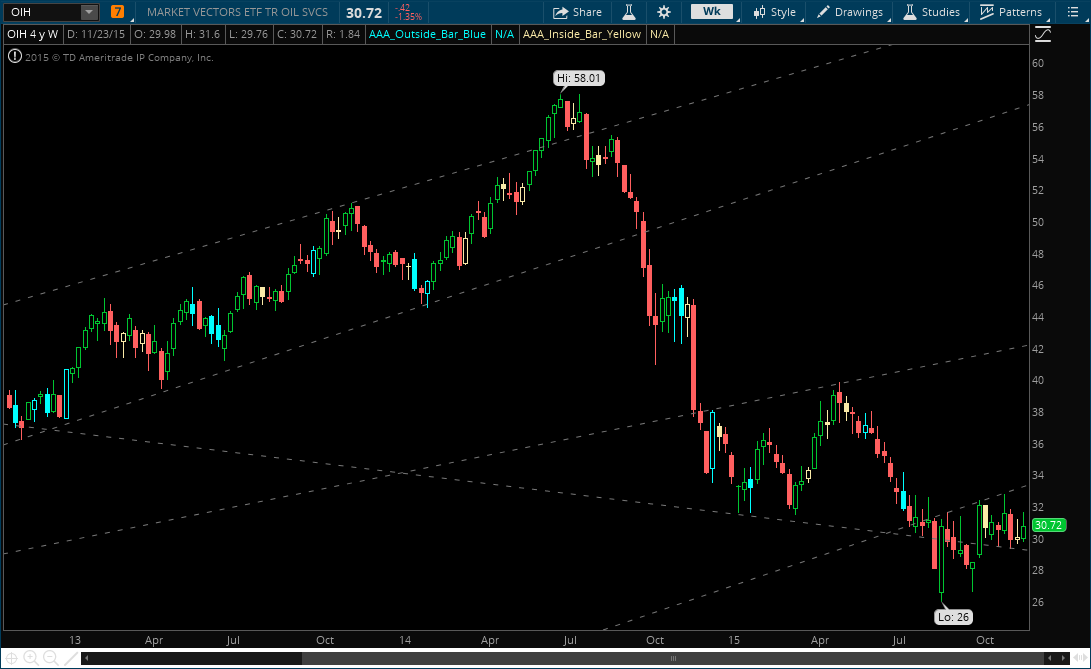
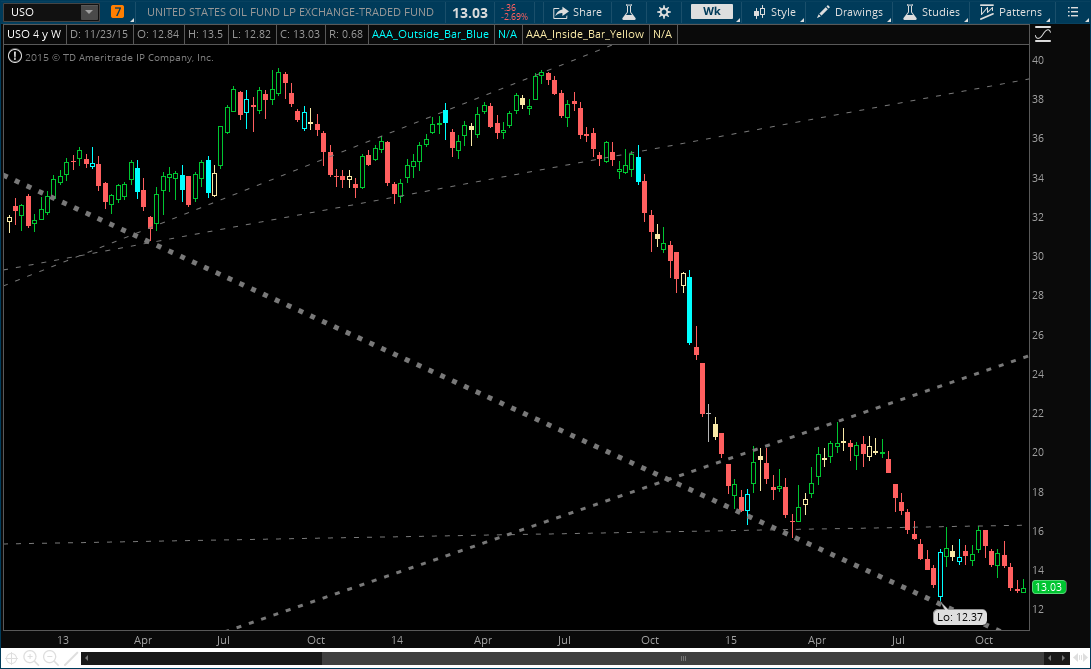
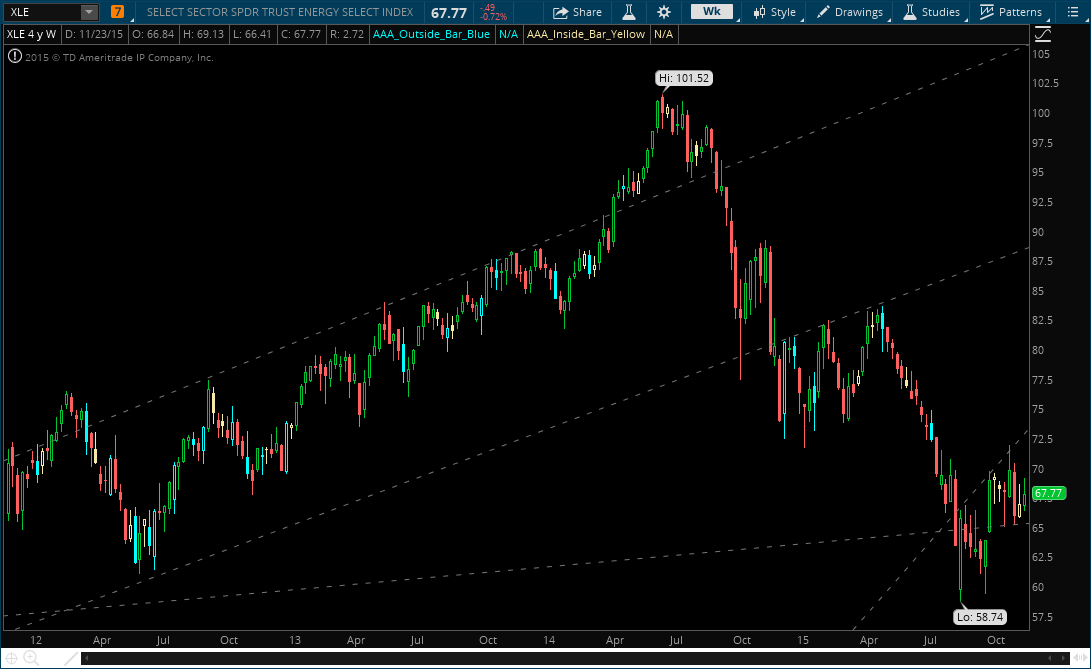
Oil, Oil Services, Natty Gas, Gold, & China: all of these are absolute garbage. I have nothing to say besides these are dead shorts. If you are long these sectors you are an absolute fool and deserve nothing but the guillotine:
GDX WeeklyGLD WeeklyOIH WeekyUSO WeeklyXLE Weekly
FAS/XLF: Financials are also inside week, weekly hammer, into December. Above 32.25 for FAS we trigger the long bias for financials. Let’s see if the buying into the rate hike is a real thing.
FAS WeeklyXLF Weekly
XRT Retail: the retail sector has been VERY strong these last two weeks. No signals from our charts, but a few individual stocks may provide alpha into the end of the year (ROST, TGT, EXPE, etc.)
XRT Weekly
So, for those of you that can follow along Mr. Rodgers style, IF the market goes up we want to hammer the Small Caps (including Bios), Financials, and possibly select Retail stocks. If the market goes down, we will be hammering the commodities and some of the Trannies. Here are a few charts along those lines that we are looking at: