As we said yesterday we were looking for that dip below 190, and we have it already off the open.
Personally I think we can start testing longs very soon, as the bears start pressing their luck and getting greedy. Currently I am waiting for some type of stalling in this selling pressure to start getting back into the market with a long bias. A hold above 189 will be a great start, and a move back above 189.90 will start putting pressure on new shorts.
Obviously with this down move we shouldn’t go buck-wild – keep your stops tight. But I do love buying into this dip down here into support.
Tue Feb 23, 2016 10:41am ESTComments Off on Greed is Good
Hey ya’ll, I’m back and coming in spitting hot fire with an unprecedented vengeance. After vacation last week I came back to an absolute shit-show in ThinkOrSwim and my software was more F’d up than Jeb’s campaign hopes. To make a long story short, in my last post I gave a quick update on the Nikkei. The major key there was holding 1500 while the Spoos held 1800. Both of which happened and we proceeded to stick it to the stubborn bears yet again.
Our target of 1950 was hit yesterday, nothing special there. A simple support/resistance trade for all my old-timer technical analysis fans.
Now we wait.
The big thing I’m seeing EVERYWHERE is that the bears are re-shorting 1950 and the bulls are too scared to hold — like a bad ex-girlfriend, they’re afraid of another spanking.
Currently, I am flat after being short the UVXY for a week or so. The big thing going forward is to be open-minded. IF we go higher, this will be yet ANOTHER hated rally.
It will be low volume, it will be overnight gapping, etc. Basically 2015 all over again. Get rid of your “thoughts” and what your “common sense” tells you, because the market will rip that right out of your brain and leave you begging for crumbs in the back-alley.
Keep an eye on the longer-term time frames (weekly and monthly charts) as the intra-day choppy action will continue around 1900.
March will be an interesting month for the markets, position yourself wisely.
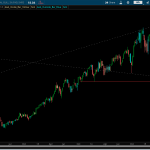
As you can see, yesterday we made an ever-so-slightly higher-high from the 1/13 outside day candle – a prime example of the broadening formation effect, what we preach here. Going forward a gap fill down to 192 wouldn’t be too out of the ordinary, and possibly a decent spot to get back long. Overall we are not at a spot to put too much risk on to the long side, but if you’re building core long positions I’d be buying into these dips. If you’re bullish, be greedy down here into these dips, another hated rally is on the horizon.
Thu Feb 11, 2016 10:24pm ESTComments Off on Nikkei Part Deux
Nikkei is getting crushed yet again, not much more news here. The question going forward is which market is going to buck the trend first, in either direction. Do we get the snap back rally or do we get the panic selling?
We are on the verge of either one, and it’s coming soon.
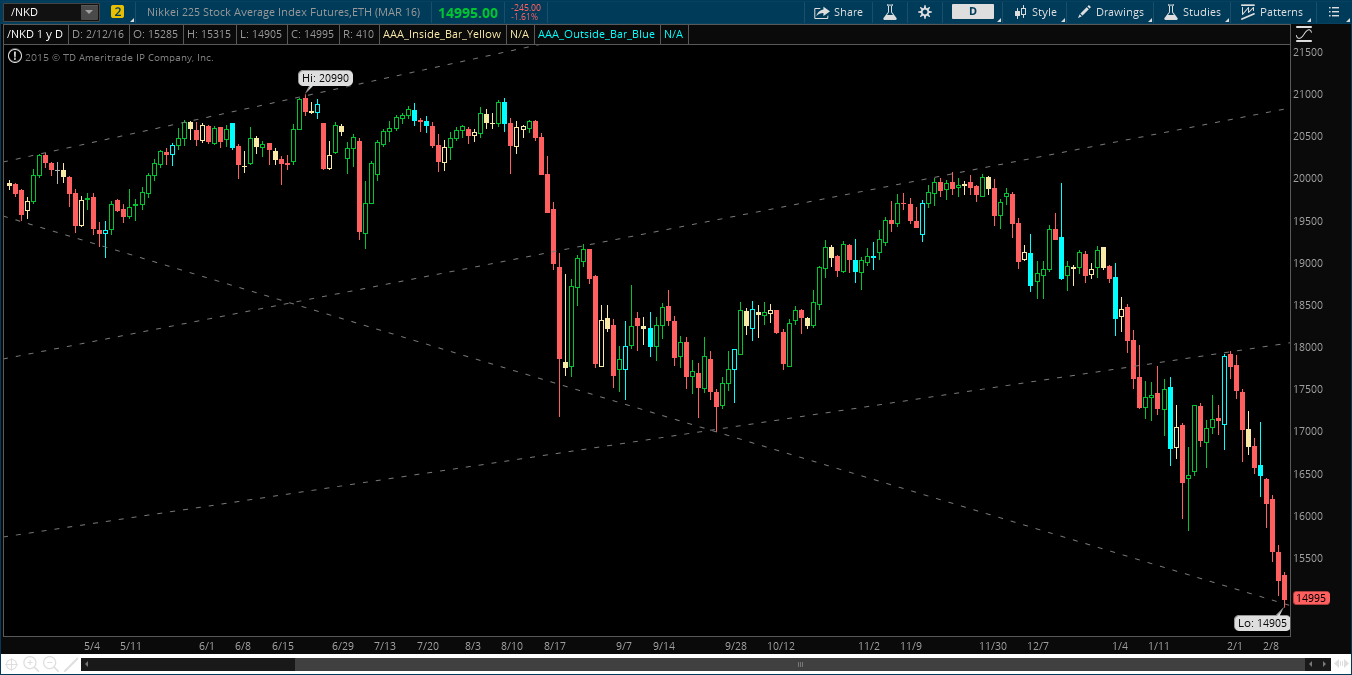
That being said, here’s the chart of the Nikkei:
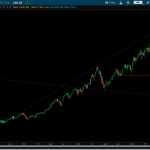
Nikkei Daily Chart
Falling into support down here, I wouldn’t be surprised with a close >15,000.
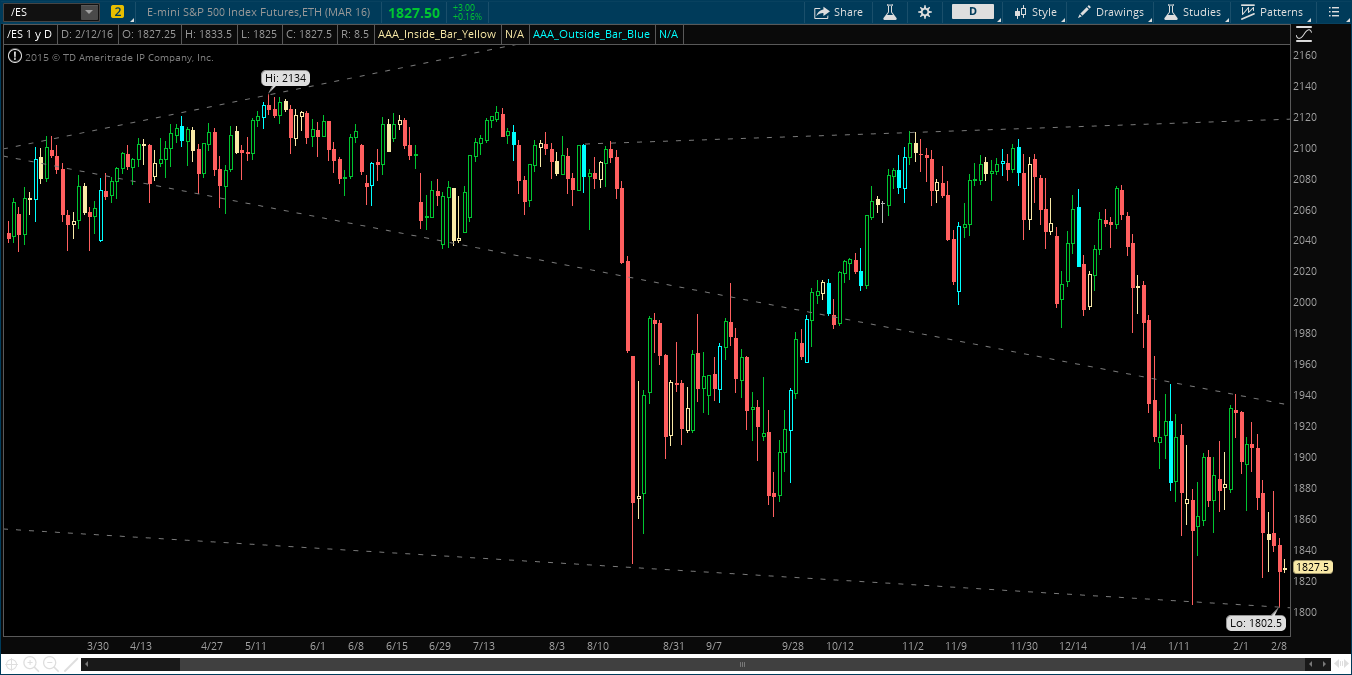
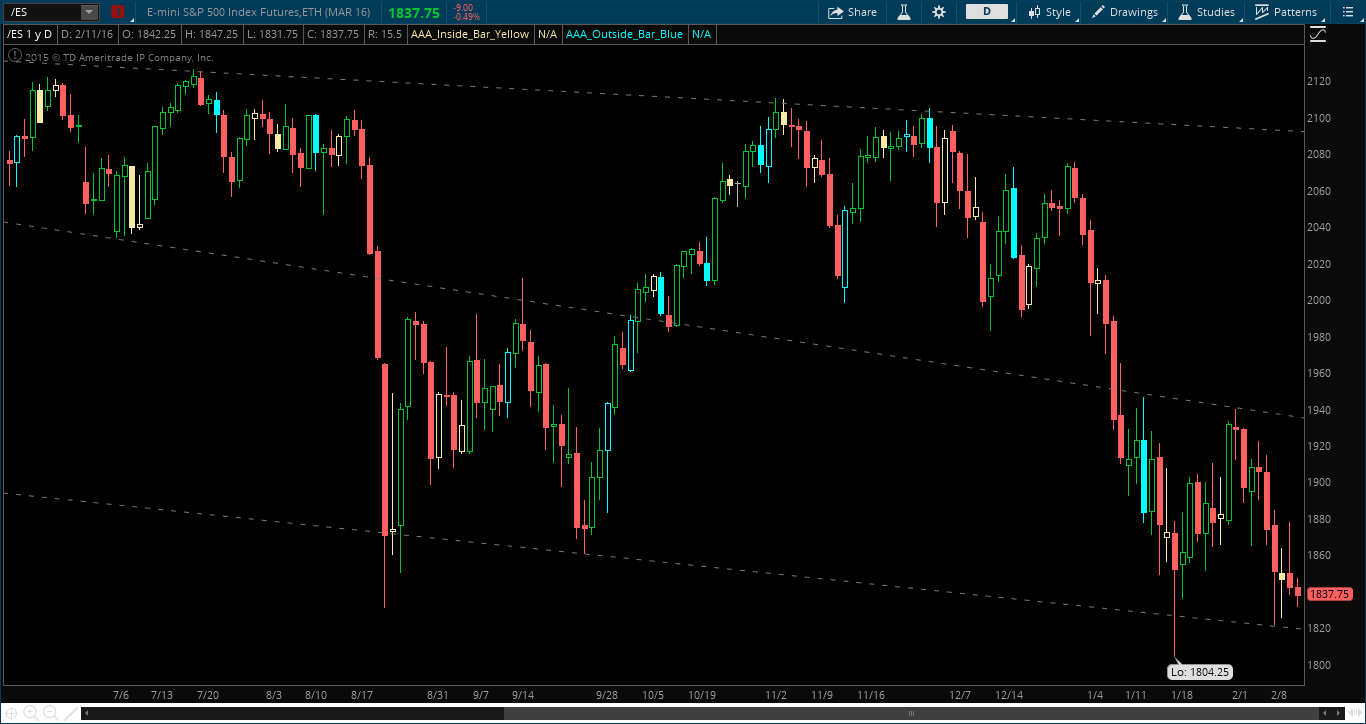
If that does occur, we need to flip to the US Equities markets. ES Futures closed as a daily hammer candle, a potential buy signal if we confirm above 1850. Currently we sit right at 1825 – and the next 25-point move is the one we are looking for.
ES Futures Daily Chart
Sub 1800 will cause some problems, just as a sub 15K collapse will bring the noise in the Nikkei.
The next few sessions will be very important for global markets. Stay tuned.
Two hours after the close, I can’t drink enough Jameson to calm my nerves.
Today’s Play-by-Play:
SPY goes inside-15 and down at 1:15 below 182.30, after a squeamish mid-day rally.
I am GIDDY as all hell at this point, I KNOW we are going lower and I’m pressing so hard short that my fingers are about to fall off.
“There is no chance we don’t see 180 in the SPYs this week, absolutely none. This market is about to get absolutely punished”
We are gliding to the lows of the day, just beautifully; PnL is climbing and I’m happier than a pig in shit.
As we nose dive, I have a thought to myself, “Self, let this one ride, SPY is going to AT LEAST 180 this week. Put the stop at even and go take a break.” I have had a tendency to book profit too early, so, I left the trading desk for a bit. Until my phone decides to give me some nonsense market update:
ALERT: SPY FEB 16 180 P SOLD PHLX ALERT: SPY FEB2 16 182 P SOLD CBOE ALERT: SPY FEB 16 182 P SOLD BOX
“What in the actual shit”
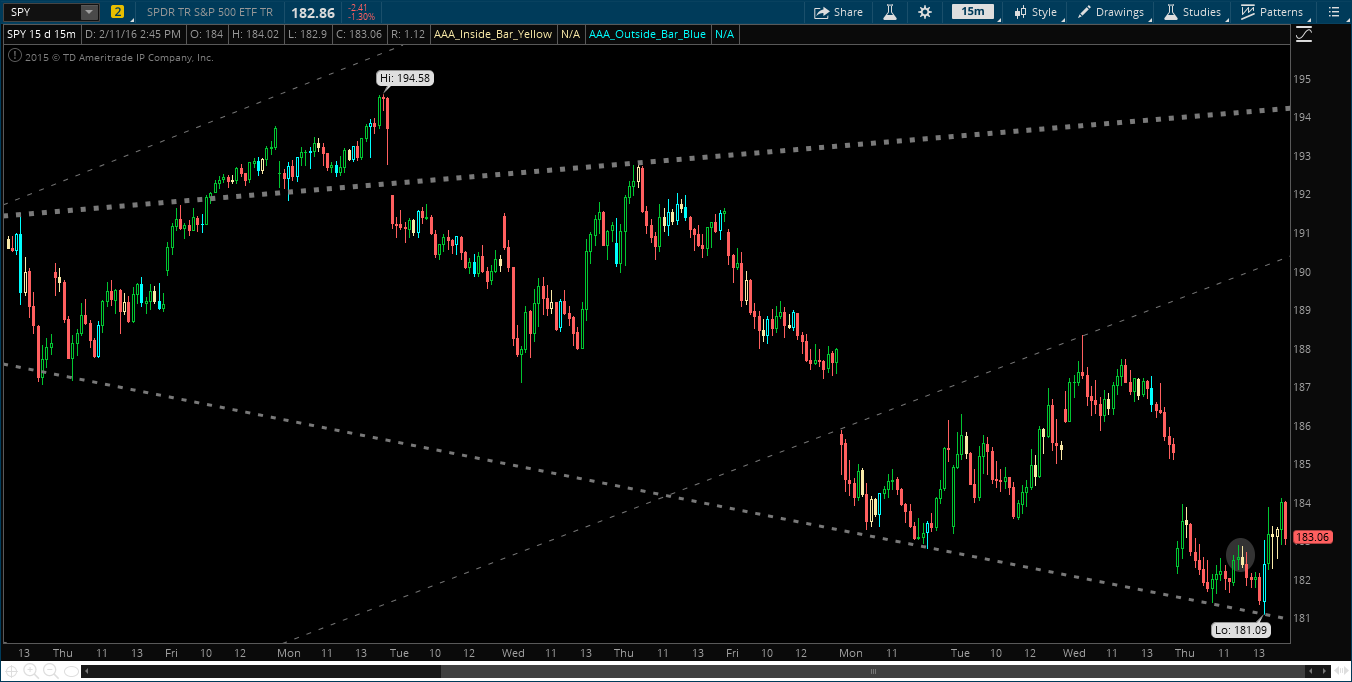
SPY 15-Min Chart
So here I sit, out of no where I’m flat and gave back a mid 4-figure trading day.
Speechless.
The beauty of trading, though, is that you can regroup, take a second and gather your thoughts. As traders, if you don’t have short-term memory loss you might as well just quit now – because stuff like this sucks.
Regardless if the news was real or not, we have back-to-back inside 15-min bars (above) to stop and think.
During this 30-minute break I did just that. See here how we are at the bottom of this broadening formation? What this means to us is that we have already made lower-lows and we have brought even more sellers back into the market, taken a few longs out that had their stops at the low of the day (hey there’s a new one), and possibly potentially exhausting the majority of sellers in the short term.
Further, IF we break this equilibrium to the upside, we are now trading higher than we opened for the day (182.34). So, very safe to say we test longs as we have no resistance up to the high of the day, at 184.
As the story ends and as you can tell, we did, in fact, go back to the highs briefly.
Going forward, the overnight futures are going to play a huge role in where this market goes. If we gap down and take out the lows I think this is the swift kick the bears need to finish them off. However, I am in the camp that the more probable move is a gap fill to back up 185 and a move to 190 next week.
At this point we are still in trading mode until we get more information. Regardless, I think the next day or two will provide a lot of clarity as to where this market wants to go. Still no need to go ape shit either direction.
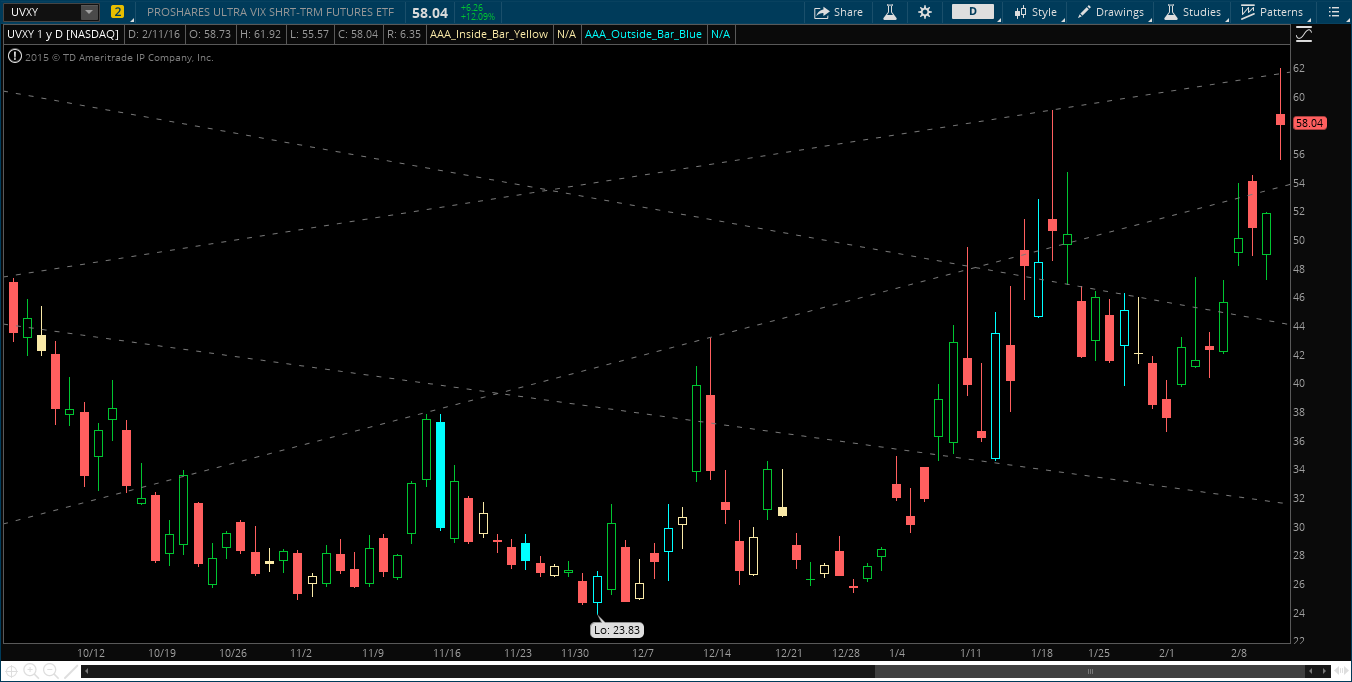
If we do start to bounce, you HAVE to trade the VIX products. UVXY and VXX will get clobbered if we bounce, do yourself a favor and keep an eye on them. I am a fan of UVXY, and will not be surprised if we see this in the low 40s next week. I have already started a short position, and will be adding with lots of size over the coming sessions.
UVXY Daily Chart
I’m off to the pharmacy, I’ve got a prescription to re-fill.
As we posted yesterday, the ES Futures were inside day. The potential move out of this range is very important; as an equilibrium break at this point in the game is the key factor to future price action.
Futures soared beautifully into Janet’s speech pre-market, as we ever so swiftly pushed higher to 1880. As we came off our highs, things seemed normal. Until the afternoon, when all hell broke lose and careened to the lows by the close.
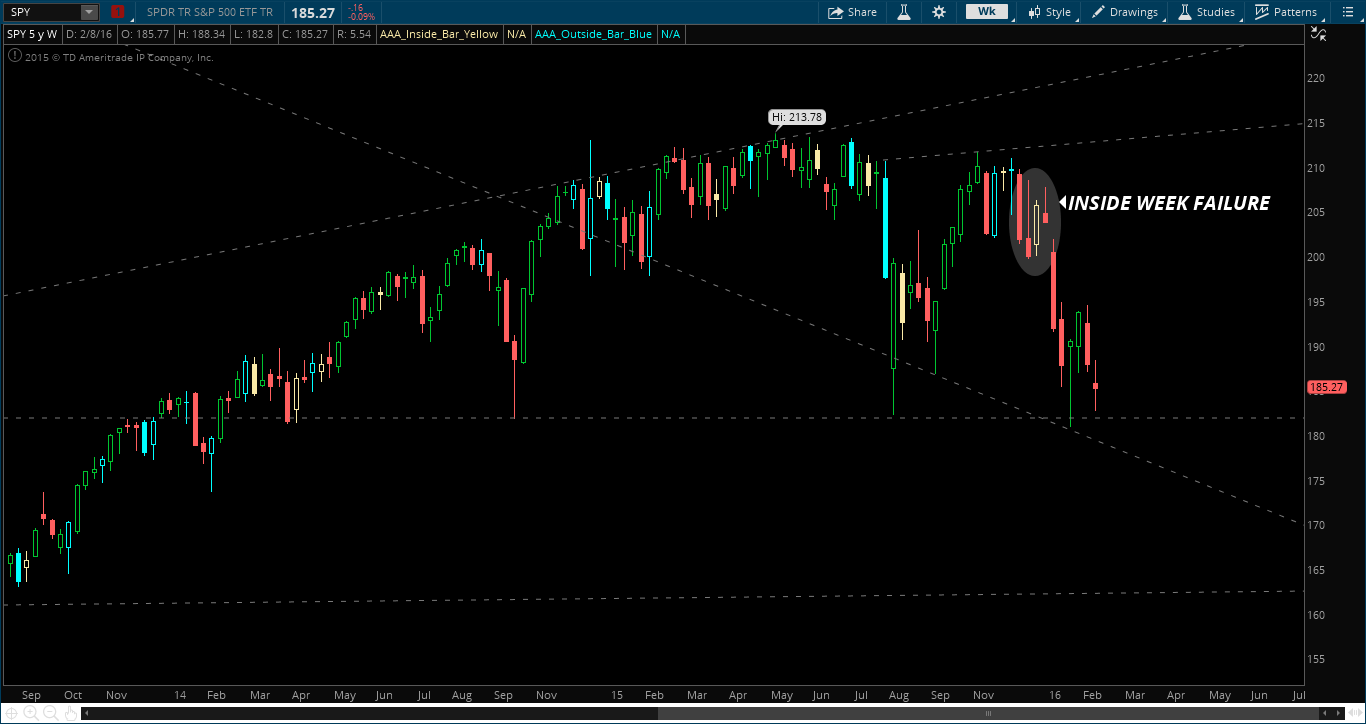
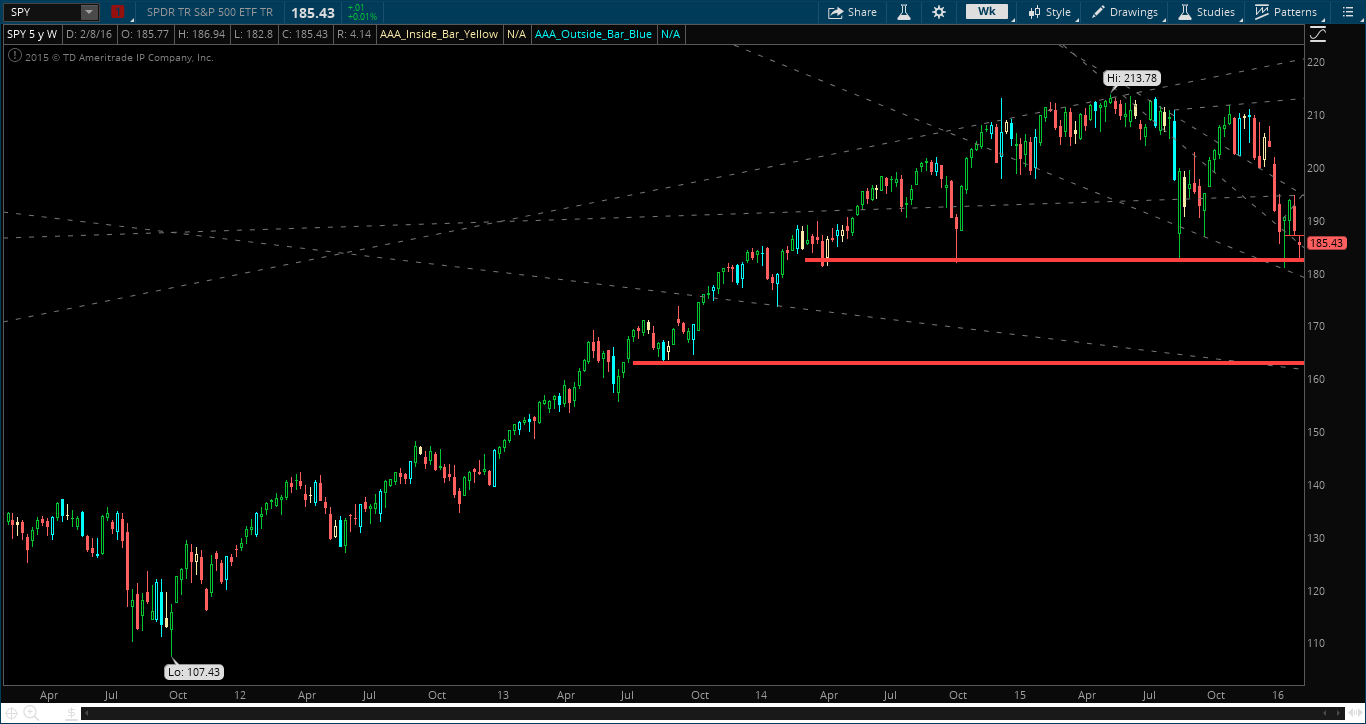
This sets up an inside day failure. A breakout to trap traders long and potentially bring us much lower. This setup has the capability to cause MASSIVE destruction (see the SPY weekly chart at the very bottom).
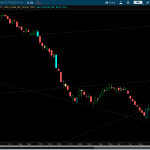
/ES Daily Chart
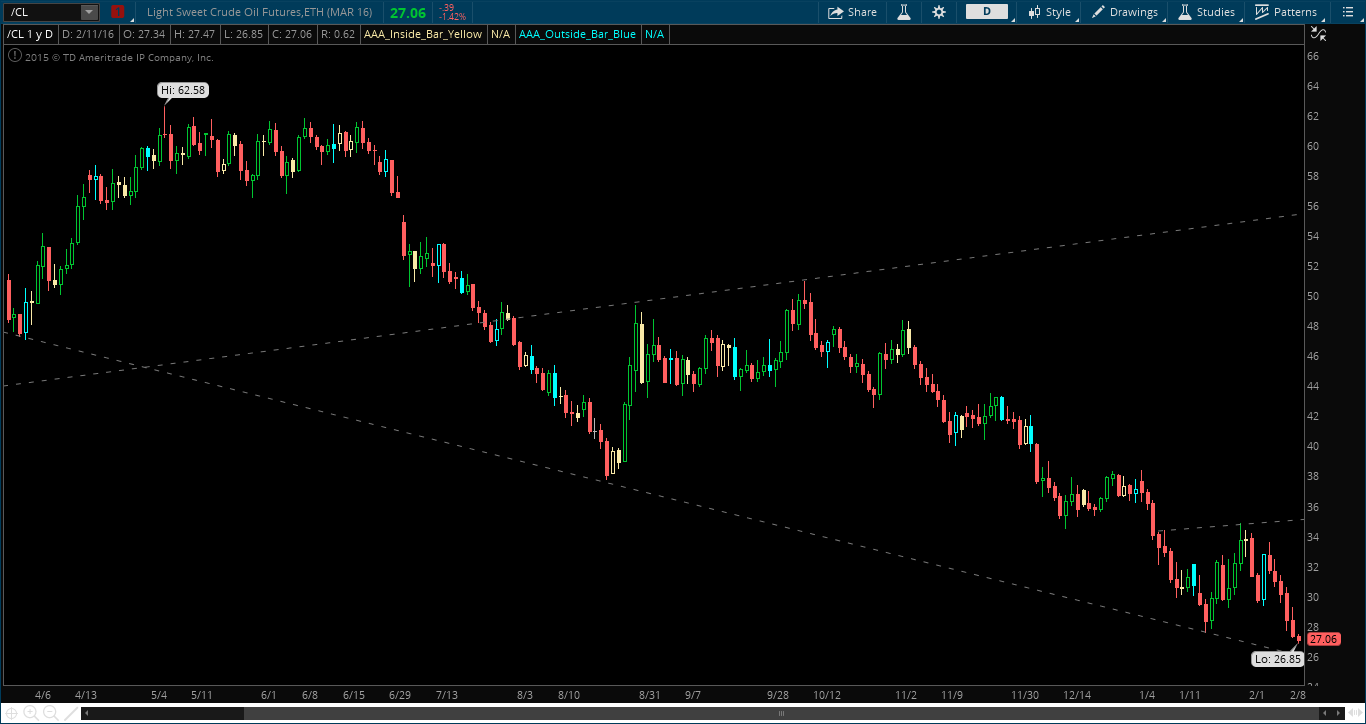
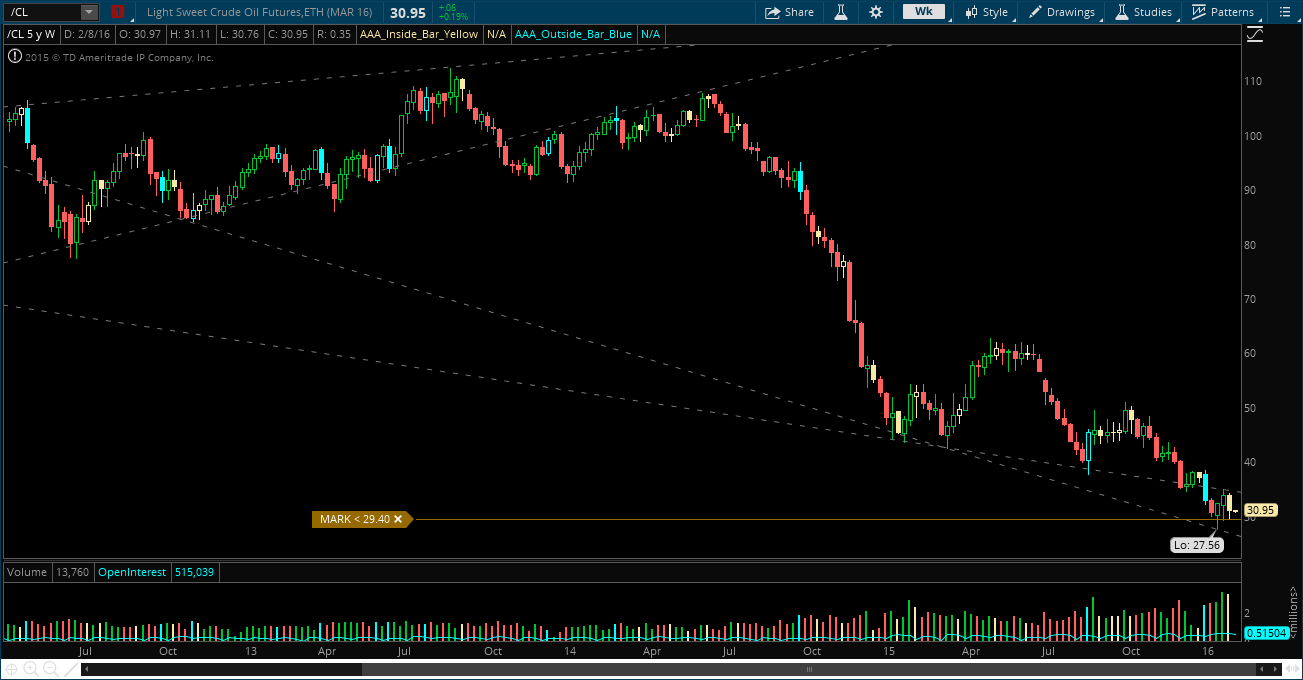
Further, as we posted over the weekend, Oil (yet again) is playing a huge factor in this selling. We went inside week and down below 29.40, and finished today with a shooting-star candle — yet another sell signal.
/CL Daily Chart
If a catastrophe were to happen, something to the likes of a 5% down day in the markets, this would be the epic setup that we would be looking for. Below 1840, then 1825, this market sees epic selling. I currently hold a shit ton of IWM puts and I am long DWTI, bring me more leverage, more volatility, and another fifth of Jack – let’s get this party started.
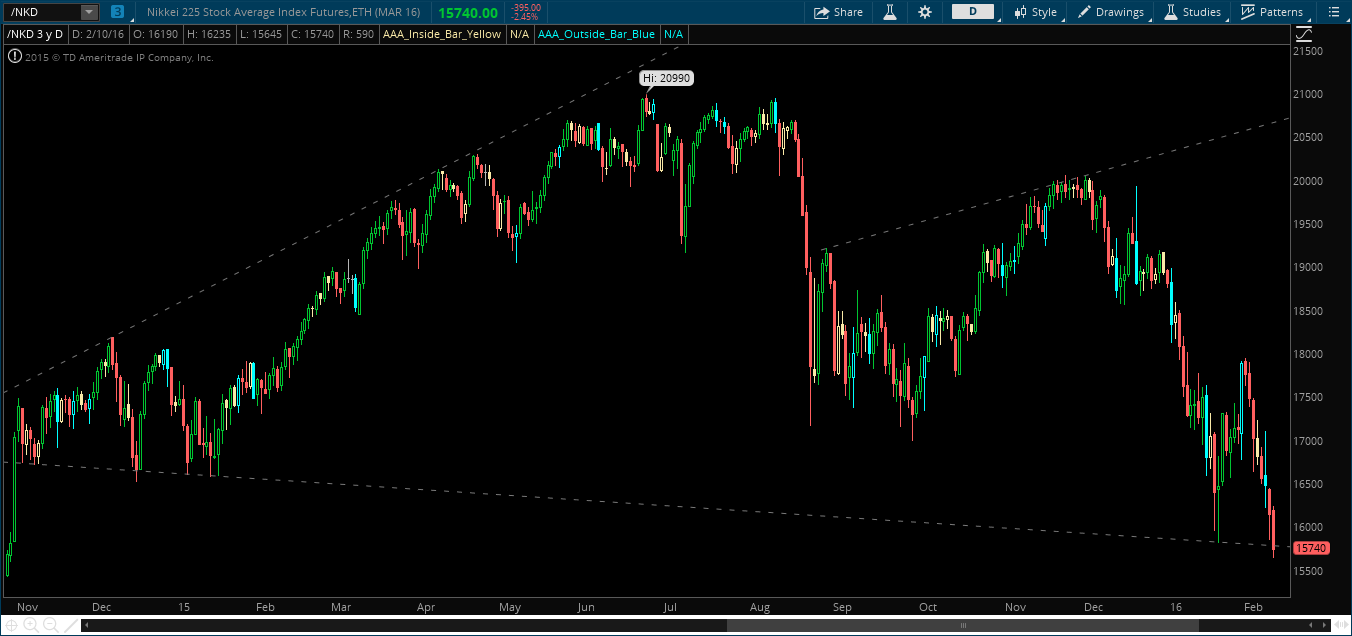
The Nikkei is down another 2.6% as I write this post, and the ES Futures are following suit, down 8 handles so far.
Nikkei Daily Chart
The Nikkei has taken out the January lows as we plunge into no-mans land. Falling into support, the Nikkei is hanging on by a thread here.
The question is not if, it is WHEN and how quickly will we hit 14,000:
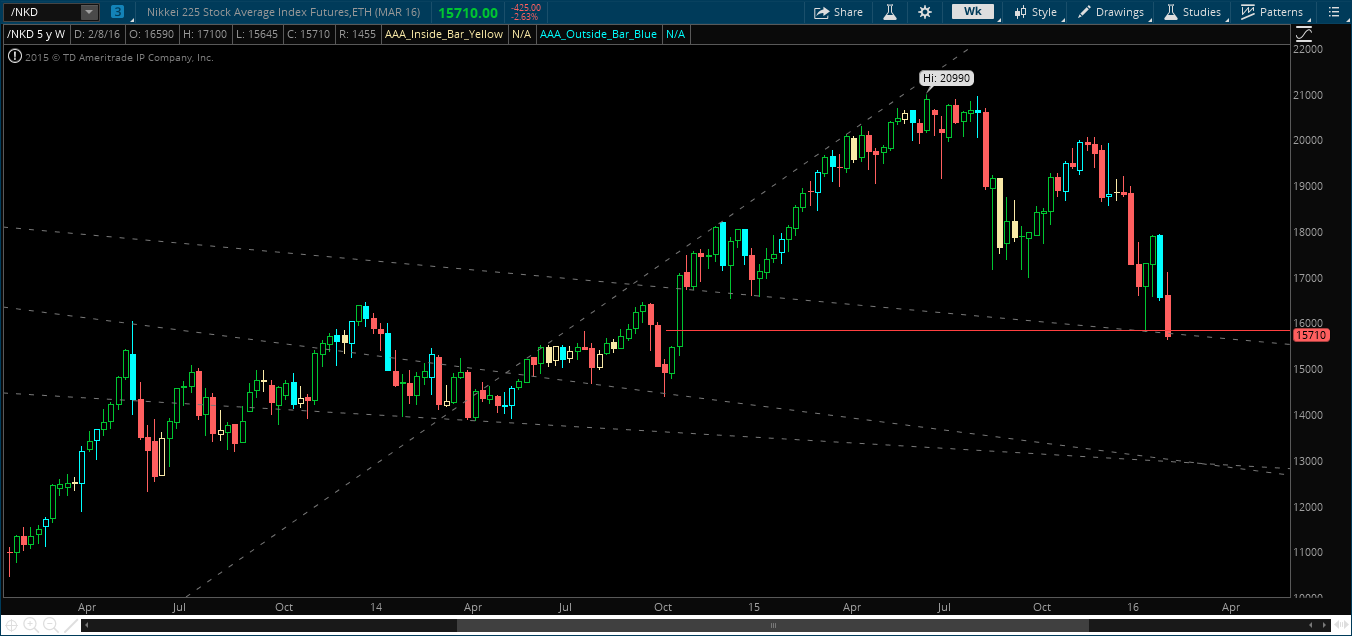
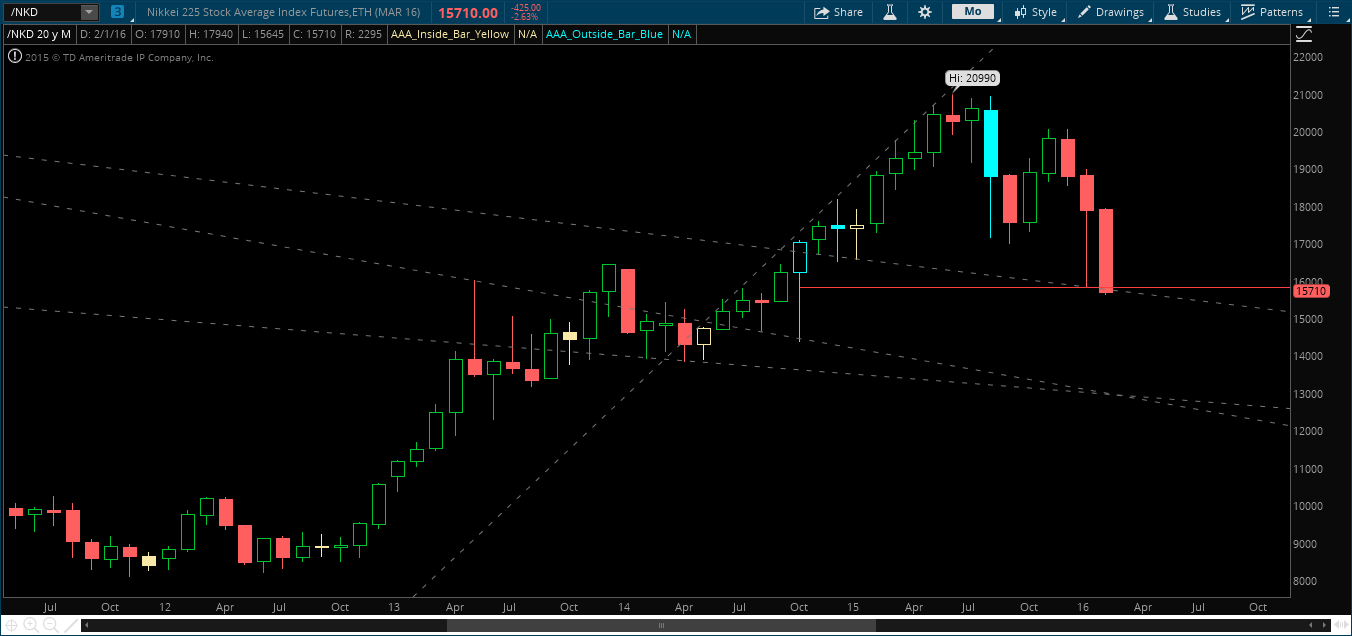
Nikkei Weekly Chart
Nikkei Monthly Chart
As I just posted tonight, US Futures are looking bleaker than Bill Cosby’s future. I see nothing to the long side. Risk/reward is high IF you’re buying down here, and IF we rally. But if the Asian and European markets keep getting pummeled, there is absolutely no way the US Markets will not follow suit. This is something even Queen Janet cannot control. Prepare for carnage.
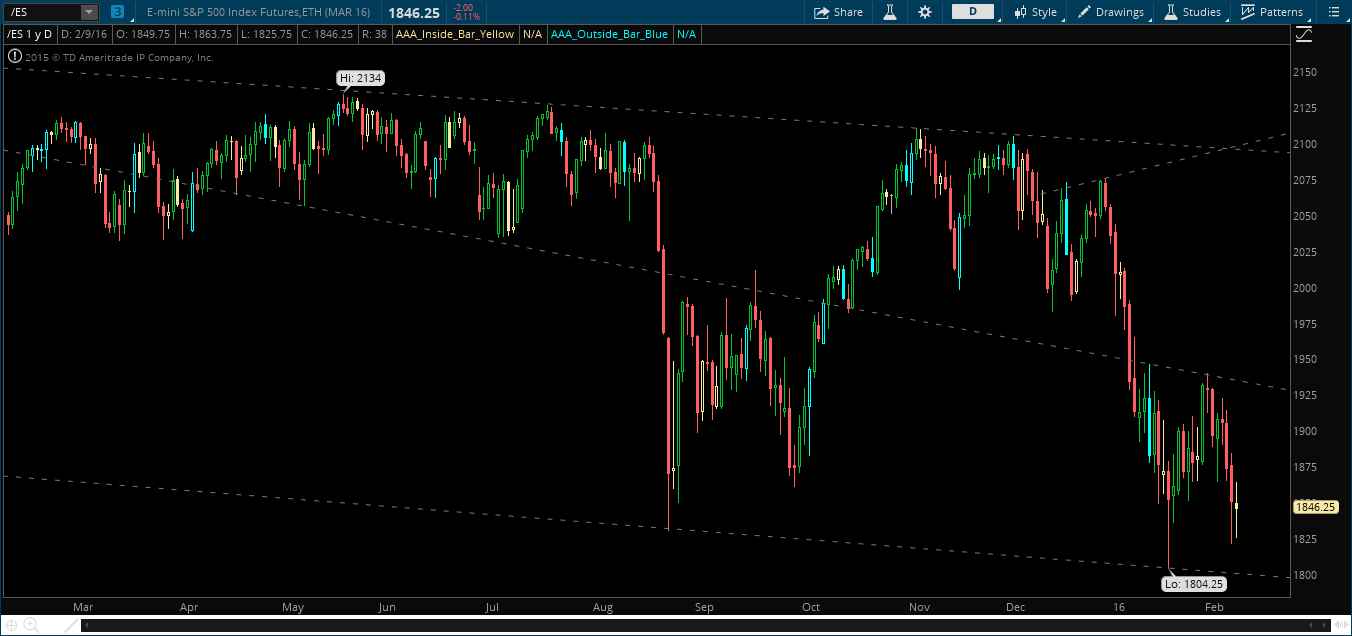
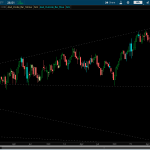
To start, the ES Futures are inside day today and it is something you need to know about. If we break higher, we are green on the day and the week, a small positive as we’ve seen relentless selling on any rally. And believe me, I want us to go higher — a short-covering rally will pay very well. If we break lower, we have full time frame continuity to the downside and we have the green light to press shorts. Below 1825 we start to get heavy VERY quickly. As I’ve said for weeks now, the February lows are VERY important.
ES Daily Chart
Tomorrow we also have the oil number in the morning, and seeing as we have already taken the inside week to downside, this could just add to the drubbing that we’ve seen this year.
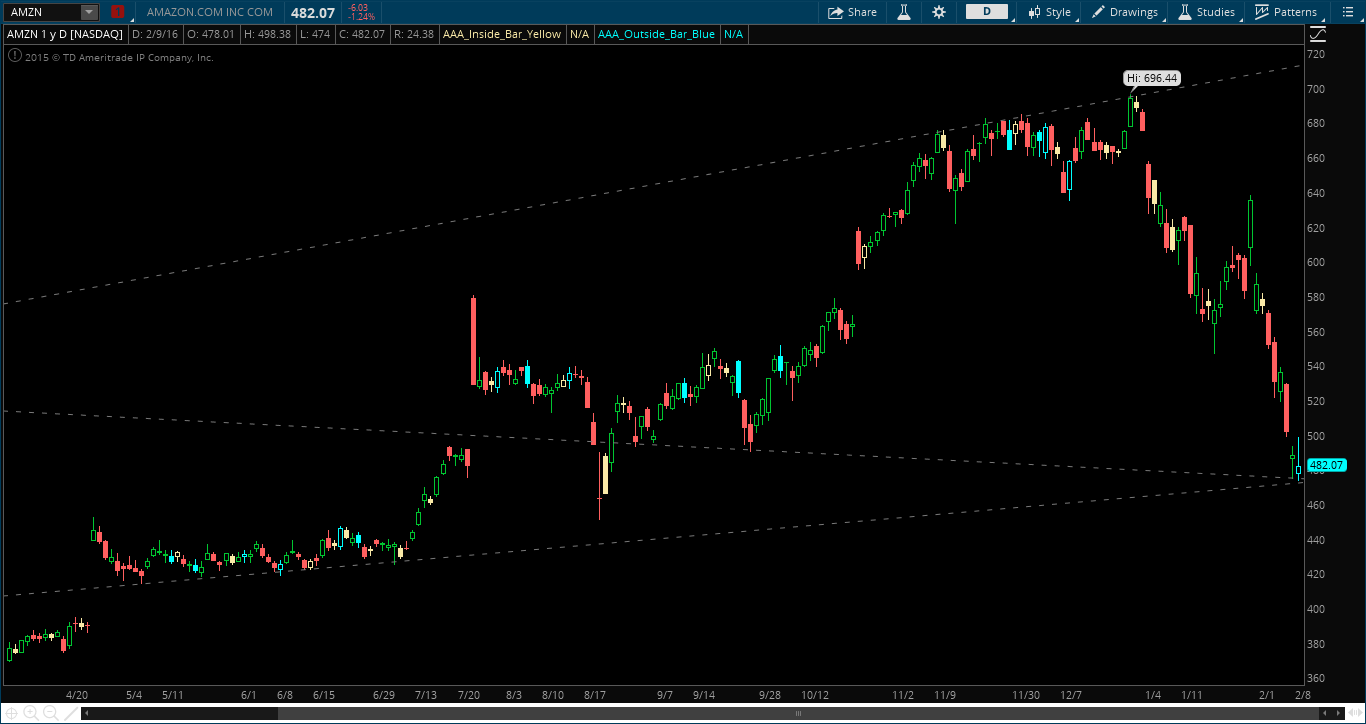
If we delve into the internals, it just gets worse. All high beta stocks closed well of their intra-day highs, putting in shooting-star candles on the daily charts. Yes it’s only one day, one afternoon sell-off. But it makes for holding positions overnight a complete crap-shoot.
AMZN Daily Chart
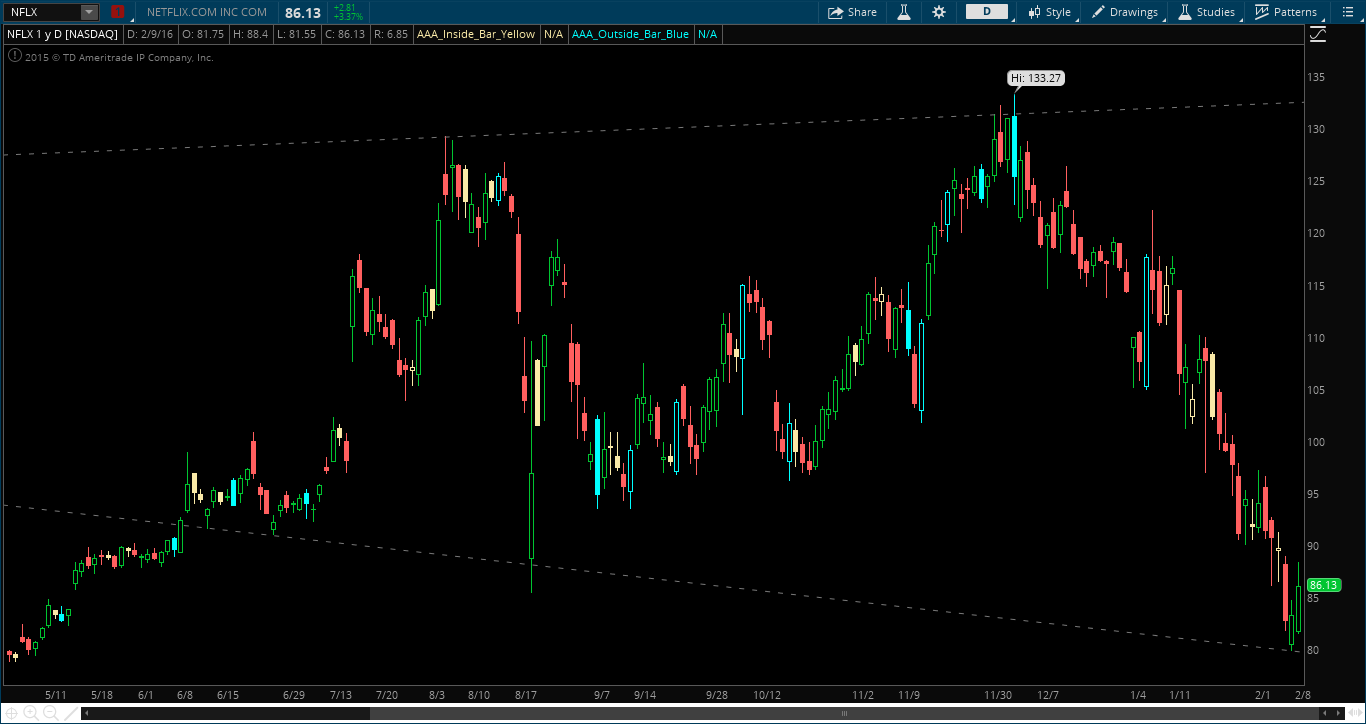
NFLX Daily Chart
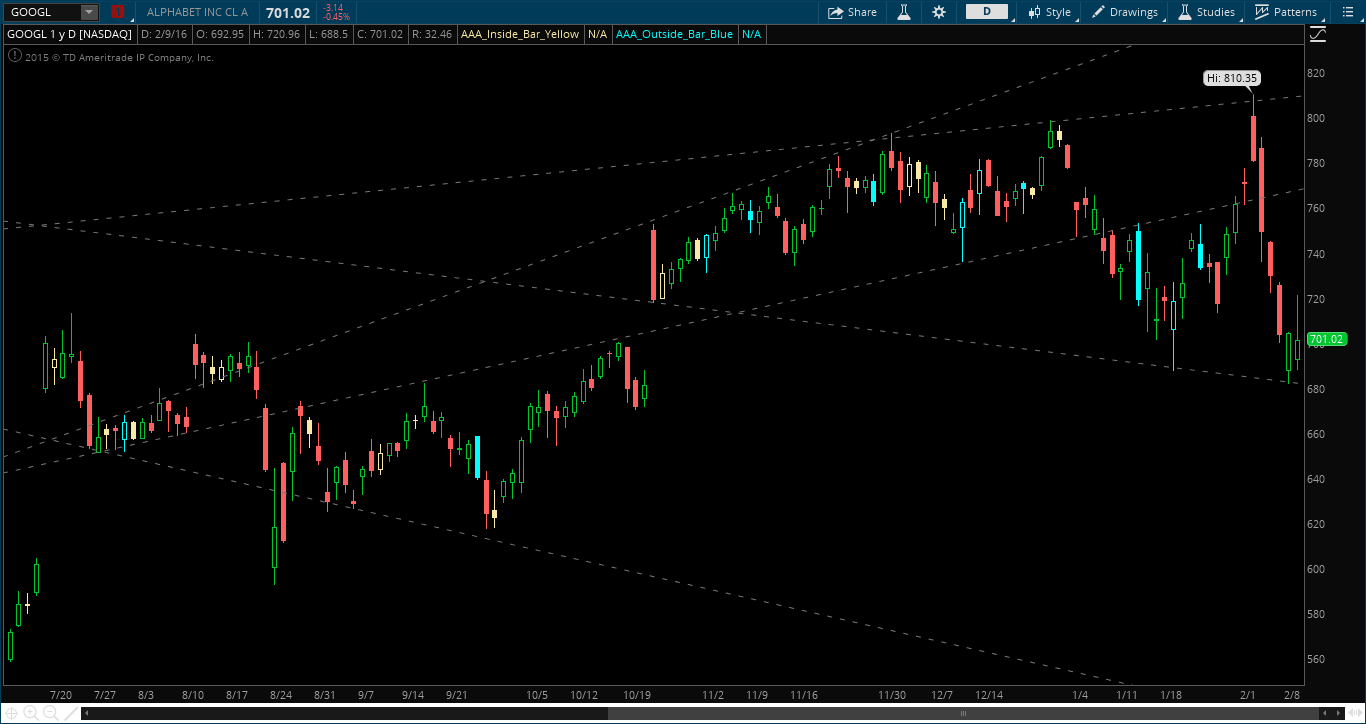
GOOGL Daily Chart
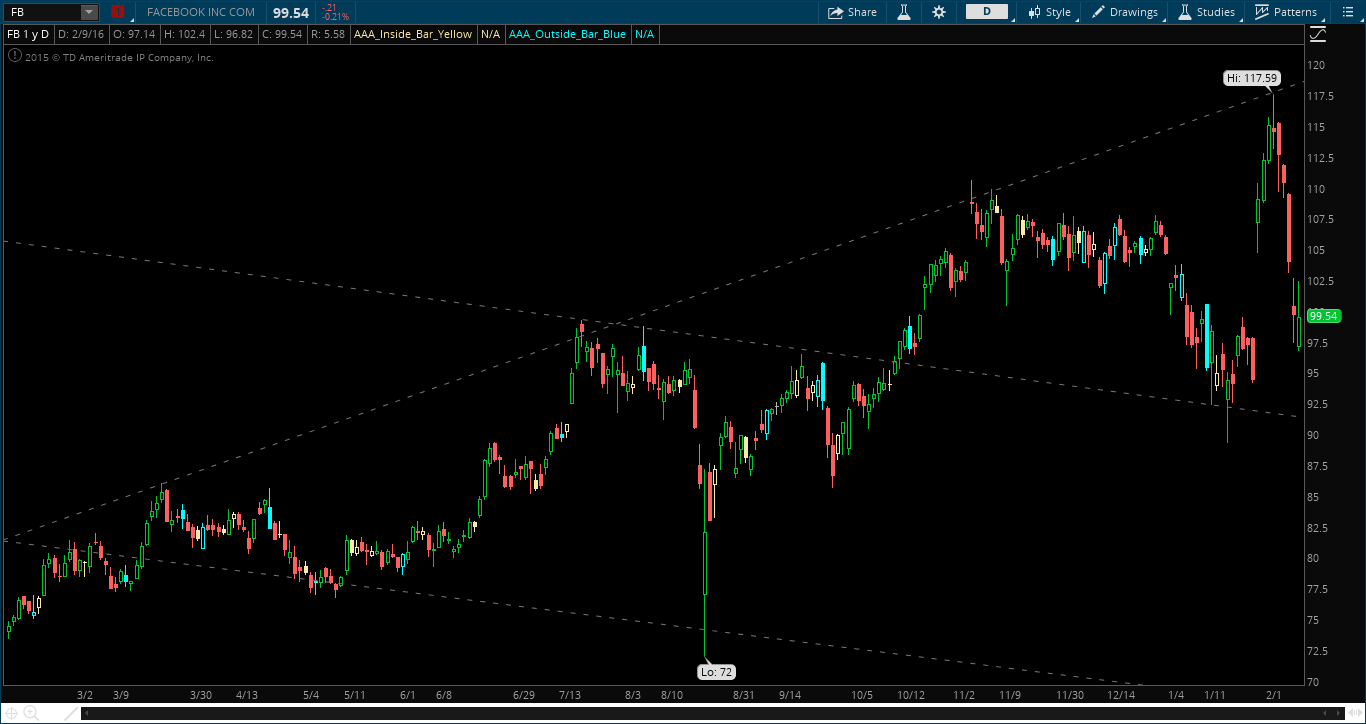
FB Daily Chart
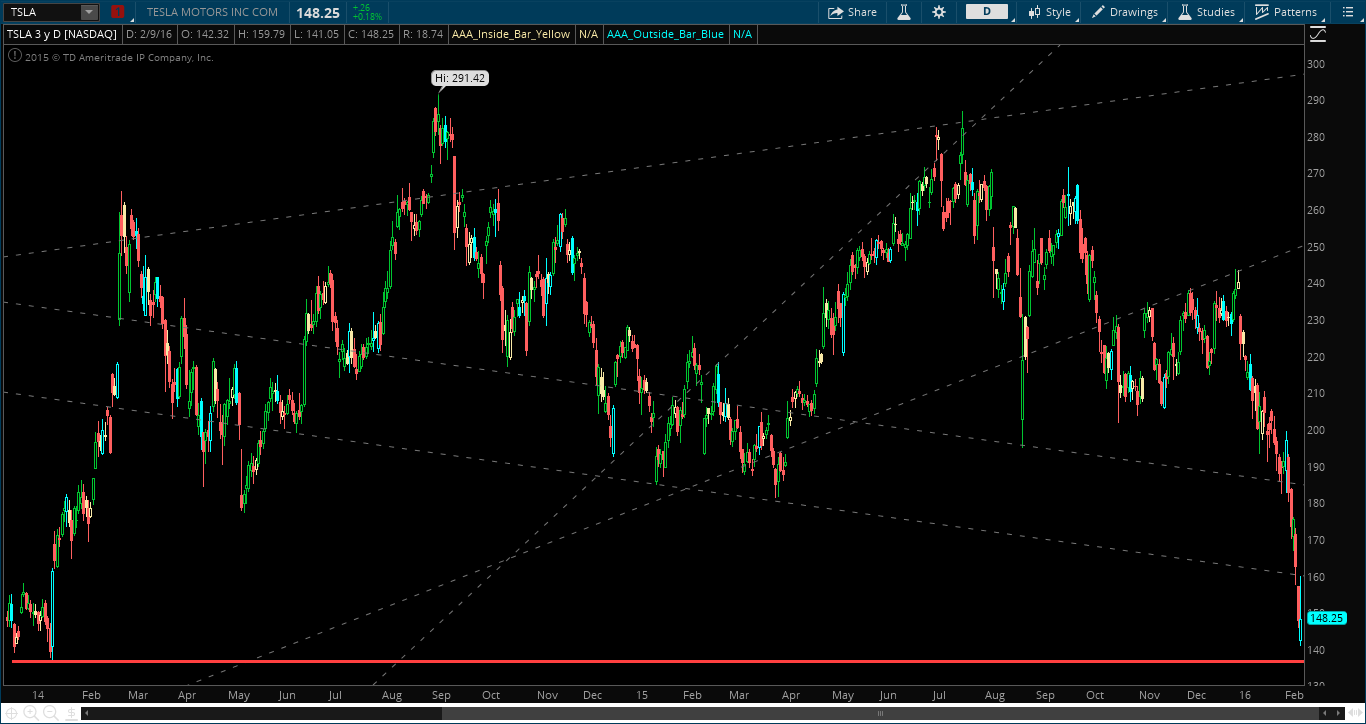
TSLA Daily Chart
If we look at the major sectors, absolutely nothing looks compelling. These charts are garbage. Even more, we are seeing the Utilities even starting to lag. If they stall out, this will be a “baby with the bathwater” sell-off in the coming weeks. Transports are hanging in there, but no reason to buy anything. Biotech’s are trying to hold on to support, but we have no evidence that will hold. FAS Financials just look like they are waiting for a reason to get annihilated, and another break below the 18 level might do the trick.
FAS Weekly Chart
IBB Weekly Chart
USO Weekly Chart
XHB Weekly Chart
XLI Weekly Chart
XLU Weekly Chart
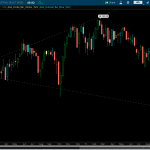
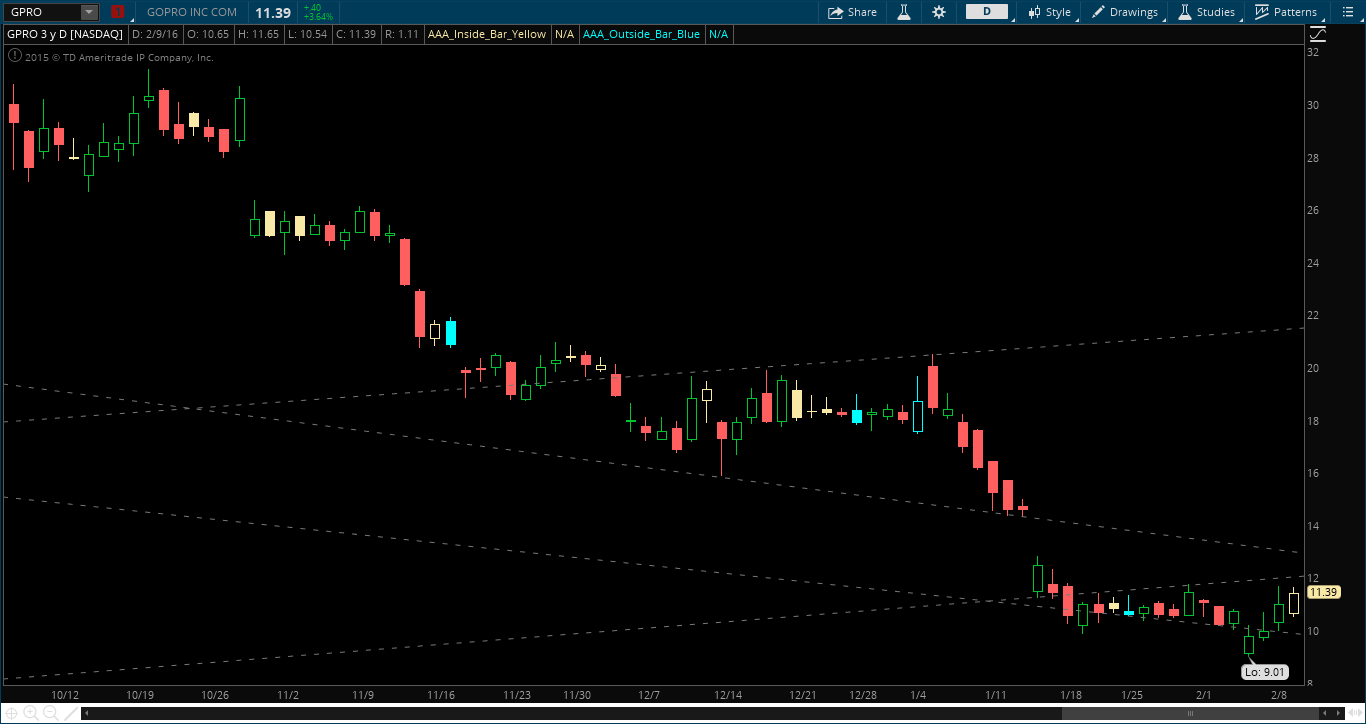
You know this market sucks when one of the the charts that I actually may trade long is GPRO:
GPRO Daily Chart
I’m not trying to be the bearer of bad news, but if you look at some of these weekly charts, it really looks like the recent sell-off in the last month or two is only HALF of the move to come. If we don’t bounce soon (calling on you Janet), the shorties may really be licking their chops. After all, time frame continuity tells us that we are lower than we opened on ALL time frames. If we were to sell-off, this would be the case when it would happen. Short-term advice, keep things small to the long side – every rip has been sold. We may bounce over the coming weeks, but all in all it looks like it would just be setting us up for the wipe out move down to 160 in the SPYs eventually.
Mon Feb 8, 2016 4:04pm ESTComments Off on Can We Buy Yet?
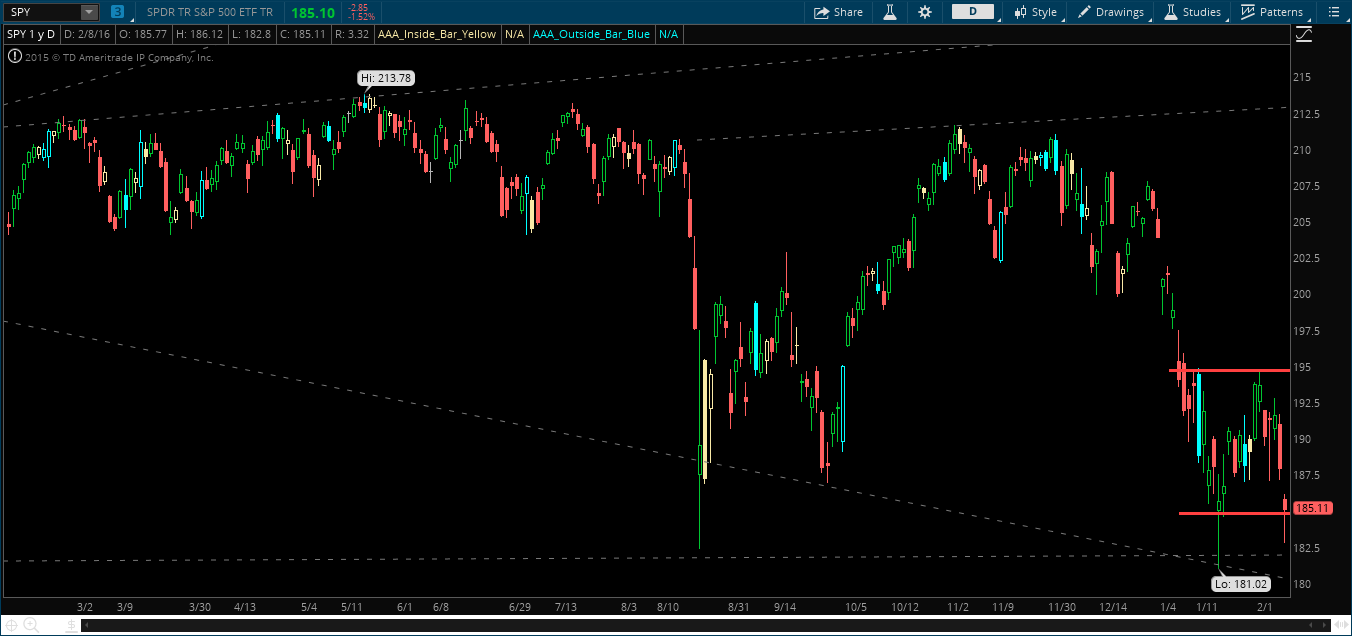
The market is in a range-bound mess and it’s killing traders.
SPY Daily Chart
But why?
Well, for starters most (shitty) traders are trying to buy the breakout move.
Newflash: in a range-bound market, you better be buying the low-end of the range, otherwise you’re the guy top-ticking any rally.
Granted, we may expand this range to the downside. But our risk/reward into today wasn’t worth pressing short.
That being said, is it time to buy??
As I posted over the weekend, we have to keep our eyes on Oil and Gold.
So far, Oil took out last weeks lows and popped back into the range, so the jury is still out. Gold hit our high end target of 114, so safe to see we may see a pull back here — does that mean equities can rally? Possibly.
With the daily hammer candle in SPY this could be the first signal to start testing longs. IBB has hit our low end target of 245 today, so a bounce is possible. FAS and the banks briefly tagged the 17 handle, taking out the February lows momentarily and limped higher into the close. The transports actually closed higher than we opened today, a positive sign into the rest of the week.
All in all I think it’s safe to put risk on the long side, keep your stops tight. If you’re right and we do rally back to the top end of the range (195), you’ll be the one making it rain this weekend.
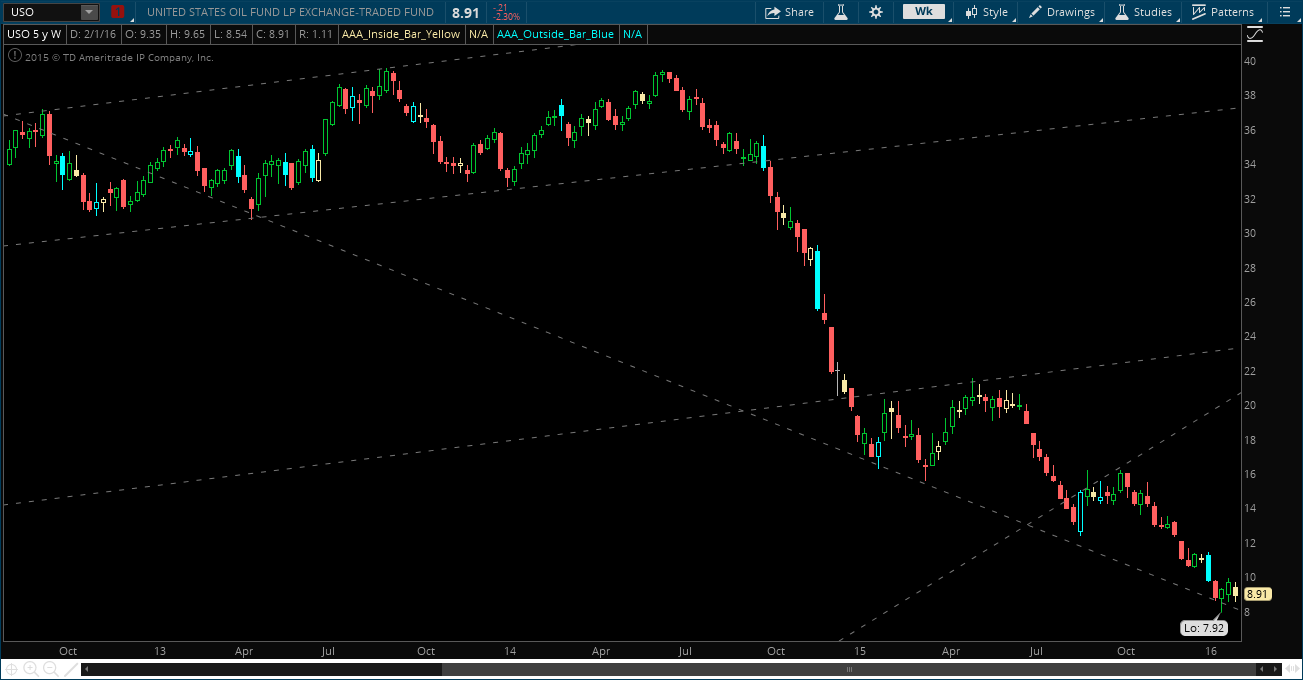
We had an inside week in the oil patch last week, and you better be watching USO and its derivatives come Monday.
USO Weekly Chart
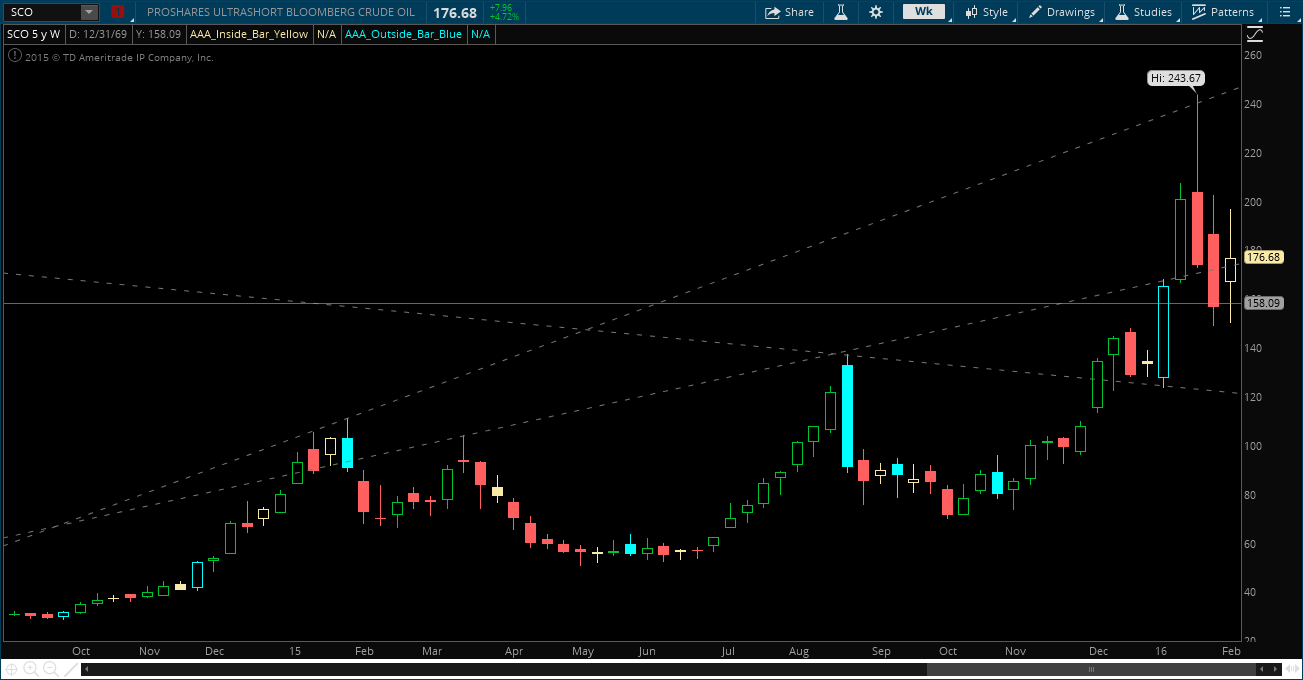
As we know, inside bars represent an equilibrium and we want to see this break next week. A break above last weeks highs we have a long bias, and the break below we are obviously short. If we do break below (and stay below) 8.54 for USO I would definitely get in an trade SCO and DWTI to the long side. Highly volatile but amazing trading vehicles in this oil decline. SCO is the 2x inverse and has options, as does UCO the 2x-leveraged long derivative.
SCO Weekly Chart
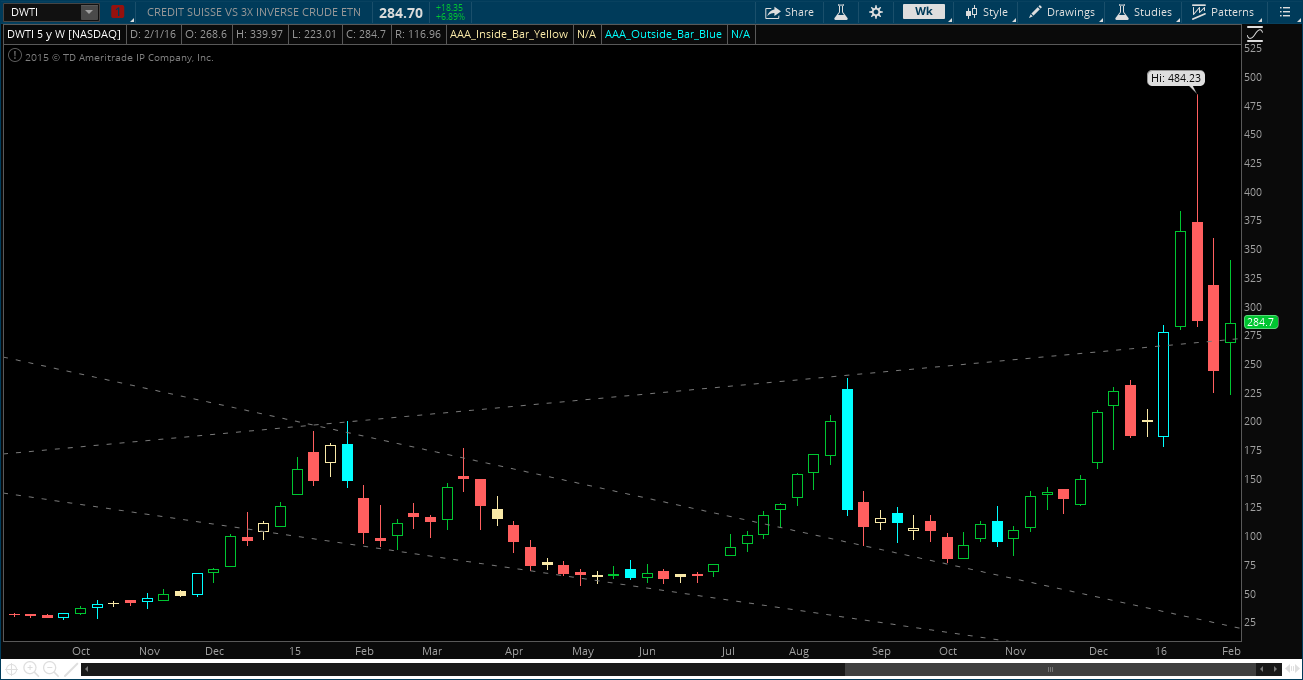
DWTI Weekly Chart
If we look at the Crude Futures, 29.40 is key support for Crude heading into next week.