Markets have been ever-so-gloriously getting KILLED and it has been epic.
Now we wait.
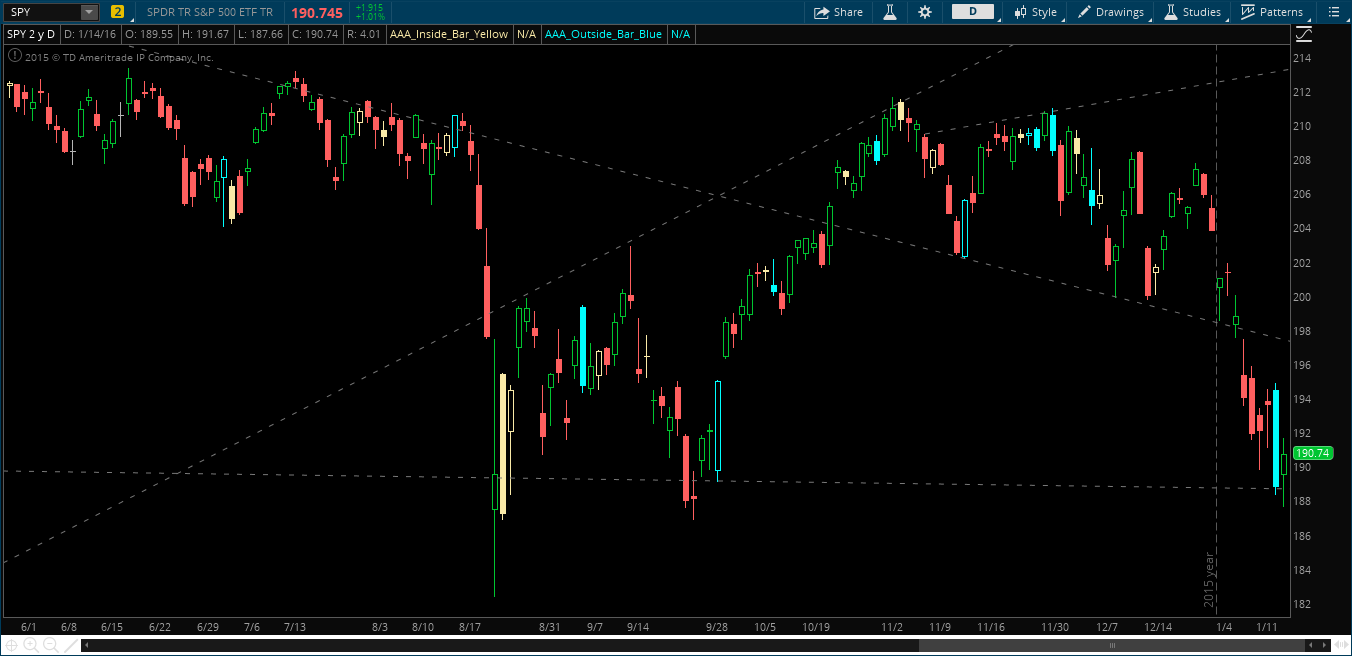
Is 188 in the SPYs the line in the sand and we bounce from here? The jury is still out on that. Time frame continuity says we are red on all time frames (except the daily chart from today). IF we hold today’s lows, it would seem like a bounce to 198-200 is in the cards for next week. We did test a small long position this morning with the SPY 190 C for next week, a bounce seems overdue here.
It’s almost clear that we are waiting on the commodities to stabilize to see if it is liquidation of all asset classes going forward.
Take a look at Crude – inside day into support. Inside days represent equilibrium, a pause in selling in this case. Is the trend going to continue and we just destroy the oil patch? Or are we going to get some buyers into this level and a possible reversal? I’d watch this going forward, as it may be the key to this market bounce.

If you enjoy the content at iBankCoin, please follow us on Twitter