I noticed the traffic on Gold related instruments was relatively high yesterday. Lots of players were looking for a technical bounce in the metals to play.
I haven’t blogged on the topic since July 7th, but looking back…not sure that timing could have been much better.
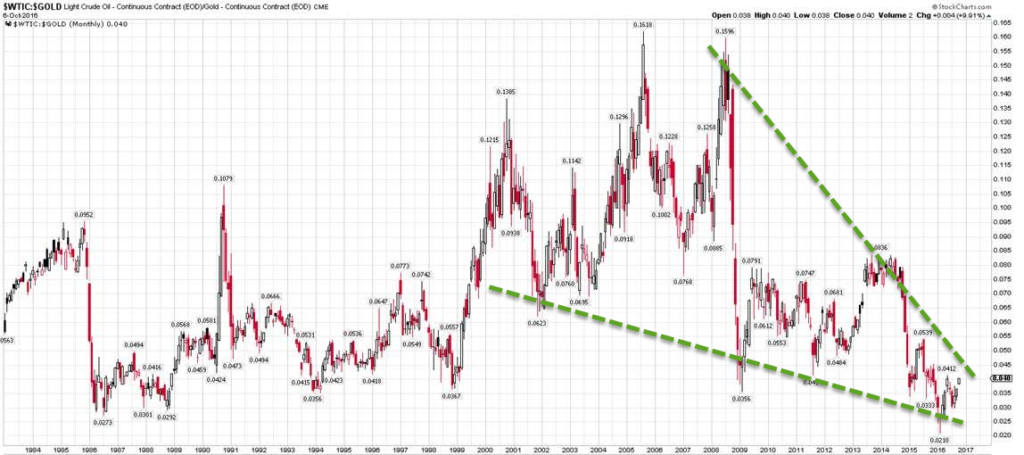
In my last Boot Camp, we spent an entire evening focused on Gold and Silver. One chart we spent a bit of time on was the $GOLD:$WTIC spread, which topped it’s most extreme value earlier this year.
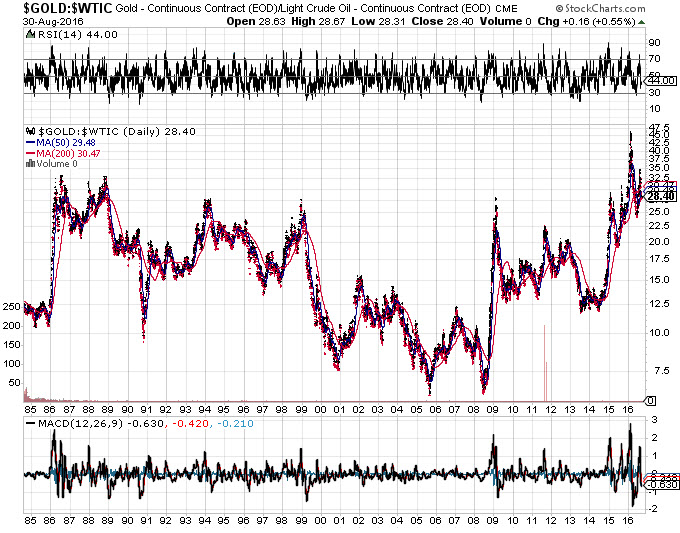 This chart suggests that earlier this year, you could have bought 47 barrels of oil with an ounce of gold. The longer term average of this spread is more like 15.
Off of this analysis I told folks to short gold against an oil long. How has that trade been working recently?
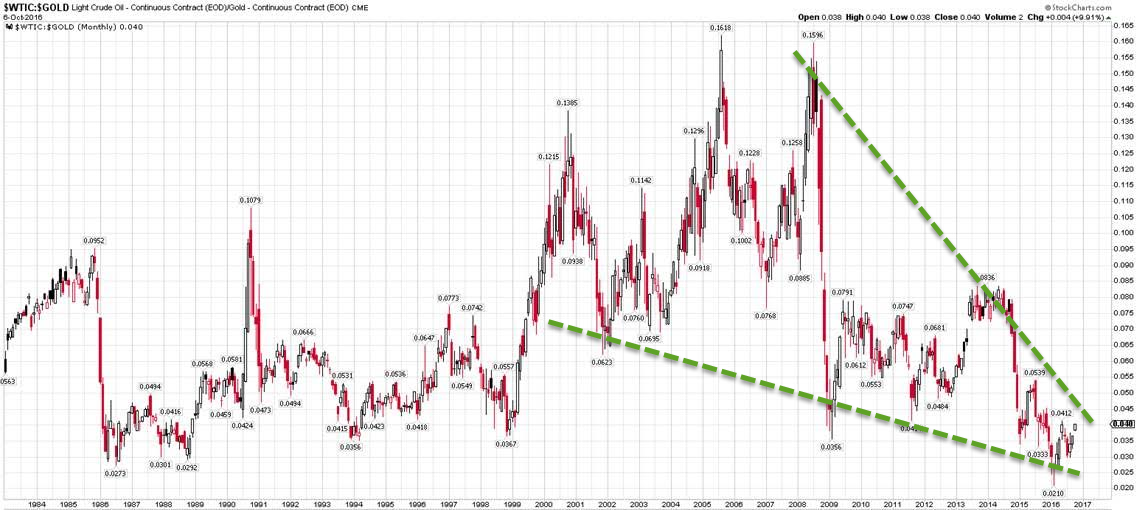
If you flip the spread here (hat tip @bcanals) this looks like tip of the iceberg movement…
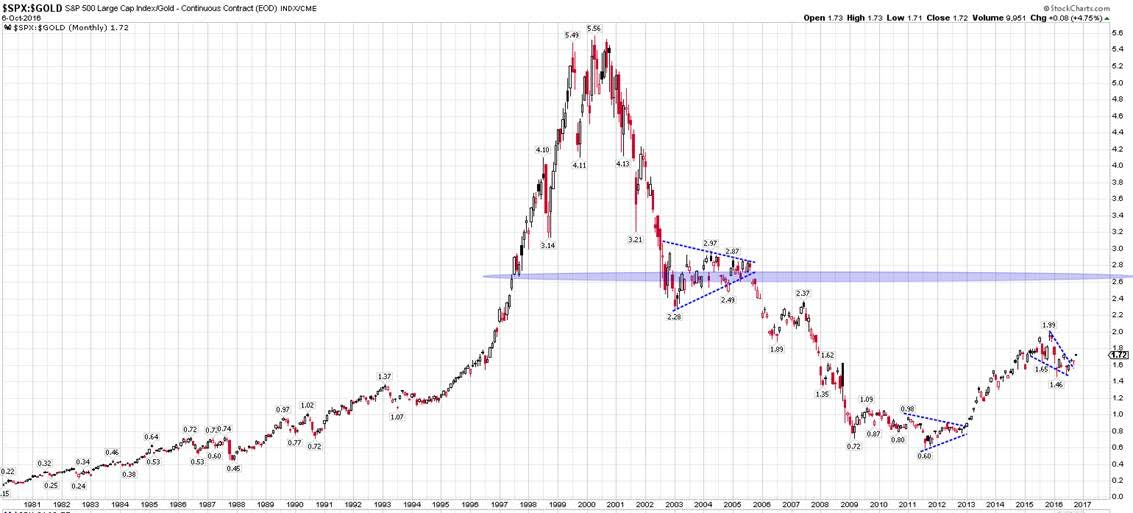
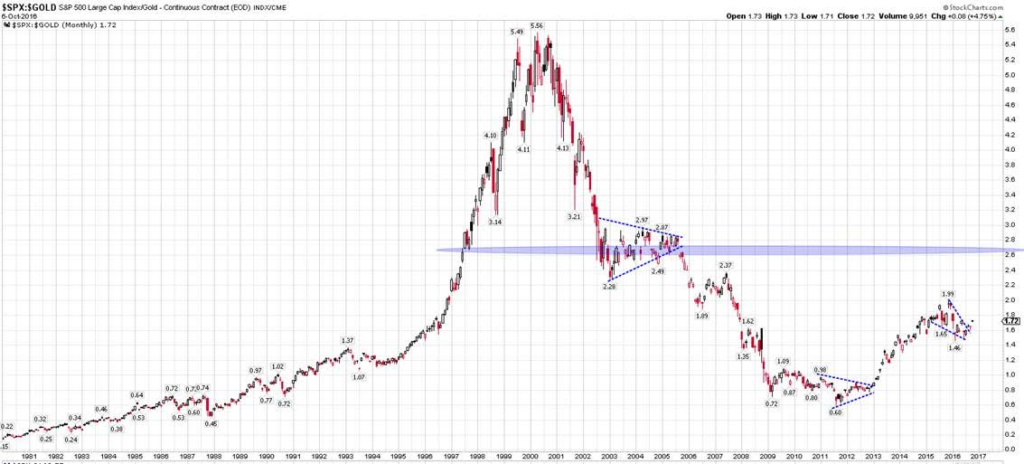
 He also pointed out the following chart, which is $SPX:$GOLD ratio. Looks like my sentiment chart, no?
 Been thinking about these since last night. Very intriguing especially after the popularity of these instruments yesterday.
Comments »