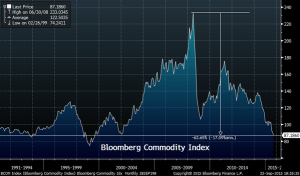
This chart is a little dated, and I am away from a Bloom spot today, but I had a request to speak on commodity prices, so let’s start with this graph below of the Bloomberg Commodity Index. Mostly made up of Nat Gas, Oil, Corn, Copper, and Gold, and is currently trading at $82, despite what the chart below shows.
I’m of the opinion that we’re heading into an era of ‘lower for longer’ commodity prices. A lot of people write on this topic and the negative impacts it could/should have, but not many talk about the stimulative impact it has on the economy.
The chart above illustrates a boom in the commodity index, and the bubble bust. All in all, it’s a return back to a historical mean. If I were near a terminal, I’d take this chart out another few decades to show the cycles in volatility across commodity prices, which I believe is due for a rally soon, but also due for some quiet time.
I also wanted to point out that while we’ve spent so much time looking at 1998 from a historical perspective in terms of oil prices, gold prices, copper prices, the dollar, and other individual commodity price correlation, this index bottomed in early 1999, which I believe is also the bottom for this bear cycle in commodity prices as well.
I think there are some screaming investments in commodity related equities down here at these prices, but I think the volatility in commodity prices themselves will be all but gone over the next 3-5 years. There will be a great move in the commodity index early next year, but that first rally will be the best opportunity for the year in my humble opinion.
I have been thinking up a list of investments in this space, but haven’t yet finalized it. What are some of your top ideas with a 3-5 year time frame?
Comments »