iBankCoin
Home / Tag Archives: #CFAInvest (page 2)

Tag Archives: #CFAInvest

NINTENDO $NTDOY- MOBILE, THE SECOND COMING

Pokemon Go, get used to hearing a lot more about it.

Thus far the limited release, including the all critical USA market, has been record setting.

12205311_14686323133805_rId5

From a trading perspective, the pin action has been awe inspiring, but without the wide trading ranges one would expect of daily double digit gains in the stock price of Nintendo. Buys have been exceeding sells by a factor of 7:1 on some platforms over the last week. Lower left to upper right as Gartman would phrase it. Nintendo officially has game, mobile game.

The global roll out of Pokemon Go is underway. I’m reporting from Japan, home of Nintendo (ticker 7974 on the Tokyo Stock Exchange), where fans can’t wait to get access to the app and begin their frolicking. The Japan roll out appears to have been set coincident with the end of the rainy season in Japan. As an outdoor “augmented reality” experience, Pokemon Go is best launched without torrential rainfall, hence I expect a release date the last week of July. The rain spigot ceases like clockwork around the 20th of July in Japan. Expect take up rates on app downloads, usage, paid users, $1 pokeball sales and overall hype to pierce the giddy precedent set by the US market.

The opportunities for Nintendo to exploit their extensive catalogue of intellectual property is immense. Pokemon, developed in 1995 by Satoshi Tajiri was already raking in $2bln in revenue per annum for Nintendo. Generations of gamers know the sketch, keeping advertising cost down and hence margins high. Others have pointed to the immense retail deals that could result with global franchises keen to build a stable of pokemonsters to drive traffic and resulting $. Poketourism can’t be far behind, I kid you not.

nintendo-2

The many, including me, not yet long should study further for rational entry points. Shorting this rocket is not something characterized as an investment activity and should not be considered.

Nintendo has over $7bln on cash on their balance sheet and no debt. The previous high in the ADR’s was $78.50 in 2007 and there are 15% less shares outstanding now (held as Treasury stock by Nintendo, now the largest sole shareholder of Nintendo stock via timely buybacks at much lower levels).

The current $33.38 price for the ADR’s has come too fast, but it is difficult to fade this move for the multitude of reasons noted. Nintendo has a market cap of $32bln at present.

Pokemon Go was developed by Niantic Inc., a Google spin off which Nintendo holds a 32% stake in (yet another reason to own Alphabet too). One can bet there are many more augmented reality games in the wings. No gaming company has been more successful than Nintendo, who have brought 22 of the top 25 console games to market over the history of the gaming space.

The previous stock price pinnacle of JPY 75,000 (we closed at JPY 27,780 Friday last) was achieved when Nintendo’s Wii console took the market by storm, selling >100mm units. There are 2.5bln smartphones in use globally at present, and growing. Candy Crush has the record to date for smart phone penetration at 20% and it would appear Pokemon Go could easily exceed that metric. Those early to the story in January 2016 saw 3-4x upside for Nintendo shares. The recent spike of near 2x since the limited Pokemon Go launch clearly increases the risk for new holders, but it would appear a mobile gaming juggernaut has emerged in Nintendo.

For those that feel restricted trading only North American hours, the more liquid parent listing denominated in JPY, 7974.to is another option for those enabled to trade on foreign exchanges. Any medium to long term hold would be best currency hedged, as even though the JPY has rallied 15%+ at points in 2016 seems destined to depreciate versus the USD.

Play safe and trade safer. JCG

PS: Follow me  on twitter, Caleb Gibbons @firehorsecaper

Comments »

$ICPT : INTERCEPT PHARMACEUTICALS, INC., – BIDDING PADDLES READY

Intercept Pharmaceuticals, Inc., waiting until almost midnight, the Friday before the Memorial Day long weekend, 5/27/16, announced the FDA approved Ocaliva (Obeticholic Acid) for the treatment of the liver disease PBC (primary biliary cholangitis), formerly known as primary biliary cirrhosis. Approval was largely expected (the FDA Advisory Committee had previously voted 17-0 in favour), but the good news appears to be that the conditions attached to the approval are modest. Safety concerns had some worried that sales could be hampered by restrictions on use in patients with moderate or severe hepactic impairment, but the prescription label has no such restrictions from my reading of it (link for your perusal): ocaliva_pi

PBC is a rare, autoimmune cholestatic liver disease that puts patients at risk for life-threatening complications. PBC is primarily a disease of women, afflicting approximately one in 1,000 women over the age of 40.

Sales of OCA will begin In 7-10 days and expectations are that peak sales could reach $2.6 billion per annum. $ICPT closed Friday at $141.77 with a market cap of $3.5bln. With a typical valuation of 7x sales, clearly there is scope for a rally from here. ICPT’s float is small at 17.44mm shares and 3.4mm shares (19.5%) are held short. 78.5% of the shares are held by institutions. Fidelity Investments is the largest holder with almost 15%. The lifetime high for the stock was $462.26, which will not likely be eclipsed until OCA for NASH (fatty liver) is approved in early 2019, which obviously depends of the results of the 2,000+ patient Phase III global trial.

Another likely scenario is an approach from a larger player seeking a blockbuster drug to add to their stable. With OCA approved for PBC there is now a risk buffer to await the 2018 outcome of the phase 3 “Regenerate” trial for OCA in the treatment of NASH. Nonalcoholic steatohepatitis (NASH) is a significant metabolic form of chronic liver disease in adults and children effects a much larger percentage of the population that PBC. The OCA dosage for the treatment of PBC are 5-10mg whereas for NASH the trial is being conducted at dosages of 10 and 25mg. There are currently no drugs approved for the treatment of NASH and OCA for PBC is the first liver drug approval granted in the last 20 years. PBC & NASH are distinct, progressive liver diseases. Both diseases may lead to fibrosis and cirrhosis of the liver. From a valuation perspective most would argue 20% to the PBC application of OCA and 80% to the much larger NASH opportunity.

XBI the SPDR S&P Biotech ETF is -26% ytd in 2016. ICPT is the 4th biggest holding in the ETF at 2.6%.

What lies ahead:

Next week analysts will be tweaking their ICPT numbers based on the terms of the OCA for PBC approval. Most recently MS moved to underweight with a price target of $80. Stingy indeed when ICPT have > $22 a share in cash on their balance sheet! Merrill Lynch have an underperform on the stock and a $144 target. ML used to be the biggest bull on ICPT, with a target > $800 per share when Rachel McMinn Ph. D covered them, before joining Intercept Pharma as Chief Business & Strategy Officer in April 2014.

The street conjecture will also begin as to the timing of a bid and take-out premium likely on a bid for ICPT, now that a level of uncertainly has been removed. JCG

Disclosure: Long ICPT, 3% weighting, trailing stops, not inclined to sell < $200.

Comments »

iCAR – NAV SET FOR $AAPL DEAD END

I for one think that Apple entering the automobile business is a very bad decision. Road & Track’s rendering looks like a Citroen and we know the lumps the French have taken on that misventure over the years. It has been reported this week that Apple has spent $4.7bln on automotive technology R&D over the 2011-2015 period, nearly 25x what incumbents (i.e. actual car companies) have spent on R&D, in aggregate, over the same period ($192mm). Apple’s “Project Titan” (the name of Nissan’s capable truck offering) is said to target having 1,800 employee by 2019. A car could come out at the other end by 2021. We will be on iPhone double digits by then (skip 13?), and shareholders will likely be highly fatigued by this farcical endeavor.

As per trusty Exodus, AAPL’s P/E stands at 11.2x. The average diversified electronics P/E is 20x, tech 22.2x, and overall market 20.6x. Ford, king of trucks with their best selling F-150 and global offerings like the Focus could not even make a go of it in Japan. Ford’s P/E is 6.23x, autos aggregate 10.2x, consumer goods 22.1x. The only car company to not totally step in it this year between emission scandals, recalls (airbags, etc.) and the like is Fiat Chrysler (FCAU, P/E 13.1x) who successfully spun out Ferrari (RACE, P/E 23.26x), tagging it with a portion of the parent debt as well. This was textbook creation of shareholder value, boosting the P/E of a niche, premium priced brand to elevate the P/E to one in line with a consumer goods P/E with a 22 handle.

Morgan Stanley gushed about Apple’s prospects in the car business this week in a research report, estimating an eventual 16% market share. What a lark; GM’s share is 17.7%, Ford 14.5%, Toyota 14%, Fiat Chrysler 13.2%, Honda 9.2% and Nissan 8.5%. Apple would need a best selling truck for the US market to get a sniff at a 5% share overall. They would need an EconoBox for Japan (who have the Nissan Leaf). They would need a budget, tank like SUV for the Chinese market where commuters increasingly fear death in any mechanized chariot weighing less than 5,000+ lbs (Great Wall SUV below). They would need affordable bling for the India market, one of the fastest growing automobile markets in the world (charging stations an issue). Finally, might as well throw in an estate version for Continental Europe.

Great Wall Motors is a domestic producer in China and is China’s largest manufacturer of SUVs and pick-ups (X Series pictured below). An interesting fact in terms of quality control is that they have the front doors (deemed the highest wear and tear item) made in Thailand by in plants entirely staffed by women. The doors are then sent back to China for final vehicle assembly. Their trucks sell well in markets like Australia as well where even with onerous import duties you can be “on the road” for under US$18,000 (kangaroo catcher grill is an aftermarket item, non OEM).

e-1

Nearly 30% of the oil demand in the US is driven by commuting (gasoline), with most drivers solo passengers. We need another $75,000 greenfield electric car like we need Trump as leader of the free world. Mass transit like China’s proposed 1,200 passenger Hoverbus makes a lot more sense. Driverless cars is another joke, a car is not a wearable and most have less than no interest. Autopilot transport truck trials in Europe are promising where road safety for other drivers is increased, along with improved fuel economy when travelling as a convoy.

CjS9LtYWEAEWpdo

Apple sticking to their core strengths is a highly preferred strategy, along with a return of capital to shareholders, by way of a special/extraordinary dividend. Apple’s cash hoard has been covered to death in the press, with the bulk of it is held offshore, not having felt the effects of the 35% tithe of the US Internal Revenue Service, yet. Domestic US cash generation has not been able to keep up with the outflows from programs like their $50bln stock buyback plan and the dividend increases activist investors have been able to cajole management into committing to. Apple now has $50bln in debt. Apple, already the largest sole taxpayer in the US at $10bln would owe an additional $23bln+ if they brought the overseas cash home to Cupertino, CA home spaceship base.

maxresdefault

CjQRYyvUYAA2LZh

My April blog on the spike to come in copper due to the growth in “renewables”was echoed by BHP this week. This Apple news, should it come to fruition, adds more demand to the equation.

For those that missed it: http://ibankcoin.com/firehorsecaper/2016/04/23/lithium-vs-copper-basis-trade/

Carl Ichan recently sold his entire Apple stake after holding for a period of 3 years, an active 3 years for Carl, in terms of shareholder activism. Worries about Apple’s relationship with China was his main gripe in jettisoning the full position. Soon after, Apple cut a $1bln check to invest in Chinese cab hailing UBER rival Didi Chuxing, to help Apple better understand the critical Chinese market. Surely China education can be secured more prudently, hopefully they do not serve up a Dud-i instead. Pre-IPO Apple took a paltry $3,600,000 of VC funding. Quite in contrast to the latest $1.8billion round by Snapchat, valuing them at $20bln.

Other punters, including Warren Buffett’s Berkshire Hathaway have been the cupped hands, investing approx. $1bln on the most recent AAPL stock swoon (some sources reporting at prices in the $109 area, other surmising in the $90’s). Just yesterday block buys were evident, 12.5mm shares across 2 trades for a cool $1.25bln as AAPL stock re-took $100 to close $100.41.

Apple should return excess liquidity to shareholders, when feasible from a taxation perspective, and let them invest where they see fit. Any by the way, how about fixing iTunes too. JCG

Follow me on Twitter. Caleb Gibbons @firehorsecaper


Comments »

US MUNICIPAL FINANCE – HIGH SCHOOL FOOTBALL STADIUM HUBRIS

If they ring a bell at the top of the muni bond market, this muni bond issue will be the poster child. Muni investors have long been considered the “C students” of Wall Street, but even for them, this may be too much.

McKinney ISD (Independent School District), Texas just voted yes to a new $220mm tax exempt bond issue which will help finance a $72,800,000 football stadium for their high school, yes their high school. Even though MISD is projected to grow by a scant 71 students (net) per year over the next 5, it has been determined that this all makes abundant sense. Most sane voters (Grassroots McKinney) would squash such financial folly, but the proponents of the deal, labelling themselves “Vote for McKinney’s Future” included the $50.3mm of “new” stadium earmarked money ($10mm was previously spent for the land and $12.5mm of debt was raised a full 16 years ago for the stadium) into a larger debt deal with sensical use of proceeds as a means push through this farcical stadium plan. The only way this could be more emblematic of the funk taking place in US of A is if it carried the name TRUMP stadium. A 10 year stadium naming rights deal could at least have resulted in some savings versus the ridiculous budget  for this open-air teenage concussion petri dish.

Stadium

Note: artist rendering of the new 12,000 seat McKinney high school football stadium.

This is far from an isolated case. Allen ISD is only a few miles away from the planned McKinney stadium, seats a much larger 18,000 and was built for $60mm (bargain). KATY ISD (near Houston) is in the final throws of approval for their very own $62.5mm cost, 12k capacity high school football stadium. The KATY ISD was established in 1898 and includes 60 school with a total annual budget of $785mm. KATY is ranked 13th place within Texas. One would think a top 10 academic placement might be a pre-requisite for spending $50mm+ on a stadium for a non-pro sport, played by teenagers, that may well be extinct or highly amended a decade out (watch the film Concussion, circa 2015).

sg2016050825277

The US muni market is immense at $3.6 trillion and as with the Federal debt tally, much has been issued in the last couple of decades. In 1945 there was $20bln of muni debt, in 1960 there was $66bln, in 1981 there was $361bln and now we sit at $3.6 trillion.

Texas is a AAA/Aaa rated state. KATY ISD is rated Aa1/AA stand alone, but as with many muni issuers they often procure credit enhancement to get to AAA/Aaa ratings (saves on interest cost for timid muni bond investors that love the idea of a AAA/Aaa rating). The point here is debt is not free. Even if McKinney can get their debt deal done in the mid 2’s, that is still $5.5mm of interest per annum, enough to pay 150 Texas 10 year tenure teachers ($37,000 per teacher). The right be be able to issue debt on a tax exempt basis is a powerful right, in and of itself. Most of the holders of muni debt are the wealthy, the top 10% of taxpayers, with a big concentration in the top 1% of taxpayers. A seemingly paltry 2.5% tax exempt yield is much more attractive when converted to a taxable equivalent basis (TEB) = 2.5% / (1 – marginal tax rate). The 1% are taxed Federal at 39.6% at the margin. There is a 3.8% tax on investment income to pay for Obamacare, but muni interest is exempt making 2.5% tax exempt equivalent to 4.42% on a taxable equivalent basis.

These silos of affluenza are not sustainable, full stop. The World is watching. Smaller government will be a necessity going forward. It will start with towns, which will share essential services (police, fire, education, health care …. high school football stadiums) skimming 20-25% of the bloated unpaid  bar tab for pension and OPEB (Other post employment benefits). Prudent investors should brush up on their Ch. 9 Title 11, Authorization for municipal bankruptcy knowledge. State amalgamation will follow within a decade. We can have a naming competition on the new name for Maine/New Hampshire/Vermont, followed by Washington/Oregon, North and South Dakota, etc.

Each $500bln of frivolous muni debt represent a huge  opportunity cost for the US government. With a weighted average (current) coupon assumption of 2.5% and a marginal tax rate of 39.6% (+3.8% Obamacare tax levy on investments) the Federal tax leakage is 5.4bln (12,500,000,000 of interest income taxed at 43.4%) per annum. Texas has no State tax, the opportunity cost is even higher in the high State tax states like NY and NJ.

All this is happening at a time of near unparalleled uncertainly (GFC aside, but that is a much longer blog …. AIG bailout, TOB – Tender Option Bond Programs, aka “Tons of Blood”, global arbitrage of the steepness of the US municipal interest rate curve gone awry). Puerto Rico (PR), which I have recently written on, will be restructuring their debt, as soon as legally feasible. PR defaulted last week on a large slug of GDB (Government Development Bank) debt. PR’s benchmark 8% 35′ GO’s (General Obligation bonds, top of the food chain from a “priority of payments” perspective) ,are yielding > 13% tax exempt this week (23% + on a taxable equivalent basis even as a Texas taxpayer).

The Federal stance on the PR pension plans will be precedent setting for the woefully underfunded US States. Illinois has the worst pension in the nation (funded 40 cents to the $1), aside from the non-state bastard PR (sub 10 cents funded on a blended basis). IF we see an insolvency at the state level in the next  decade it will be Illinois.

More than 45,000 students in Detroit missed school for a couple of days this week due to the “sickout” staged by teachers, embroiled in a strike. Detroit was the largest city bankruptcy in US history, July 2013 ($19bln).

Something is rotten in the state of Denmark (Shakespeare). JCG

Comments »

MALAYSIA’S 1MDB – THE PLOT THICKENS

I last wrote about Malaysia and 1MDB’s travails in November 2015, in my very first blog post for iBC. The Malaysian Ringgit has rallied from the Q4 2015 extremes, but overall times are, if anything, more uncertain for Malaysia. For a primer, a good recap:

Malaysia – 1MDB

Given that 1MDB has now officially defaulted on a $50mm interest payment this week (Monday was the official deadline) on a 5.75% coupon US$1.75bln bond issue , I thought it might be a good time for an update. In bond investing, sometimes a law degree can prove to have more utility than a CFA charter.

In this instance, bond investors are caught in a serious Malaysian stand off between 1MDB and Abu Dhabi’s sovereign wealth fund’s IPIC (International Petroleum Investment Corporation) who provided guarantees on $3.5bln of 1MDB debt (2 x $1.75bln par amount). Sometimes, willingness to pay can be more important than ability to pay. In this instance, 1MDB felt that co-guarantor IPIC should have made the full interest payment. IPIC, for their part, declined to make the payment, noting that cross-default clauses would apply to 1MDB as a result of their inaction. IPIC have stated they will make the referenced interest payments, if 1MDB defaults, which they now clearly have. Both parties are referencing a May 2015 “Term Sheet” whereby IPIC agreed to service the jointly guaranteed debt in exchange for a payment of $1bln from 1MDB, a payment IPIC states was never duly received.

The next $52mm+ interest payment on an identically sized but higher coupon 5.99% 1MDB Energy Ltd security is  due is May 11, 2016. Note the ratings of the TIAMK 5.99% 05/11/22 are Aa2/AA, by virtue of the joint and several guarantee on the bond by AA rated IPIC and A- rated 1MDB. 1MDB have stated they are keeping their options open with respect to the May 11, 2016 interest payment. Clearly both sides have retained legal counsel. There is no morning after pill for default.

With the grace period having passed for the payment on the interest payment due Monday April 25, 2016  the clock now begins on calls for payment under the guarantee(s) which has a 10-day wick in terms of cure period. Presumably IPIC, based on previous statements, will pony up the cash required to make the overdue interest payment during this 10 day window.

JP Morgan, in the midst of all this frolic , have upgraded 1MDB Energy Ltd. bonds to “overweight” noting the IPIC guaranteed 1MDB bonds are now trading at +152bp (1.52%) wide, deemed an “excessive spread” 6.08% yield (+472 spread to UST 5yr) to IPIC’s other US$ debt with comparable maturity maturity, yielding 4.56% (+320 UST 5yr).

Not terrain for the retail investor, as sourcing bonds in block size has proven difficult, and the bid/offer spread in even family office clips would elicit alligator tears from Chuck Noris. Institutional investors only, who can cajole their tier 1 coverage into providing a sliver of liquidity in this peculiar market dare play. Unless we see a significant move in price (lower), new players will likely stay well clear of the festivities.

Goldman were the lead on US$6.5bln 1MDB bond issues, a relationship that has caused a great deal of scrutiny in and of itself (fees eclipsed $500mm). Goldman’s rainmaker, former SE Asia Chairman Tim Leissner, took personal leave earlier in 2016 (at Goldman’s request) and was soon thereafter subpoenaed by US investigators.

Malaysia’s own investigation recently cleared Prime Minister Najib Razak of wrongdoing. Numerous other global investigations are on-going (US, UK, HK, UAE, Thailand, Australia, Luxembourg and Seychelles).

A good barometer of EM sentiment, if nothing else. The sky is not falling, but lack of a speedy resolution could see the Malaysian sovereign rating downgraded as the full extent of their 1MDB contingent liability is laid bare.

Malaysia, you’re so crazy. JCG

sg2016042511265


Comments »

LITHIUM VS. COPPER – BASIS TRADE

Lithium vs. Copper – I like Dr. Copper

Lithium is certainly the trade du jour, eclipsed only by precious metals year-to-date in terms of return. I think the lovers of “white oil”, as lithium is affectionately know, are well over their skis. A naked short is likely ill advised given the robust current fundamentals for lithium, but as a basis trade versus long copper, I like the current set up. Hear me out.

Lithium:

Lithium is a chemical element with the symbol Li and atomic number 3. Lithium is a soft metal, used increasingly in lithium-ion or lithium-polymer batteries, with other varied uses:

imgres

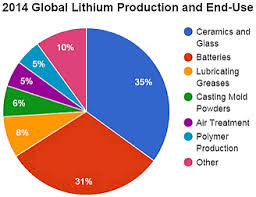
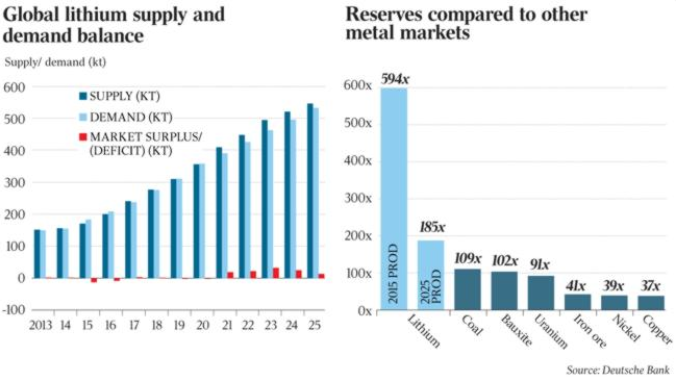
Tesla has clearly been the “thumb on the scale” in the lithium hydroxide market. At full capacity, Goldman estimates Telsa’s gigafactory could draw a full 17% of global lithium supply. If they ever got to a production level of 500,000 cars per annum they could hog the majority. Current lithium (carbonate and hydroxide) production  is estimated at 175,000 MT (metric tonnes) per annum, with production expected to grow to as much as 300,000 MT 4 years out. Prices spiked in 2015.

Lithium Reserve Base

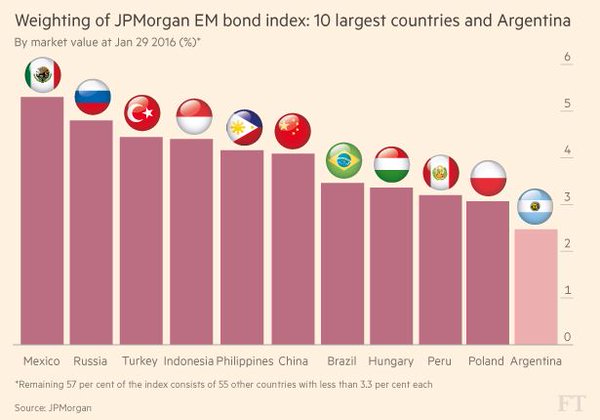
70% of world lithium production comes from only 3 countries; Bolivia is #1 with lithium mined from the southern region of the country, bordering Chile and Argentina, the #2 & #3 producers. Traditional sourcing of lithium in South America is by extracting lithium-rich brine concentrate from beneath salt lakes. Eventual development of Afghanistan, the “Saudi Arabia of Lithium”, ($1tln + in mineral resources, including purported world leading, copious quantities of lithium) could certainly change the math over time, but commercial exploitation of the resource is a ways off yet (how about never). Others countries producing lithium include Canada, China, Australia, Brazil & Serbia. In Australia, the mining and processing of  spodumene, a hard rock lithium bearing mineral, is typically a more expensive sourcing route than brine extraction.

90% of lithium production globally is from 3 listed producers:

Albermarle Corp (ticker ALB) has a $7.4bln market cap. The largest lithium player you have likely never heard of.

Business description: “Albemarle operates in several global specialty chemical businesses with oligopolistic market structures and premium margins. Historically, Albemarle produced bromine, polymer additives, catalysts and fine chemicals that generated $2.5 billion in 2014 sales. The recent acquisition of Rockwood added two leading businesses: lithium and derivatives as well as Chemetall surface treatment”.

Nevada is the site of the 2017 slated Tesla/Panasonic gigafactory. Sumitomo Metal Mining supplies lithium nickel oxide to Panasonic who in turn makes the batteries for Telsa. Despite the future prospects, lithium is currently in good supply (read oversupply), with Sumi able to supply 60% of the gigafactory’s projected lithium needs from existing capacity.

lithium

Albemarle_Lithium_Chart

Tesla has separately entered into a long term lithium supply contract with Bacanora Minerals Ltd. and Rare Earth Mines PLC forming Sonora Lithium Project Partners, with right to tracts of land in northern Mexico where they plan to extract lithium from mineral rich clay. Initial capacity is 35k MT which can be scaled to 50k MT. Market watchers have their doubts that Tesla has tethered themselves to the lithium A-team. Time will tell, but it sounds like the chemical version of the Hyperloop to me.

Lithium is not traded on any commodity or futures exchange. Lithium prices are set in an oligopolistic fashion based on supply and demand factors.  Price estimates are difficult to come but, but it appears that $6,000 MT is a floor for battery grade lithium and some expect annual price increases to be 20% through 2017. Reported prices in China for lithium, typically the highest priced in the world, are over $8,000 MT. Electric vehicles account for less than 10% of lithium demand at present, but this is expected to grow to over 30% by 2020 at current adoption rates. Carbonate-hydroxide conversion capacity will likely need to be expanded, with carbonate demand somewhat static versus bid hydroxide, especially in 2018 and beyond.

EXODUS shows ALB to be currently OB (over bought), both on a technical and hybrid basis with a hybrid reading of 3.85 (versus a 3.74 threshold for OB status).

SQM, Chemical Mining Co. of Chile Inc. has a market cap of 5.9bln in comparison, but is nowhere near as overbought. FMC Corp., ticker FMC has a $5.7bln market cap and has several key business lines, making it less of a lithium pure play.

ETF options are available. LIT is the ticker for Global X Lithium ETF with a market cap of 32mm (small) and daily turnover of 36k shares (illiquid). LIT is up 40% ytd.

Top 10 Holdings (67.16% of Total Assets)
Company Symbol % Assets
FMC Corporation Common Stock FMC 19.46
Sociedad Quimica y Minera S.A. SQM 9.85
Orocobre Ltd OROCF.AX 5.58
Albemarle Corporation Common St ALB 5.48
LG Chem Ltd LGCLF.KS 5.02
Tesla Motors, Inc. TSLA 4.54
GS YUASA CP KYOTO GYUAF 4.50
Simplo Technology Co Ltd SPLOF.TW 4.44
BYD CO LTD H SHS BYDDF 4.17
SAMSUNG SDI CO.,LTD. 006400.KS 4.12

The best short leg of the basis trade seems to be abundantly clear, ALB it is ($7bln + market cap and 1mm + avg. shares trades per day). Overbought and appearing ripe for a pull back.

Copper:

Copper is the 3rd most widely used industrial metal, used extensively in industries such as construction and industrial machinery manufacturing.  Symbol Cu and atomic number 29. Copper has the 2nd most electrical conductivity of any element after pricey silver.

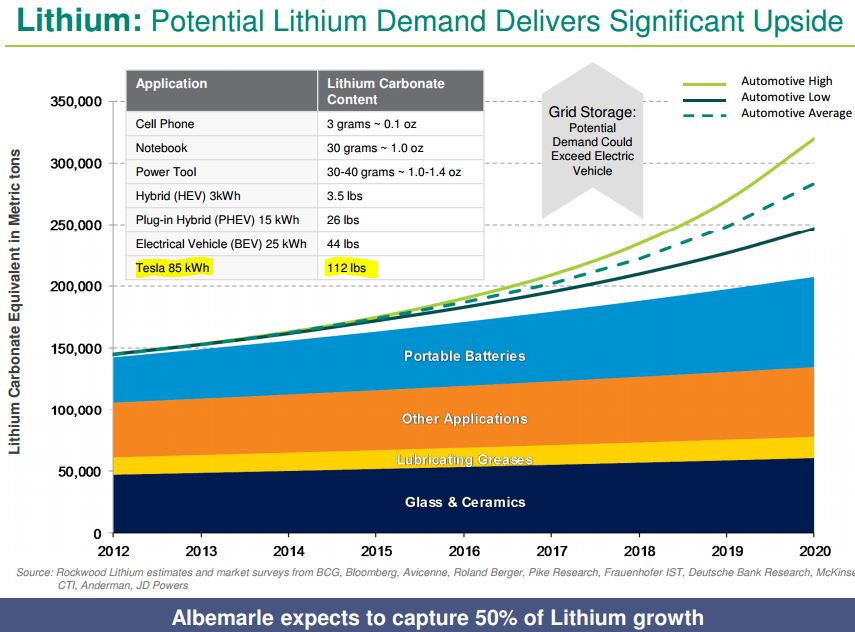
Upwards of 70% of the material in a lithium-ion battery is copper. That is 260lbs. of copper per Tesla 85 kWh (112 lbs. of lithium) battery alone, and does not include the copper required for the copper-induction engine.

most-copper-producers-in-chile-barely-breaking-even-mining-group

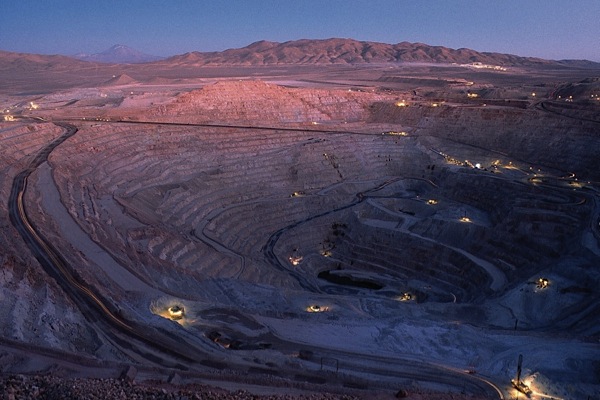
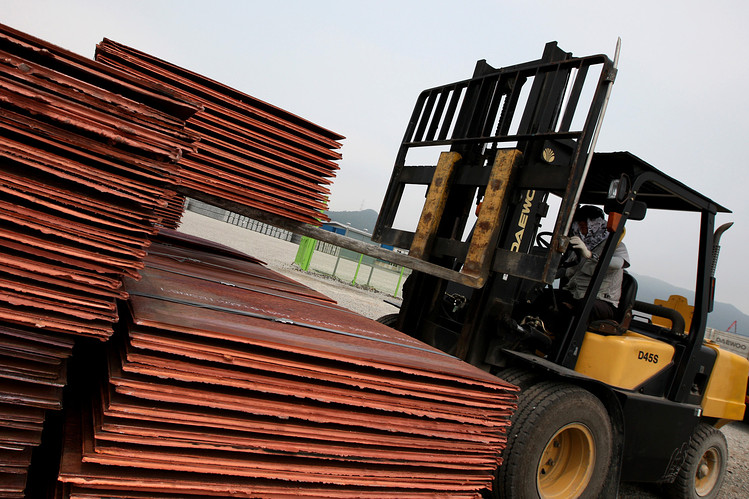
Note: picture is of Chile’s Escondida copper mine, the world’s largest. BHP, the 3rd largest copper producer owns 57.5% of the Escondida mine.

Chile is the largest copper producer in the world and holds a full 20% of global reserves. Codelco (privately held) is the # 1 global producer. A full 50% of Chile’s exports are copper. Codelco lost $2.2bln in calendar 2015 after a profit of $3bln in 2014.

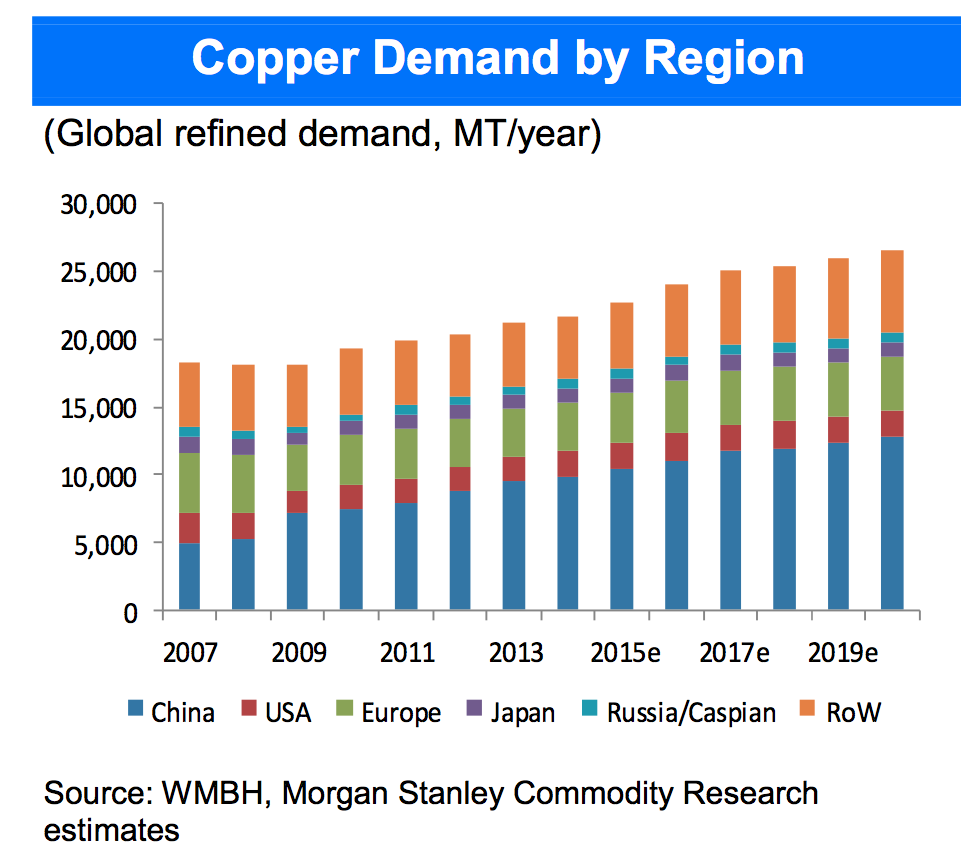
China is in #2 spot as producer and garners 40% of world supply on the demand side (versus their 20% world population weighting). Peru is in #3 spot in terms of supply, followed by the USA in #4 position. Global copper production stand at 18k MT per year  with a growth rate of 575k tonnes (3.2%) per year.

copper demand

John Mendelson first identified copper as the bellwether of global economic activity, Dr. Copper, the metal with a Phd. in economics.

The very much living, modern day Dr. Copper is arguably billionaire Robert Friedland, Ivanhoe Mines Executive Chairman (IVN.TO). Mr. Friedland is the Steph Curry of the mining world, having hit 3 pointers around the globe for thirty-five years in geography as diverse as Canada (Voisey Bay, Newfoundland – Nickel), and China (Oyu Tolgoi, Turquiose Hill, Mongolia – copper/gold/silver) with Africa being the current focus (Platreef, South Africa – nickel, copper, gold; Kamoa, DR Congo – copper; Kipushi, DR Congo – copper & zinc). A mining rock star, and in his mid 60’s Friedland shows no signs of slowing down.

663387-robert-friedland1

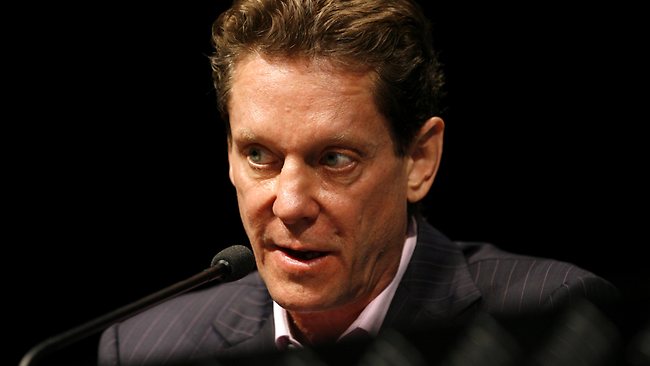
Note: Robert Friedland (pictured) is a USA/Canada dual citizen and currently resides in Singapore, Republic of Singapore.

Mr. Friedland provided some insightful information at a recent mining conference in Santiago, Chile:

sg2016042016858

spot-copper-5y-Large

Copper is trading at $5025 per metric tonne currently ($2.28/lb.). Unlike lithium, there are very active futures exchanges for “financial” copper. Copper trades on the Shanghai Futures Exchange (SHFE), COMEX and the LSE (owned by the HKE). SHFE volumes are beginning to dominate (larger than other exchanges combined). China’s is the world’s largest consumer of industrial metals and is said to have a $2bln stockpile of copper at present.

Banks have tightened their procedures for lending against metals as collateral on the heels of the Qindao port scandal of 2014. The mess is still be untangled, but losses will clearly top $1bln related to the fraud where metal feedstock was re-hypothecated numerous times (like a home mortgage with 400%+ LTV).

OB-XA621_0411co_P_20130411153325

The three biggest listed copper producers after non-listed #1 Codelco are Freeport McMoRan Inc. (FCX), Glencore Plc (GLEN.L) and BHP Billiton Limited (BHP).

For the long side of the proposed basis trade, I would vet FCX,  which while not oversold, stands  at 2.82 hybrid on Exodus (2.44 being the threshold for OS).

Glencore is relatively new to the producer side of the equation and between the other two candidates I would favour FCX for the long side of the basis trade (Better Exodus scores and exposure to precious metals).

As with lithium, ETF copper offerings are thin with JJC, iPath Bloomberg Copper Sub TR ETN offering one alternative. GNR SPDR S&P Global Natural Resources ETF is another.

Short ALB vs. long FCX is my current trade inclination. This will be a tactical trade with appropriate stop losses on each leg. JCG

Note: Recent long in Ivanhoe Mines Ltd., (IVN.TO) from C$0.60 to C$0.91. No current position in other securities mentioned.

Comments »

GREAT-WEST LIFE: MID-MONTH APRIL FOOLS FOR HYBRID DEBT HOLDERS

search

This was a week to forget for institutional fixed income investors in Canada. For a change, gas & oil exposure concerns relinquished centre stage in the circus to extension risk on junior subordinated hybrid debt securities.

Great-West Life (GWO) mid-month declined to exercise their call option on their US$300mm 40NC10 fixed-to-floating hybrid security (GWOCN 7.153% 05/16/46 cusip 39136WAA2) which has sent shock waves through the C$45bln domestic market for comparable fixed/float hybrid securities. GWO, it should be noted, is well within their rights as per the bond indenture for the said security, the call option right was theirs solely. Market practice to date led institutional investors to expect Great-West to call the security at the nearest call date, the 10 year anniversary 05/16/2016 in this case, the point at which the fixed coupon ceases and a floating rate (based on the 3 month US$ Libor rate + a spread of 253.8bp) comes into effect should the securities not be called. Top holders of the bonds include RBC Global Asset Mgmt (18%), Fidelity (15%), USAA (12%) and Sentry Investments (11%).

sg2016041921645 (1)

The call feature is not identical for all debt securities. The call on the subject Great-West Life issue is a “European” style, meaning the issuer has a 1-time option to call the security (at $100, par in this case), on 05/16/16, with the appropriate notice to holders.

At the time of issuance in 2006 (Lehman was the book runner, not yesterday), Moody’s rated the issue Baa2 based on the 40 year (final) term and covenant that Great-West would replace at the maturity date (or call date, if so exercised) with an instrument with equal or better “equity characteristics”. Moody’s places the issue in basket D (75% equity / 25% debt) and it should be noted that the ranking is equivalent to Great-West preferred stock in liquidation, offering a loss absorbtion cushion to securities of higher priority. The bond have held the Baa2 through the non-call period and the underlying bond traded at or above par through October 2015. The latest announcement (call not exercised) saw the bond  break $90 (down 5 5/8ths in price terms).

As an aside, if the call option were “American” style, Great-West Life could exercise any time on or after 05/16/16 (with specified notice). The other variant is “Bermudan” (between the other two),where the call can be exercised at any coupon payment date (semi-annual in this case) on or after 05/16/16.

What are the risk?

To investors: The main risk for investors, especially in the high grade sector, is extension risk. If the securities are not called they may remain outstanding for a considerable time (30 years in this case), affecting returns and causing a downward realignment in pricing due to the much longer maturity profile.

To issuers: Market access and the clearing level for future issues can be affected when large institutional investors feel slighted. If this were about a relatively small US$300mm bond issue there would be little impact, but the underlying market for like securities is very large ($45bln +) and significant downtrade in the secondary market pricing of other securities has been evident. The C$1bln Great-West Life 5.691% 06/21/67 also traded down hard on the week as the delta of the 06/21/17 call fell on this new information. The bonds fell $8+ on the week to settle approx. $95.50.

Value may emerge from the carnage, but significant homework is warranted. Great-West prefs are good as a comp, but are not very liquid compared to other names I have profiled in the pref space.

Black-Scholes does not capture all the pricing idiosyncrasies of options pricing when the needs and wants of PMs (buyers) and Treasurers (issuers) do not fully line up. Hybrid securities are inherently complex instruments. JCG

Note: All publicly available information.

Follow me on twitter @firehorsecaper

Comments »

ARGENTINA – EM BOND PARTY TIME?

unnamed

Latin American issuer Argentina (B- rated as of last week) returned to the bond market with great fanfare, raising $16.5bln across four maturities, making it the largest ever EM bond issue. There were over $68bln in orders for the debt issue which allowed the 10 year (largest) tranche to price a full 50bp (0.50%) tighter than initial price talk. The bond rallied in the gray market, with the $6.5bln of 10’s trading up $1.60-$2.10 in price terms in late Tuesday trade.

Argentina was rewarded for being market-friendly (legacy default on $95bln of debt in 2001 aside) and having a pragmatic administration at the helm. 15 years “in the box” was deemed to be enough by the market and the recent uptick in emerging market sentiment was pushed to full advantage.

Over 60% of bond proceeds ($10bln) are earmarked for hedge funds and other investors, led by billionaire Paul Singer’s Elliott Management, who recently won a protracted court case against Argentina with respect to defaulted Argentinian debt. 15 years is a long time to wait for a 10 bagger. Thirty years is also a long time to hold a B3/B- sovereign credit with a 8% coupon. JCG

sg2016041910212

654e320b-d03a-48dc-b319-3d5cd73160fe

Comments »

RBS G SERIES PREFS: I READ THE TEA LEAVES – I BUY

RBSPRG2016041817399

Pref shares are not everyone’s bag, especially is an equity centric investment world. Regardless, prefs hold an important place in the capital structure, ahead of equity in terms of ranking, but behind debt. Prefs are typically issued with a par value of $25.

Bank equity has has an awful start in 2016, globally. Instrument selection can be as important as sector selection.

ServletCharts

Royal Bank of Scotland (RBS) had issues well ahead of the 2008-2009 Global Financial Crisis (GFC). RBS devoured ABN Amro in 2007 (then the 8th largest bank in Europe), which was the equivalent of a python eating an antelope (hooves and all). In truth, other hyena were recruited in the pursuit, namely Fortis and Santander, but the bulk of the kill fell to RBS to digest. By the end of 2007 the RBS balance sheet was US$3.7tln (at GBP/USD exchange rates at the time). Enter the GFC. Enter the cavalry, enter the Queen. Between Dec. 2008 and Dec. 2009 The United Kingdom infused £45bln (US$64bln) into RBS, more than 40% more than the US Treasury pumped into Citi (US$45bln),to keep financial Earth from spinning off its axis.

I had been partial to the 7.25% RBS T Series prefs since coupons were restarted a couple of years back. I have a 4% allocation. As the T series prefs are trading in line with the issuance price of $25, yielding 7.23%, a call by the issuer is effectively a “wash” aside from re-investment risk.

RBSPRT2016041819498

A learned ex-colleague asked about the relative merit of the RBS 6.08% G Series prefs a few weeks back, first leading me to scoff at the sub-optimal current yield versus the 7.25% coupon  T’s. Further analysis yielded much more information, and a timely Grant’s article in the April 8, 2016 issues titled “Least to Beast” with detailed input from Daniel O’Keefe, PM at Artisan Global Value Fund led me on the path to clarity.

The UK would like to show further progress on repayment of their bail out of RBS. The USA has since extricated itself from Citi ownership and even Lloyd’s has started paying a common dividend again. While some progress has been made, the UK government still owns >72% of RBS (down from 90% +).

The crux of the superiority of the 6.08% G series prefs at $24.03 over the 7.25% T at $25.06 lies deeper in the capital structure of RBS. The G’s were issued by RBS Capital Funding Trust VII. RBS Holdings N.V. (NV) is a wholly owned sub of RBS Group PLC (The issuer of the T’s) and holds the legacy assets of the 2007 ABN acquisition. Asset sales over the last 7 years have taken the NV unit assets to £19bln from £667bln. NV is better capitalized than the parent with tier 1 at 17% (parent tier 1 was 15.5% at 12/31/2015), a total capital ratio at 35% and common equity representing 19%+ of assets. NV carries a very high regulatory cost. Post-crisis protocols call for each regulated entity of RBS to have its own recovery and resolution plan. In summary, too much capital tied up in what is now an insignificant Amsterdam subsidiary. RBS’s total assets as at 12/31/2015 were £815bln, NV 2.3% of the total.

RBS has a total of US$3.3bln in prefs issued by NV, G, E & F (G series US$1.8bln). The play is to buy the G series pref on a potential take out at $25 by 05/18/2017 for a yield to call of 10.29%. The prefs are callable anytime after 05/16/2016. While you wait, the 6.08% coupon (6.33% yield) is a qualified dividend for US tax purposes. RBS could of course tender for the G series for less than $25 (par), but at $24+, it is not likely, given the negative signalling effect. RBS recently (Mar. 22, 2016) returned another £1.2bln owed to Her Majesty’s Treasury (HMT) and retired a class of prefs called the “Dividend Access Share”, paving the way for a common dividend in the not too distant future. JCG

Note: Long RBSPR 7.25% T Series (4% weighting), long RBSPR 6.08% G Series (2% weighting) from last week ($23.68-23.75) and long LYG common on recent resumption of common dividends. No wht (UK) and interest not taxable in Singapore on RBS prefs. Core holding.


Comments »