The manner in which this decline occurred caught me off guard. I can show you why, visually, and from that make deductions.
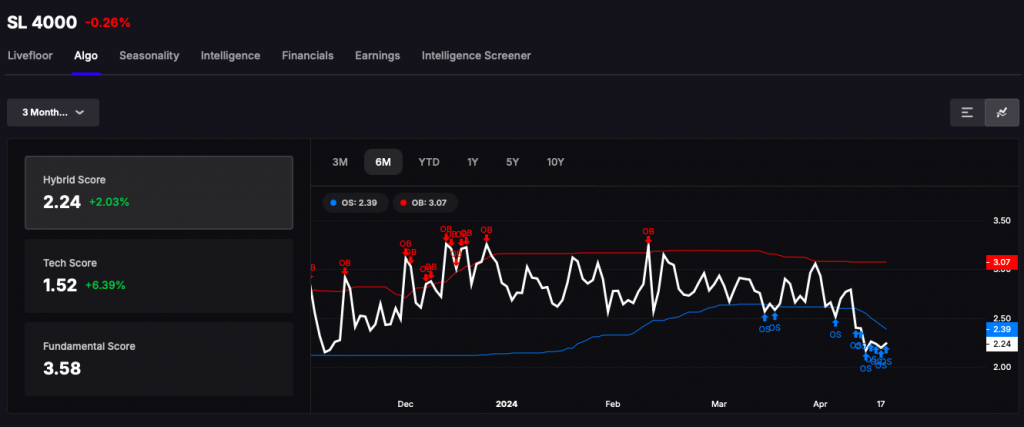
See how the blue moving average kept climbing higher? The cause of that is the bull tape. We were barely trading lower and the mean reversion metrics inside Stocklabs got extremely tight. There wasn’t slow deterioration in the tape. The sell off occurred rapidly and without warning. You can see now how that moving average is diving lower, attempting to adjust to current conditions. The aggregate score of 1.52 isn’t even remotely close to historical oversold levels. We’d need a score of 1.15 and lower to warrant panic. Moreover, whenever there are clusters of OS signals like that, it usually portends some great tragedy in the not too distant future.
Because of this, amongst other things, I took a severely defensive approach today and closed at sessions highs of +61bps. I will show you my holdings, since they aren’t too special.
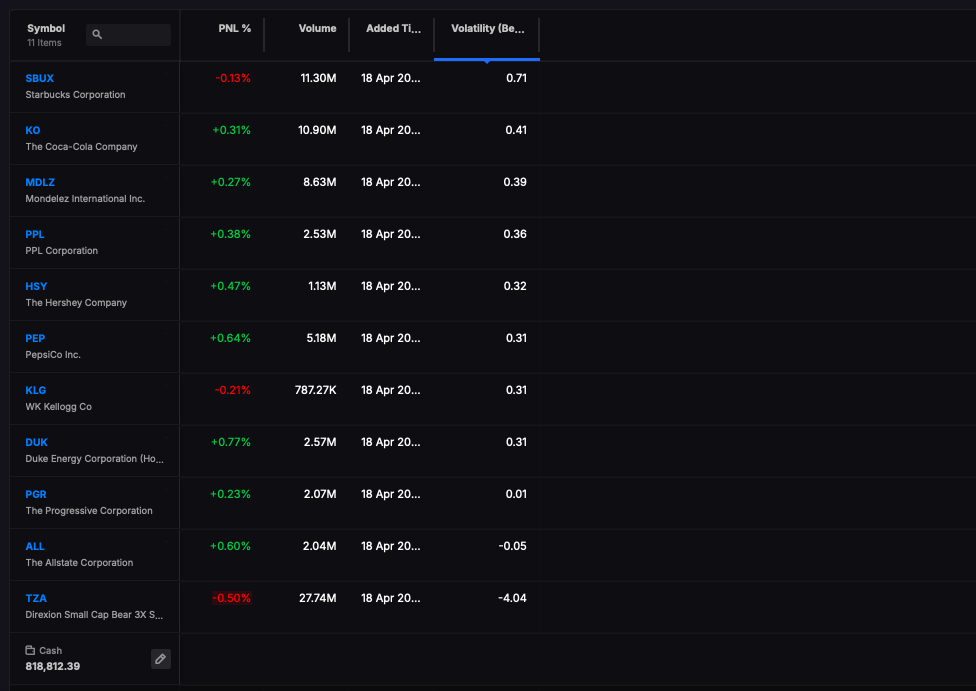
Do you see on the far right the metric “beta”? For those of you too young or stupid to understand, it measures how a stock performs against the overall market. A beta of 1.0 will trade in line with the $SPY. A beta of 0.5 will produce returns half. This is a nuclear bomb shelter of a portfolio, a median beta of 0.31 hedged with a 12% weighted TZA, fixed with 58% cash. If markets shoot higher tomorrow, this portfolio, although conservative, might undergo rotation and get hit. But it’s worth nothing the trend is lower and the secular stocks, like the one’s above, are absorbing panicked hedge fund manager money.
Sitting with losses of 0.66% for April, I cannot tell you I’ve managed this tape perfectly. But juxtaposed against market losses of 8%, I’m way ahead of the fucking pack.
If you enjoy the content at iBankCoin, please follow us on Twitter


What’s the formula for the oversold and overbought lines on the graph?