With headlines like that, I’ll never attain my long term dream of going mainstream.
Lots of chartFAGS out there — people beholden to the view of charlatans and hucksters. The religion of technical analysis is heresy and in the after-life will be strung out and cast into the pits of hell.
It’s important that you arm yourselves with data, before barreling headlong with your fat stomachs into the market. I wanted you to examine the picture below, courtesy of Exodus, and try to imagine yourself basing your decisions on technical analysis as the primary driver of returns.
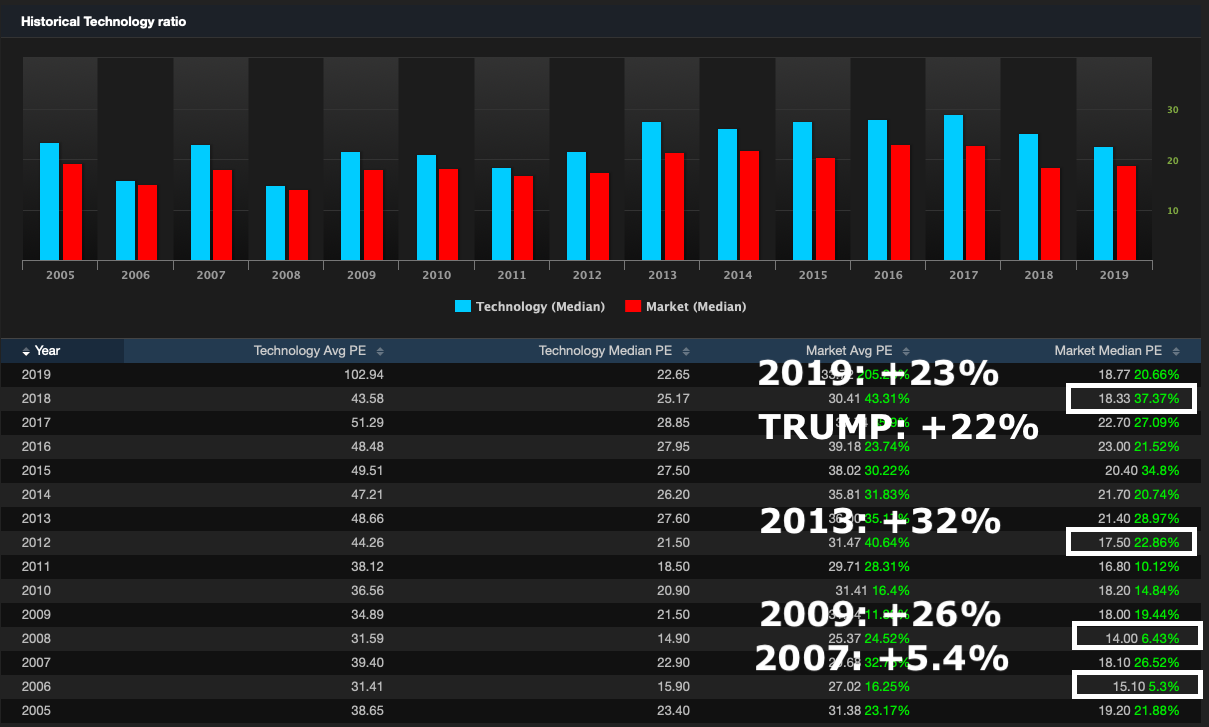
In every instance of valuation contraction, which is caused by rising earnings outpacing market returns, the following years went fucking gangbusters for stocks. The two anomalies was 2007, which bore witness to the nascency of the financial crisis — capping off the year with a -5% rout. The other was the ascendency of Emperor Trump, who slashed taxes and did a lot of damage to the Fed — who was directing interest rate policy in the wrong direction — causing the economy to fuck itself. He corrected those bastards and we’ve enjoyed the benefits ever since. If you recall, late 2018 was the peak for US rates and it caused stocks to get clobbered. Valuations contracted greatly, which led to a monstrous +23% 2019 fever.
In closing, if you only bought stocks after seeing valuation contraction — your average return since 2007 would be +22%.
QED
If you enjoy the content at iBankCoin, please follow us on Twitter


According to your chart ..ooops, table …valuations contracted in 2011 and 2015 and expanded in 2012.
What about negative interest rates? we’re on topic and we all really need to know more about that (including you know who).
“Median” PE is straightforward, however, “average” can mean different things.
For instance, if you have two stocks, one with a market cap of $1000 and earnings of $40 (PE 25) and another with market cap of $100 and earnings of $10 (PE 10):
Unweighted mean: (10+25)/2 = 17.5
Market-cap-weighted mean: (1000*25 + 100*10)/(1000+100) = 23.6
Total market PE (1000+100)/(40+10) = 22
The “total market” PE best represents the overall PE. It matches what the PE would be if the market was one big company (total earnings divided by total price). Of course, accuracy usually takes a back seat to convenience, so few peoepl actually calculate PEs that way for a group of stocks because market cap and PE are easier to find than actual earnings.
Assuming that you used method 1, then this means the averages are skewed by smaller companies.