© Copyright 2007-2024 iBankCoin All rights reserved under penalty of bodily harm. DISCLAIMER: This is a personal web site, reflecting the opinions of its author(s). It is not a production of my employer, and it is unaffiliated with any FINRA broker/dealer. Statements on this site do not represent the views or policies of anyone other than myself. The information on this site is provided for discussion purposes only, and are not investing recommendations. Under no circumstances does this information represent a recommendation to buy or sell securities. DATA INFORMATION IS PROVIDED TO THE USERS "AS IS." NEITHER iBankCoin, NOR ITS AFFILIATES, NOR ANY THIRD PARTY DATA PROVIDER MAKE ANY EXPRESS OR IMPLIED WARRANTIES OF ANY KIND REGARDING THE DATA INFORMATION, INCLUDING, WITHOUT LIMITATION, ANY WARRANTY OF MERCHANTABILITY OR FITNESS FOR A PARTICULAR PURPOSE OR USE. Privacy Policy


It means overbought is bullish.
Since GOLD is INVERSELY correlated and I bought 5 more GOLD Eagles there’s nowhere for you to go but down???
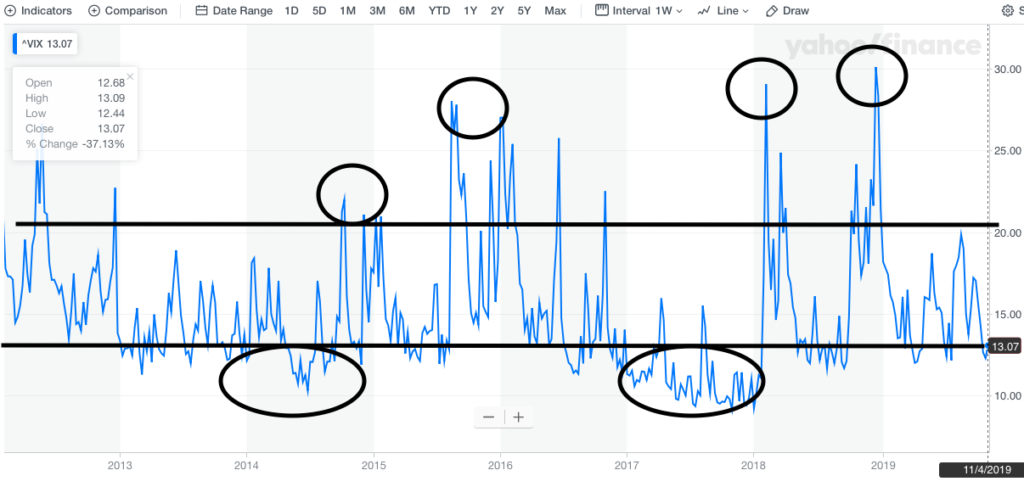
First thing to remember: absolute peaks and valleys cannot be identified in real-time on ANY chart. VIX at 21 can go to 30. VIX at 13 can go to 10.
So the VIX cannot be used as a buy signal or sell signal by itself. Instead, use it as a read on hom compalcent or scared the market is, and understand that it may take time for it to get snapped back to reality.
So when first dropped very low in 2017, that was NOT a signal to sell in retrospect, as the market continued to go up. However, it was just winding a spring for the 10% drop in Jan 2018.
Also, if you are goign to mark a “high VIX” level, then you have to consider the *first* spike above that level. The ~24 spike up in October 2018 was NOT a time to go long, as the market continued to fall and eventually made a bigger spike (~30). Still, even in Dec 2018 (when I called a rally) it was quite possible for the VIX to spike even higher, as it spent **weeks** above that level in 2008.
So basically, th level of VIX is only of interest if it is unjustified. Low VIX under 13: Is this really a time to be compalcent with a trade deal promised for the umpteenth time, but nothinhg on paper, global economies weak, and the US manufactures declining?