The stock looks so fucking good, I can see it running straight to $10, chopping off the cocks of all the Johnny Come Lately short sellers who got in for the move to $00.00. My only apprehension, of course, is the actual specter of an intraday bankruptcy note or perhaps some upstart FUCK FOR BRAINS like Citron issuing a tweet with a price target of negative $50 per share.
Clearly the stock wants higher and I have big balls. I mean, I buy anything and have no qualms about playing this game. But the stock is already up sharply and the entire state of California is under God’s wrath, presently burning down with great alacrity. It’s hard, Ringo, real fucking hard justifying buying this stock up here.
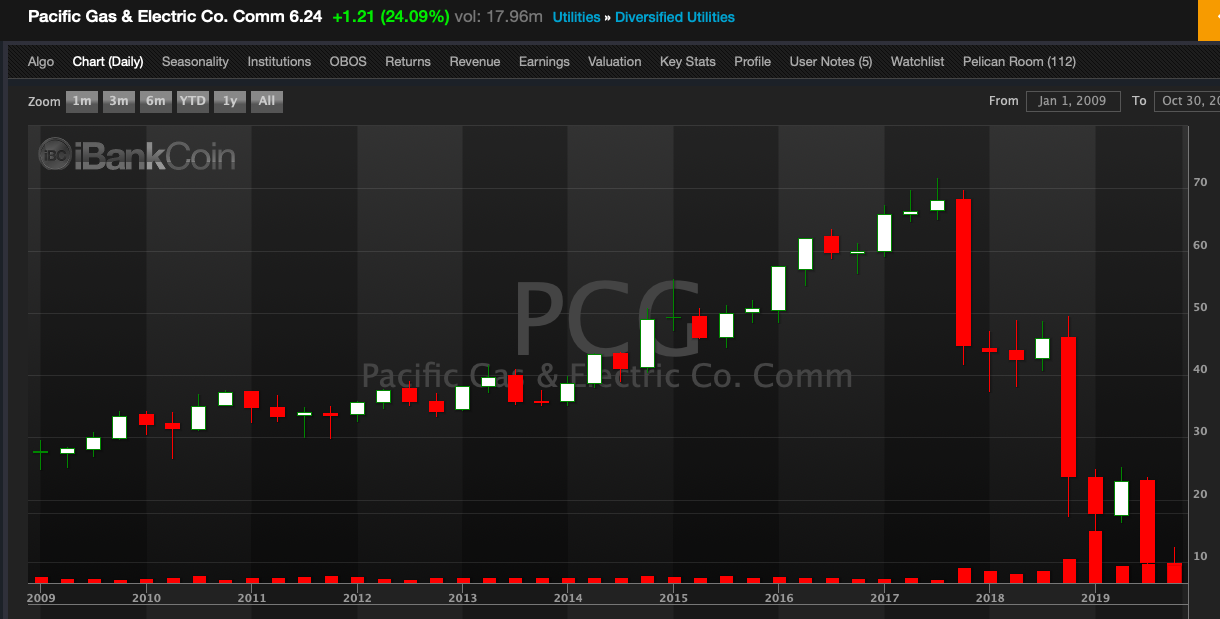
But the stock is down from $70 and what if they make it?
WHAT IF THEY MAKE IT?!
This is the stuff pipe dreams are made from, ordinary guy, blogger, looking at the big stock and thinking about the things he can do with the profits from the big stock. Oh, the dreams of grandeur. I could perhaps buy myself a NEW LAWNMOWER, or even better, A NEW FUCKING BENZ that can break down on me costing my inordinate sums of dollars and incalculable stress, thereby shortening my lifespan to such a degree that buying PCG would be a moot event, a cancellation of sorts as all parties lose under such a scenario.
For the day, I sold ZEN +6.1% and bought two other fishing poles in the hopes of capturing some more fish. I have an eye on markets here for a large move downward and will trade the volatility, as prescribed.
If you enjoy the content at iBankCoin, please follow us on Twitter


Ok, so the obvious question is: WTF would you buy another Benz?
This is the real question
Or here’s another question:.
GDP was released today. ZH has two articles in it. The first article reports on an interesting fact: recent GDP numbers have been heavily supported by consumer spending
https://www.zerohedge.com/economics/q3-gdp-beats-big-consumer-spending-refuses-drop
ZH then dives into the weeds on this:
https://www.zerohedge.com/economics/second-consecutive-quarter-what-americans-spent-most-money
Their conclusion:
“But what was the main driver of spending in the third quarter? Well, for some inexplicable reason, in Q3 the American consumer was scrambling to buy… recreational vehicles.
…
So there’s the paradox: while RV sales are crashing according to makers of RVs, the Bureau of Economic Analysis (i.e., the US government), used this very data set to represent that the US consumer is not only alive and well, but spending more than at any time in the past 5 years!”
In other words, the govt is lying about RV vehicle sales to artificailly boost GDP. This is a completely dumbass theory. Trump outright lies like that all the time, but the government bueracrcy doesn’t. They are much more subtle.
Anybody figure out the real story? The evidence is in black and white, not even hidden: https://www.bea.gov/system/files/2019-10/gpd3q19_adv.pdf
C’mon, there’s got to be at least *one* reader (besides myself) that has figured this out.
I’ll gve you a hint: the ZH article shows RV sales increasing roughly 300k units over the last 10 years. With an $80k estiamted average cost, that’s $2.4B/year, not even close to the $25B annual increase in “Recreational Goods and Vehicles”. Maybe there’s some other items included in that category?
TL;DR: “Recreational Goods and Vehicles” is up because people are buying tablets, laptops, and flatscreen TVs, not RVs which the BEA values “optimistically”
If you could own a house that was priced at $200k 5 years ago, or oen that was priced that hgh today, which would you choose? The house from 2 years ago in most cases because inflation has probbably propped that house to a higher value today. So priced in “2012 dollars”, the old and new house might be the same when you factor in infaltion. Maybe the $200k house in 2020 is only worth $180 in $2012 dollrrs
However, If you were given the same choice about a car 2015 car (with 0 miles) orignally priced at $25k, or a 2020 model priced at $25k, in most cases the newer car woudl be the better value because features are dropping so fast. With electronics, the price drops and value increases are happenning even faster.
So if you took GDP as a measurement of the socio-economic size of the economy, then it might make sense to say that a $1000 TV adds more ebenefti today than the same $1000 TV added 5 years ago. So the BEA takes this in mind, and now the $1000 2020 model TV is actaully worth $1200 in 2012 dolalrs – increasign isntead of decreasing as the house (this effect is quantified in the negative values of the price index changes in Table 4 of the GDP report). Again, this is a fair thing to do *if* you want to measer the social effect in dollars. However, the priamry purpose of GDP is to measure the purely economic, monetary state of the economy.
Simply put: selling a $1000 TV today does not put $1200 more purchasing power in the hadns of retailers, manufactures, or employees.
If you look at Table 3, you can see the economic value the BEA assigns to various quantities in current dolalrs as well as infaltion/value adjsuted 2012 dollars. Again, you can see that while the value of most line tiesm goes *down* by 10-15%when it is priced in 2012 dollars, the value of “Durable goods” goes *up* by 10-15%. So in essense, the BEA credit a $1000 TV or laptop as a $1200 sale, and a $25,000 car asa $28,000 one.
Ifyou correct for this and factor this in and use the same inlfation/price adjsutment for durable goods as , then the GDP numbers look considerably different:
2019q1
durable goods, as reported: +0.26%
durable goods, adjusted: -0.85%
GDP, as reported: 3.10%
GDP, using adjusted Goods: 3.08%
2019q2
durable goods, as reported: 13.0%
durable goods, adjusted: 7.55%
GDP, as reported: 2.01%
GDP, using adjusted Goods: 1.42%
2019q3
durable goods, as reported: 7.64%
durable goods, adjusted: 4.20%
GDP, as reported: 1.92%
GDP, using adjusted Goods: 1.55%
I’m totally with you on $PCG, but I’m thinking debt instead. How can the only electric company actually default? Who’s going to generate the electricity????? It’s that easy.
$PCG have filed Ch 11 twice as a public company. Versus the legal liability overhang the current equity value is an “odd lot”. A couple of hedge funds are in the debt play for size, but this ticker would make crypto seem stable. The whole stack has been made defunct here, contractors clearing lines have had judgements >200mm and are all tapped out. Skull and cross bones …. better opportunities.