iBankCoin
Home / 2013 / April (page 5)

Monthly Archives: April 2013

Today Portfolio Adjustment (04-09-2013)

Today was an interesting up day.

$BCRX opened down and I sold to take small losses.  Yes, it was a gain yesterday and I gave it all back; but that was the deal I was going for when I decided to hold instead of taking profit.  In other words, I was gambling with my yesterday paper gain for a bigger win today.  My bet was wrong so I bailed first and then sat back to see what was happening.  What happen after I sold was that price filled the gap from yesterday and settled down before climbing back slowly to the 1.7x area.   Once I saw the gap was filled, I bought back a starter position around the low $1.7x and put a stop below the intra-day low.  I was not stopped out when market closed.

Next, $DCTH was down due to news of their laying off people to reduce cost.  This was a mixed bag of news but I sold my whole lot quickly and waited for price to settle down.  To me, cutting cost is always a good business move; thus, once the selling was done, I bought back a starter position to see if it would go back up.  I was not stopped out when market closed.

Giving that both $DCTH and $BCRX was not faring well at the open, I took my money out from $MNKD when price began to trek lower after heading up.  I got out at breakeven.  Later, $MNKD trekked back up but I chose to ignore it because I wanted to scale back on the number of biotech stocks.

$SZYM acting like it wanted to go back up badly so I began to add more to my position to slowly build it back up to where I was before.  I’m not giving up on $SZYM yet.

$FB continued to correct but I was feeling that it might begin to turn today based on indicators on 15m and 3m charts; therefore, I bought back $FB shares and my stop was not hit when market closed.

With market continued to soar in the latter half of the day, I decided it was time to buy back $DDD, $CHK, and $DNN.  I bought all three even though they were already up most of the day.  I didn’t buy $CCJ because I didn’t see the “calling” from the chart.

I also bought starter position on $PACB to take advantage of today correction from yesterday jump.

I’m still holding the $S, $AIG, $APRI from yesterday even though they were correcting a little bit today.

Current holdings:

LRAD, AMRN, SZYM, TINY, DDD, APRI, FB, CHK, AIG, S, PACB, DCTH, BCRX, DNN and 28% cash

My 2 cents.


Comments »

Dilly-Dally is over, we are going up!

Take a look at the $SPY daily chart below:

It looks strong and convincingly bullish.  There is no if or but; we are going up.

SPY_Daily


I’ve bought back $DDD, $CHK, $DNN, added more $SZYM to my portfolio.

My 2 cents


Comments »

Today Portfolio Adjustment (04-08-2013)

Today was like a box of mixed chocolate.

Ding! Ding! Ding!

Market bell rang and I watched $BCRX gapped up, I bought some at the market open and watched the price climbed to the high of $2.21 before coming back down to the $2.00 level.  After finding out that China approved $BCRX’s Peramivir, I decided to add some more before the market closed.

I saw $MNKD had a neutral to a positive bias open so I bought some since I wanted to be in when there were no collapse happening.

$FB was fighting a downdraft and I saw the price action was tracking half-way point of Friday candlestick bar; sticking to my rule, I sold it for small losses.

$APRI opened strong and I wanted back in; therefore, I bought back starter position on $APRI even though I paid more than I sold for in the past.  Seeing that price stayed strong on the positive side all day, I added more later in the day.

$DCTH opened down and stayed down.  Seeing some bargain, I bought a starter position on $DCTH after seeing some huge bids supporting the price even though it was down quite a bit in the morning.

I also wanted to go back in $S and the chart looked like it was continuing on its breakout mode; so I bought back a starter position.

$TINY was also acting bouncy so I bought back some shares I sold earlier last week with the intention to buy them back lower.

I also bought back some $SZYM after seeing that it was actually trying to rally in the morning.  I don’t want to be without this stock when it decides to climb back up so I’ve bought back some shares.

I was browsing the “Smart-list” watch list to see which ones are ready to move and I found $AIG enticing; therefore   I bought a starter position as well.

By the end of the day, $APRI and $AIG did well and $BCRX was correcting a bit from its high but I was still in the money, so no sweat.

Current holdings:

LRAD, AMRN, TINY, APRI, SZYM, AIG, S, BCRX, DCTH, MNKD and 44% cash.

My 2 cents.

@tradingmy2cents

The trades I made in the journal were time-stamped in twitter

Comments »

The revival of $AIG

With real estate related stocks going back up almost every week, you have to admit that $AIG will have to come roaring back eventually.  Yes, it was mortally wounded before but it was brought back to life from near death by our esteemed Gov’t doctor.  I see $AIG is walking here and there and doesn’t look like it is dying.  What you say?

Hence, I bought a starter position on $AIG; maybe even for a long-term hold, what say you?

Below is the $AIG daily chart:

AIG_daily


Both indicators below are turning up!  Did I mention that $AIG is in the “smart-money” list provided by The Fly earlier?

Below is the daily chart ETF-real estate $IYR:

IYR_daily


Look at that uptrend! Woo! Woo!

My 2 cents.

Comments »

A decision with nothing to lose

BioCryst Pharmaceuticals Rises 20% Pre-Market on China Approval of Peramivir Sodium Chloride Injection

Think about it, the mortality rate of people catching bird flu is high; so by approving Peramivir, China has nothing to lose but everything to gain for $BCRX.

It is a gamble I’m willing to bet; therefore, I added more at open.

What do you see in the daily $BCRX chart below?

I see a rocket ship getting warm up to launch.  No, it hasn’t been launched yet.  If $BCRX’s Peramivir proves to be effective in controlling the outbreak, you won’t see parabolic move, you will see something entirely different.  However, don’t forget the downside risk is there too if Peramivir proves to be ineffective.

BCRX_daily

I’m thrilled; this bet saves me a trip to Vegas.

My 2 cents

Comments »

The secret to the Holy Grail trading system

Before I tell you the secret to the Holy Grail trading system, let me tell you a story about my experience in learning kung fu when I was in high school.  There were quite a few bullies in my school and I wasn’t going to make it easy for anyone of them.

“There are only four basic movements I’m going to teach you,” said my teacher.  I was already depressed because four movements did not make an exciting repertoire here.  How am I going to impress my friends with only four movements here?  I was thinking to myself.

The four movements were deceptively simple.  You alternate the two attacking and two defending movements between your partner and yourself on a non-stop back and forth movements until the instructor tell you to stop.  To tell you the truth, it did get boring after awhile.  

“When am I going to learn the other variations besides these four movements?”  I kept asking the instructor.

“Don’t worry about the other stuffs, master these four movements first.”  was his reply every time.

“90% of the time, these four movements will get you out of the jam in any physical combat situation,” my instructor kept drumming it into my head.

But as I pushed through these weekly training, I began to realize the wisdom of the exercises.  My speed for the movements became faster and smoother.  One day, one of the bullies was trying to intimidate me by throwing me an air punch very close to my face; without thinking, one of my practiced movement came out to block the punch at the same time my body was already moving on to the next movement of attacking which caught him by surprise that he almost fell over backward.  It spooked the hell of the bully that he never ever wanted to get near me again.

My confidence shot up and I walked like I could take on any bully that came my way even though they were much bigger in size than I was.

In summary, by mastering these four simple movements, I became my own body guard.

Ok, great story, but what is the secret to the Holy Grail trading system?

Patience, grasshopper.

When you are your own body guard, your job is to observe and protect.  Thus, if you really know your stuff (like Bruce Lee), your experience and skill set, coupled with the powerful processing power inside your head, will turn you into an ultimate body guard that can defend yourself in any physical combat situation (that doesn’t involve gun, of course).  Your mind will size up the environment, the strengths and weaknesses of your attacker(s), and apply the proper fighting movements to counter the attack.  You become your own Holy Grail fighting machine.  Do you know Bruce Lee actually created his own fighting style?

Basically, my point is that the Holy Grail trading system is you.

To become the Holy Grail trading system, you need to master the basic movements of technical analysis in a manner of speaking.  Below are my personal take of the four technical tools/movements that we need to master:

1st movement: understanding price action.

2nd movement: understanding support and resistance

3rd movement: understanding moving averages

4th movement: understanding momentum indicators
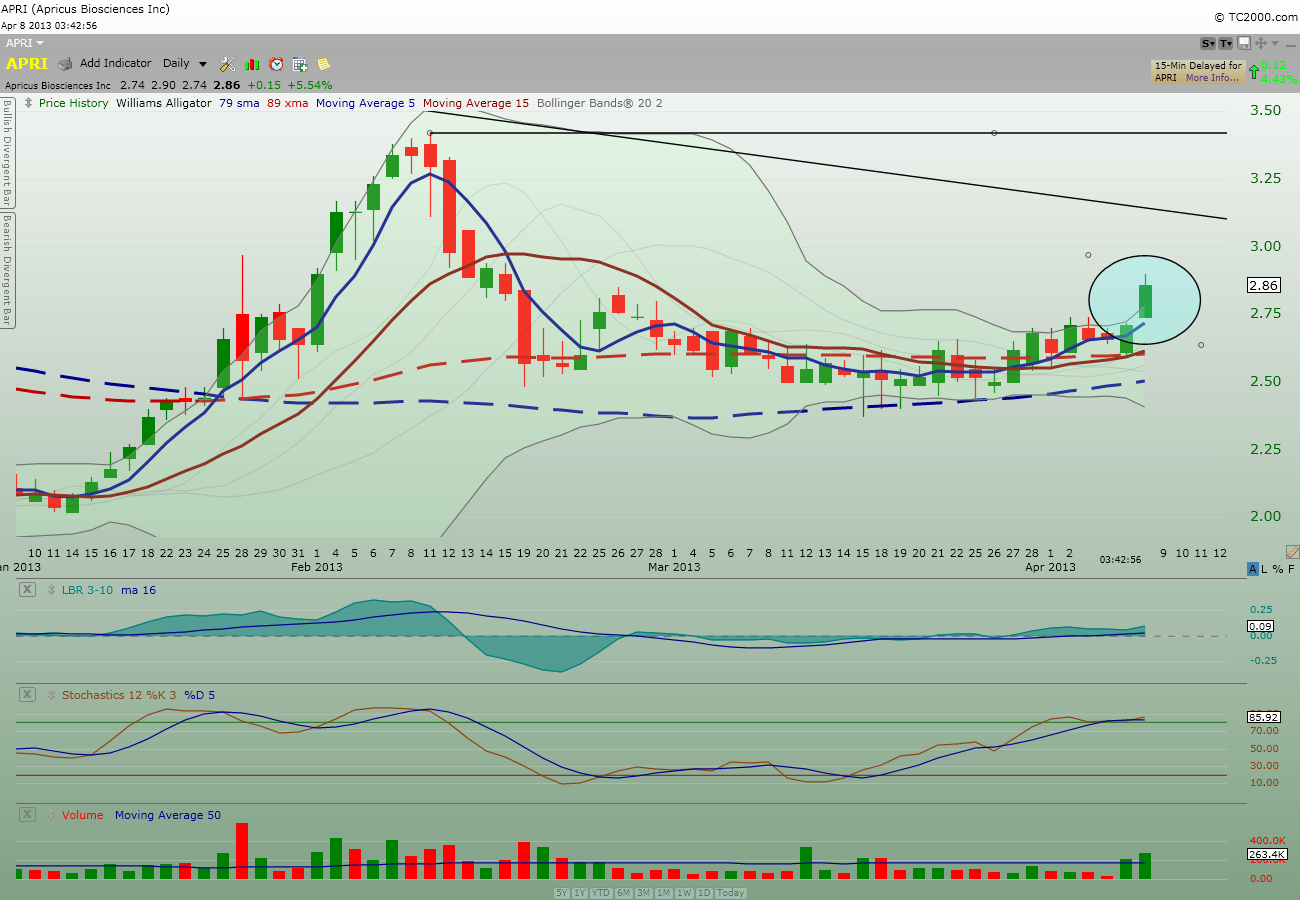
1) Price action:

I prefer to use candlestick chart and all the candlestick patterns that have been identified by the Japanese for hundred of years.  Candlestick is just one of the price action tools, there are many other types available such as Heikin-Ashi, Three Line Break, point & figure, market profile, etc.

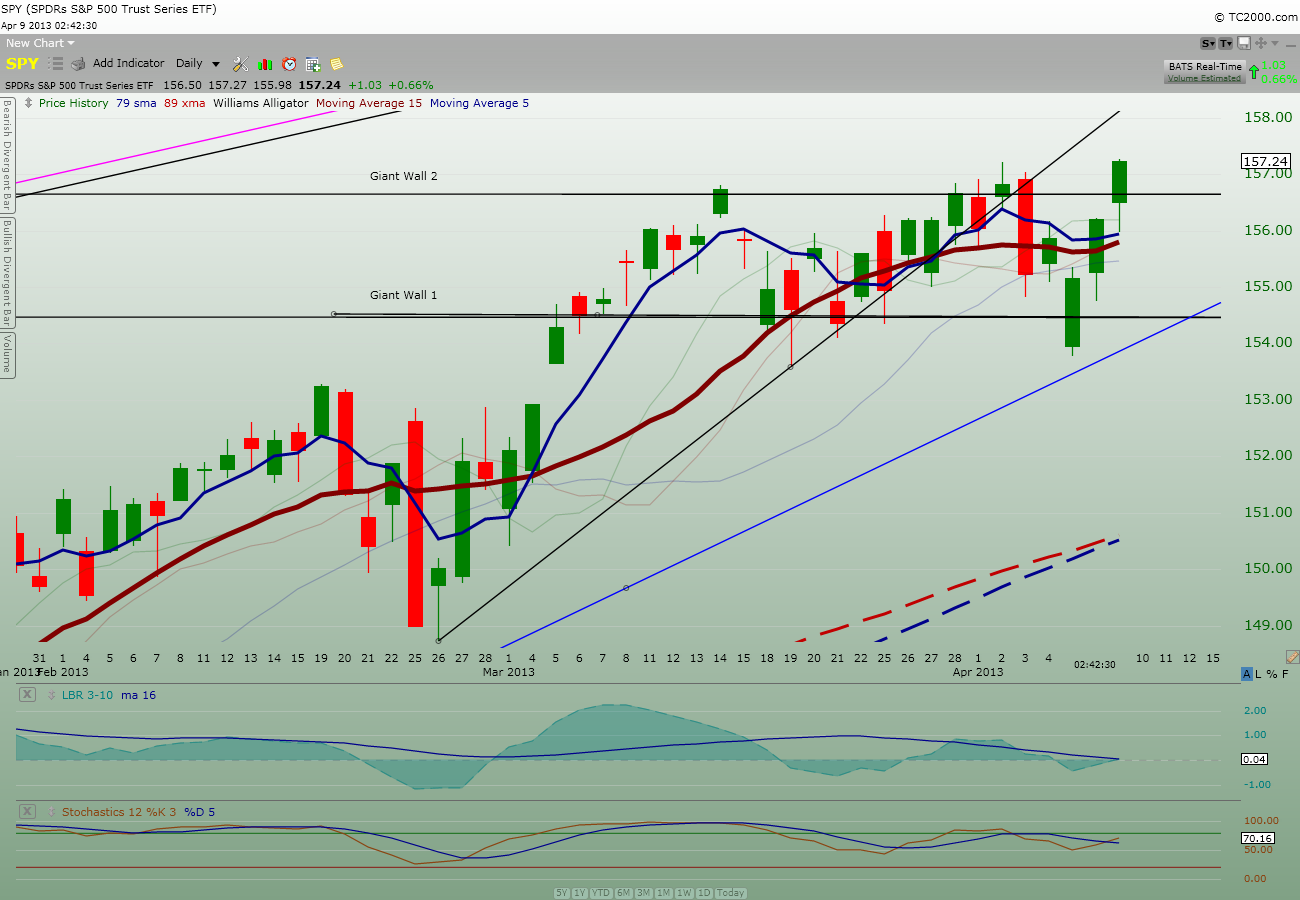
2) Support and resistance.

There are many way to look at resistance and support.  I like to use previous year, month, & daily high and low, pivot point calculation, high and low of historical valley and peak, high and low of consolidation areas, trend lines, and Fibonacci calculation.  I’m sure there are other ways to observe support and resistance that I’ve not mentioned here.
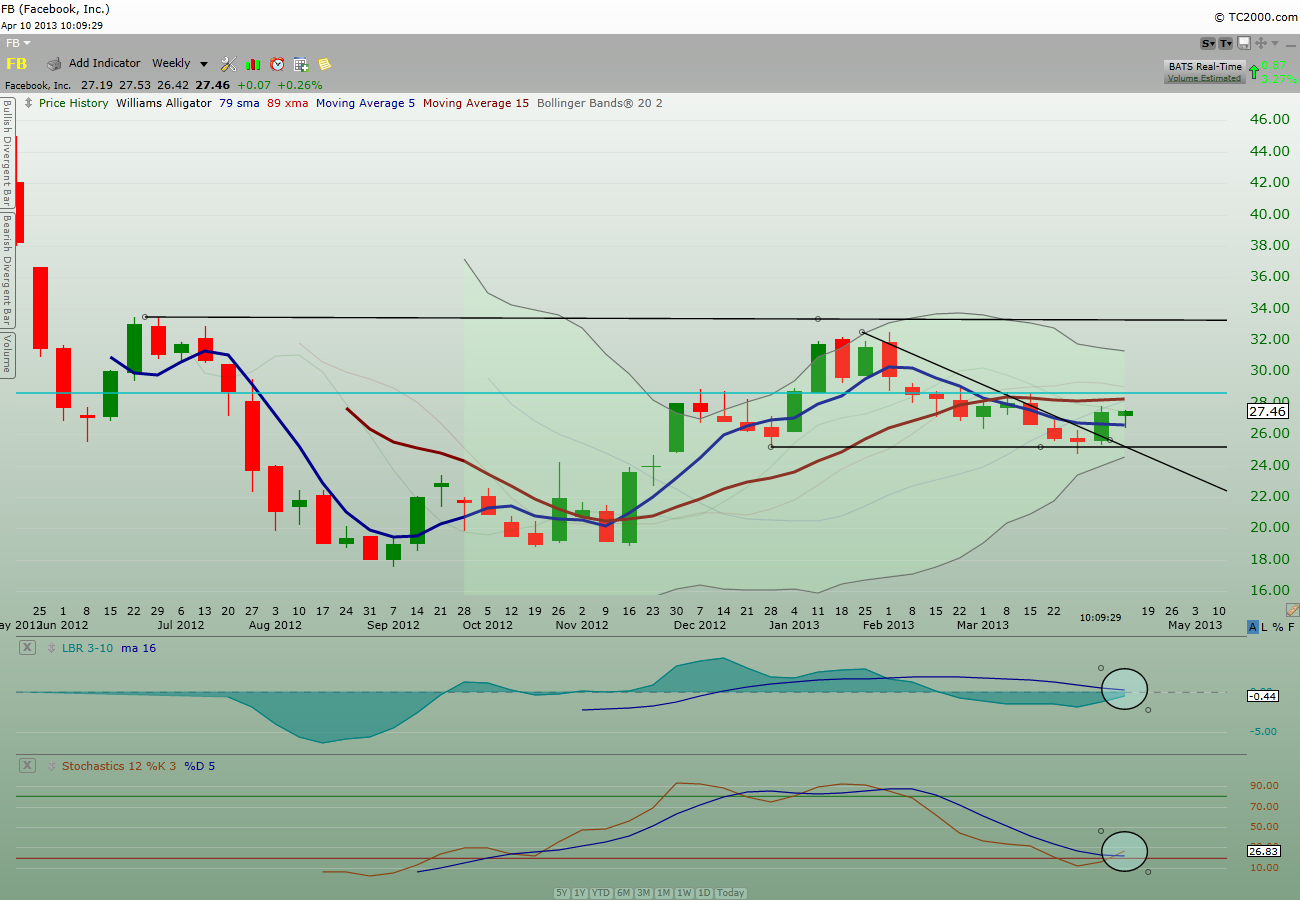
3) Moving averages

There are many variation of moving averages (ma) including those with offset.  I have tried ma offset (popular among Joe DiNapoli with his 3×3, Bill William’s alligator, etc) .  Offset or not, they all say the same thing, the less the number of days (or time units) you used to calculate moving average, the faster the line.  And the faster the line, the more cross you will see (either with another ma or price action)  But then the faster the line, the more whipsaw you will get if you take every signals.  And if you don’t take every signals, you will have to know which signals to choose from the multiple signals which is something you want to avoid.  Therefore, there is an optimal number for each one of you based on your personal preference and tolerance.  Personally, my choice of ma changes from time to time.

4) Momentum indicators

Momentum indicators tell you the strength of the current bull or bear.  By themselves, they do not tell you if the overall current trend is over or not.  It simply tells you that the bull may be getting tired or getting hyper.  The momentum indicator may also help you identify the development of peak and valley of an on going trend.  I like to use MACD and stochastics and I change the parameter on the indicators from time to time as well.

These four movements are my personal interpretation of what are important to me as a trader, it is not necessary the required movements to be successful.  Some greater trader may focus only on price action and nothing else.  Some may only use a few of the above.

I remember reading that the Grand Masters of Tai Chi Chuan was so powerful in their art that they were able to condense their skill to a few simple movements.  No matter how you attack them, all they did was to simply flip their hand, a simple shake of their body and you would end up flying across the room.  In the same token, a master trader can take one look at the chart (or the tape for those tape reading connoisseur) and know if the stock is a buy, a sell, or neutral and is correct 7/10 of the times.  They don’t even need to look at ma, indicators, etc. for these information are already absorbed in their observation of the chart.  In other words, just by looking at the chart, they know exactly where the ma line will be and where the level of momentum indicators are without having to see them visually.  Like a grand master chess player, he doesn’t need a chessboard to play chess, he can see all the possible moves and counter-moves all in their head.

If you’ve read “Reminiscences of a Stock Operator”, you know that Jesse Livermore could read the tape like a chess grandmaster read a chessboard.

Putting it all together

While there are many different styles of martial art; there are also many different variations and styles to each of the four type of trading tools discussed above.  We each have to find the style that match our personality.  How do you know which style best fits you?  The only way you will know is by trying out different technical tools you come upon until you find the ones you are comfortable with.  You will know which ones don’t fit you when you find yourself annoy by the indicators every times you open the chart.

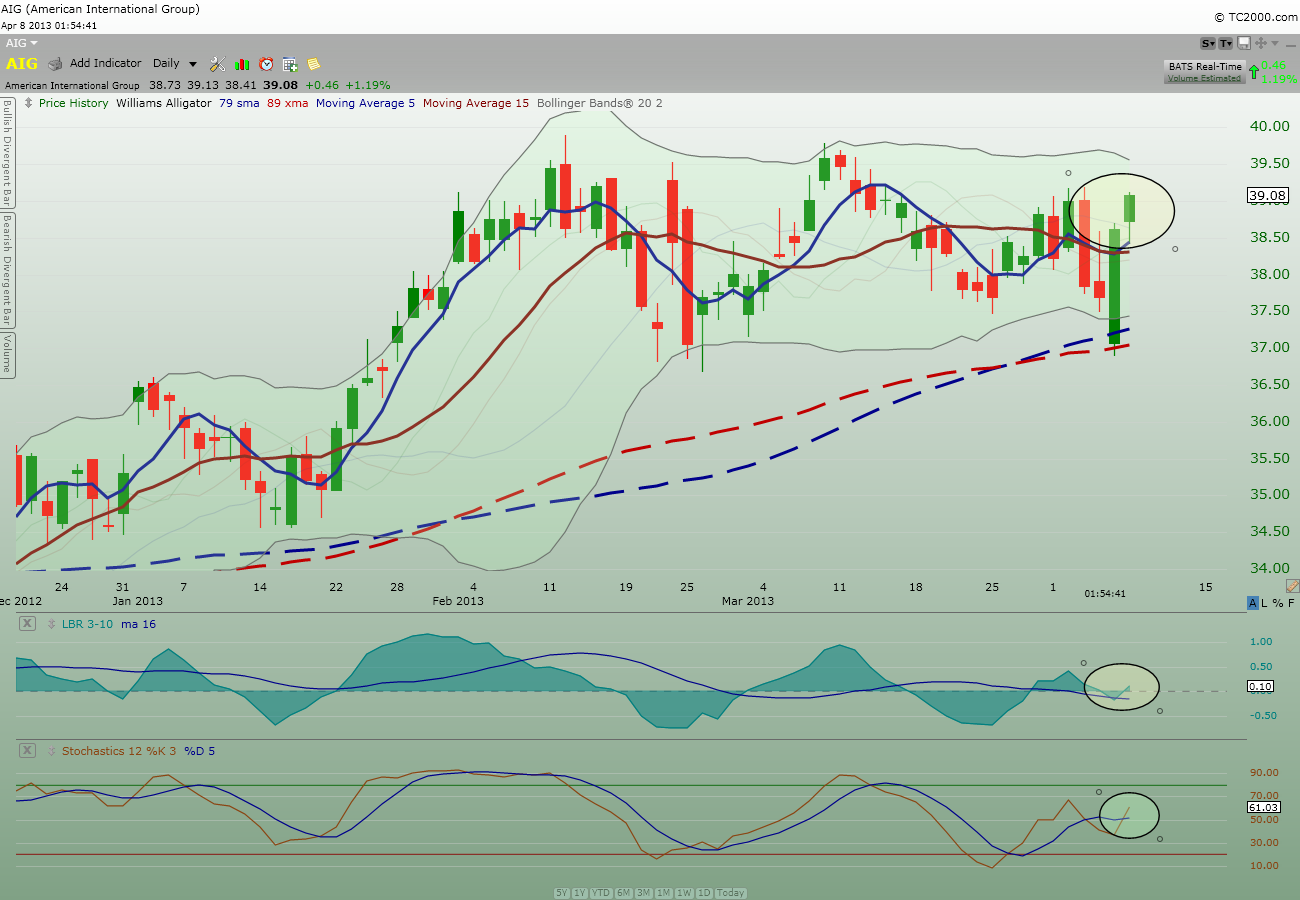
Once you master the the technical tools mentioned above, that is when you come into the picture.  You are the quantum computer that will bring these four movements together and calculate the next action/decision to execute.  Your eyes, brain, mind, psyche, and your heart will process the data and alert you to a stock with a good risk/reward ratio.

I know some of you are keenly aware of this processing power because you’ve experienced it.  You saw the signal based on everything you learned.  You said to yourself, “price will take off from here“.  And Voila, price actually took off like you predicted.  Now, you might or might not have taken action based on this observation; but you know I’ve made my point here.

Here is a key reminder to this Holy Grail trading system- there is NO SHORTCUT.  Meaning you need to work very hard to achieve this.  If you think you can read a few books, watch a few video, spend little to zero time in reviewing the charts, and still become a Holy Grail trading system, forget it.  Working hard means you spend hours and hours going over the charts to see how price action interacts with the ma/indicator you are interested to become a master of.  You spend hours and hours of reading charts to see the relationship b/w price action, ma, indicators.  You raid the bookstores and libraries to find related subjects on the technical tools you are interested in; you also want to read up on the thought of other professional traders to see how they think.  You research for a software charting program/package that fit your needs so that you can practice, practice, and practice trading using the simulation module in your charting program during off-market hours. You document your progress by daily journal so you can become aware of your own strengths and weaknesses. You never stop learning from others because you are always interested in seeing things from a different perspective.  In fact, it becomes a continued education that you are never tired of.  In other words, trading successfully is your life goal.  It doesn’t matter how early or how late you start your trading endeavor, you need to make this your life goal.

For those of you who are/were doctors, lawyers, CPAs, and professional in all manner of occupation, you know what I’m talking about.  You need to put the kind of commitment to trading you’ve put into your career.  Do you know there are doctors out there who are successful traders?  They are successful because they’ve invested the kind of commitment to trading as they’ve done to being a doctor.

Having said all the above, there lies the ultimate obstacle to implementing your Holy Grail trading system successfully- your EGO.

Ego = greed = fear = I’m right and the market is wrong!

Eventually, Jesse Livermore, despite being a Grandmaster who possessed the ultimate quantum computer in tape reading in his head, were doomed by his ego.

So how do we deal with the ego?  It won’t be easy; why do you think the giant hedge fund invested so much into quantitative trading?  The way I see it, if we can put our own ego aside, there is no computer out there that can do a better job than the quantum computer inside our head.

The ego issue will have to be dealt with more posts in the future.

My 2 cents.

Comments »

Today Portfolio Adjustment (04-05-2013)

Today was a “fool me” day.

With the payroll data came out bad, market was down big before open.  Naturally, to preserve my capital, the prudent thing for me to do was to sell all my swing trades at the open in case the carnage turned out to be a colossal waterfall price action.

I placed all my sell order at market on open and was filled within 5 minutes of all my swing trades.  I sold $APRI, $CCJ, $DNN, $DCTH, $IMUC, $MNKD, $POT all for small losses and locked in gain on $FB.

Then, as usual, I would be faced with situation when the waterfall situation didn’t happen.  $FB began to climb as well as $IMUC.  Did I kick myself?  Of course I kicked myself but only for a brief moment.  Hey, I’m not a robot just in case you haven’t noticed.  Giving that the market was still down all morning, I wasn’t about to jump back in to buy anything.

I didn’t think $FB rally would hold so I waited for an opportunity to short.  When I saw a bearish engulfment bar completed in a 15m chart, I implemented the short and was successful in banking a few coin using trailing stop.  Afterward, I tried a couple of scalping trades on $FB (one long and one short) but was stopped out for tiny losses.

To me, scalping (with small number of shares than my usual swing trade size) is a good way to work out your boredom without hurting yourself.  It keeps your mind occupied so you don’t go looking for some big fish to fry when there isn’t any.

Next, I saw RaginCajun’s post on Bird Flu play so I bought some $BCRX since someone recently also told me about the bird flu coming back in China.  Later, I added more when price started to jump up.

$FB began to act up after consolidating in the low $27.xx area.  I bought back a starter position when price action took out the high of the previous 15m bar.  I placed a stop below intra-day low but was not stopped out when the closing bell rang.

For some reason, I decided that if we were not getting a waterfall action today, we might get it next week.  So I bought $FAZ to hold for the weekend.  Lo and behold, not long after I bought, $SPY began a strong rally and before I knew it, I was stopped out of $FAZ for a loss.  Ouch!

At the end of the day, I still hold 63% cash which was what I wanted to hold anyway for the weekend.

I noticed that $SZYM spiked up into the close; I will keep an eye on this on Monday for a possible buy back of my position provided that the market do not go with another bearish convulsion.

If you have been reading my journals, you know that I’ve been taking plenty of small losses these days along with some locked in gains.  The gains were usually much larger than my small losses.  But the small losses do add up as well as the commission.  Giving that the last month trading activities being locked in a consolidation range, these multiple small losses were to be expected and I don’t hold this against my trading process.  Remember, we only knew about the consolidation range after the fact.

Eventually, when the stocks begin to run again, either up or down, all I need is to catch one of the runners and I will be banking coins in no times.  Thus, as a swing trader, I’ve to be active to catch that elusive runner when it happens; hence the constant small losses I’m taking now and will be taking in the future.

Current holdings:

LRAD, AMRN, TINY, FB, BCRX and  63% cash.

My 2 cents.

@tradingmy2cents

The trades I made in the journal were time-stamped in twitter

Comments »

“We ain’t gonna rollover yet” screamed the BULL

Impressive comeback for the bull.  Instead of a continuation of a downtrend based on time-of-day, the bull decided to take charge and run-over the bear to close the day with a real nice green bar that would close above the GW1 support.

My foray into $FAZ was quickly cut short when my stop was hit which I totally didn’t expect it would get hit.

Below is the strong bull $SPY chart:

SPY_Daily


My 2 cents.

Comments »