iBankCoin
Home / 2013 / April (page 4)

Monthly Archives: April 2013

Today Portfolio Adjustment (04-12-2013)

Today was like a lucid dream day.

Market opened down and $FB was fighting for its position.  Unfortunately, price action took out half-way point of yesterday bar, I took profit per my rule.  (what? you forgot my rule?  Here it is again: if price action take out half-way point of the previous daily bar, I’ll either cut loss or take profit.)

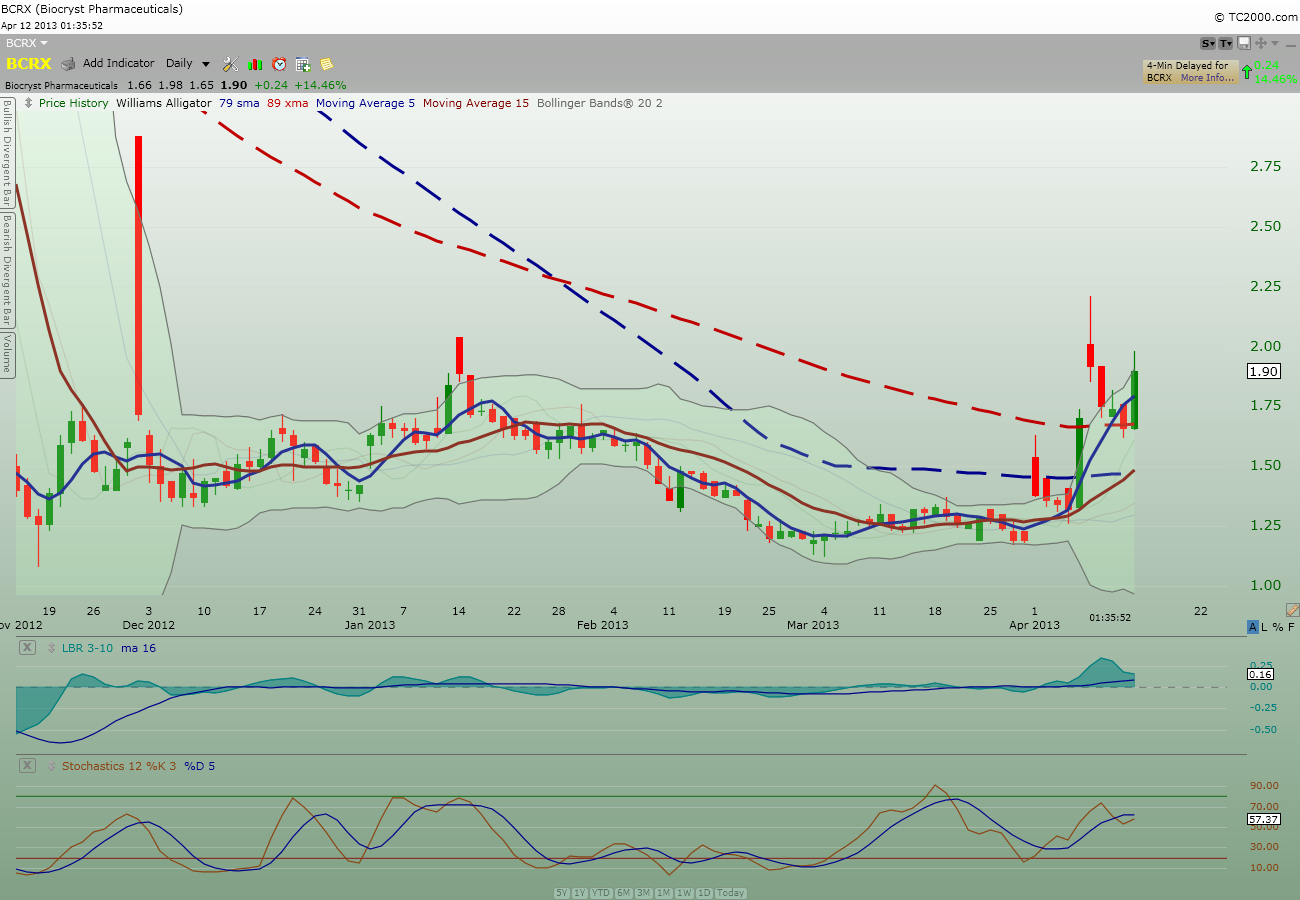
$BCRX opened neutral at first and then it became a runner.  I immediately added $BCRX as it ran and added some more when the runner wouldn’t stop.  By the time I was done adding, I’m holding 110% of my original size.  Latest news was that China had more death from the bird flu and the crisis was far from over.  I’m betting that $BCRX is the cure China is looking for.  I read that some people was claiming that the Peramivir China was looking for did not come from $BCRX.  However, when you goggle Peramivir, you will see this:

Peramivir
From Wikipedia, the free encyclopedia
Peramivir

Systematic (IUPAC) name
(1S,2S,3S,4R)-3-[(1S)-1-acetamido-2-ethyl-butyl]-4- (diaminomethylideneamino)-2-hydroxy-cyclopentane- 1-carboxylic acid

Peramivir is an experimental antiviral drug developed by BioCryst Pharmaceuticals for the treatment of influenza. It has been authorized for the emergency use of treatment of certain hospitalized patients with known or suspected 2009 H1N1 influenza.[1]

The Peramivir drug name comes from BioCryst, so I don’t know who else can claim that name?

Since the market was tanking, I also put a protective stop on $AIG below yesterday low to protect profit.  I was stopped out later.

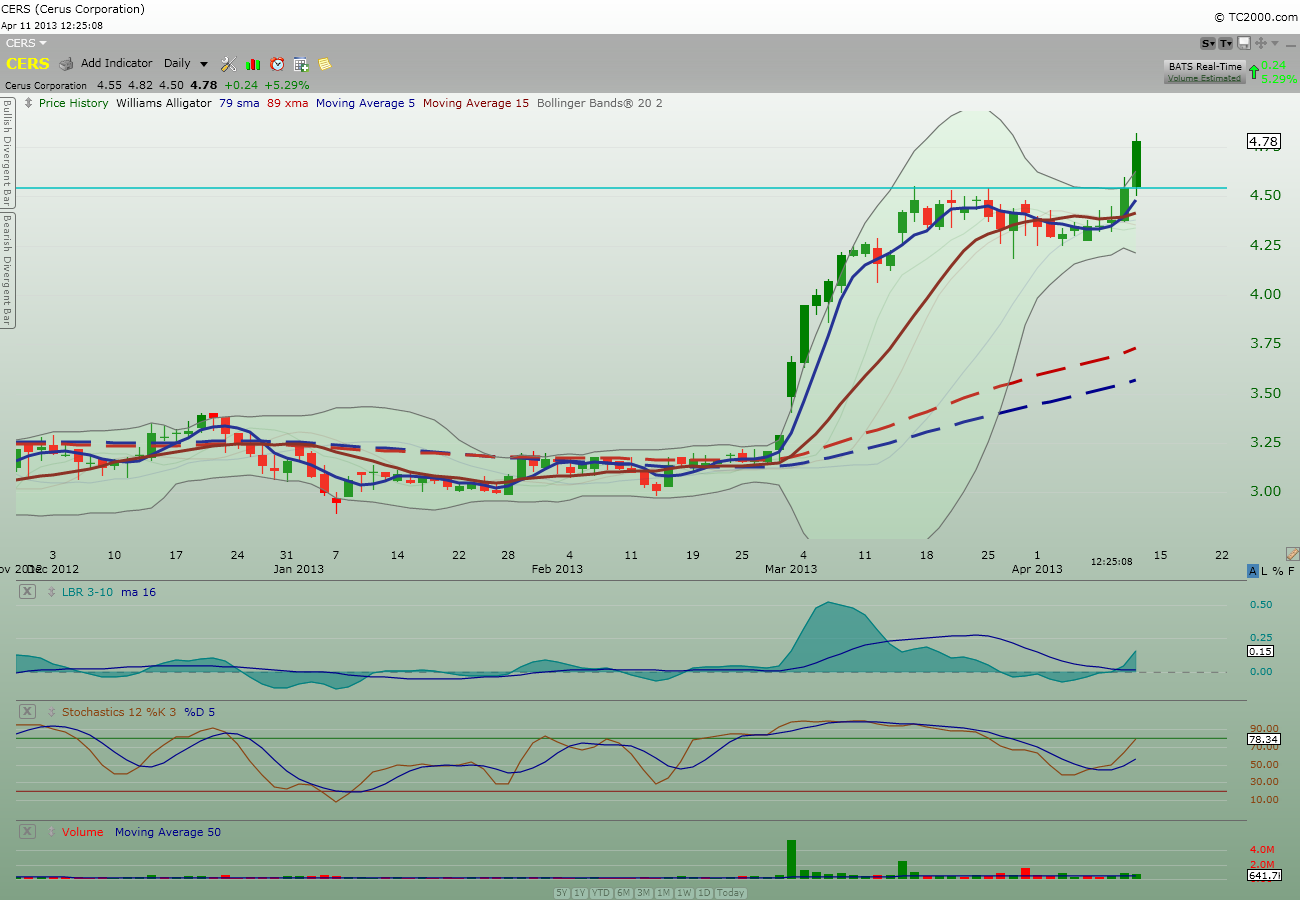
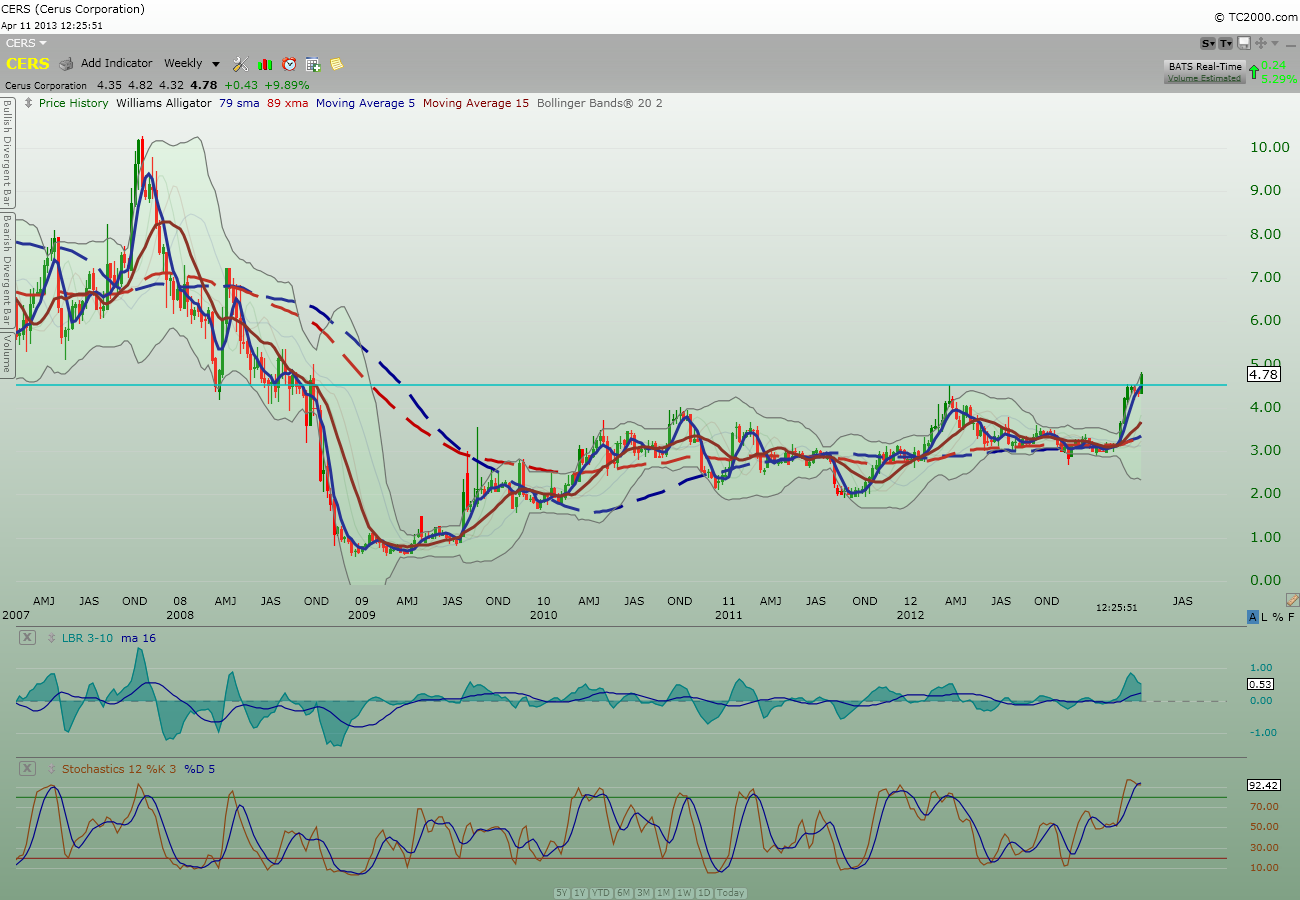
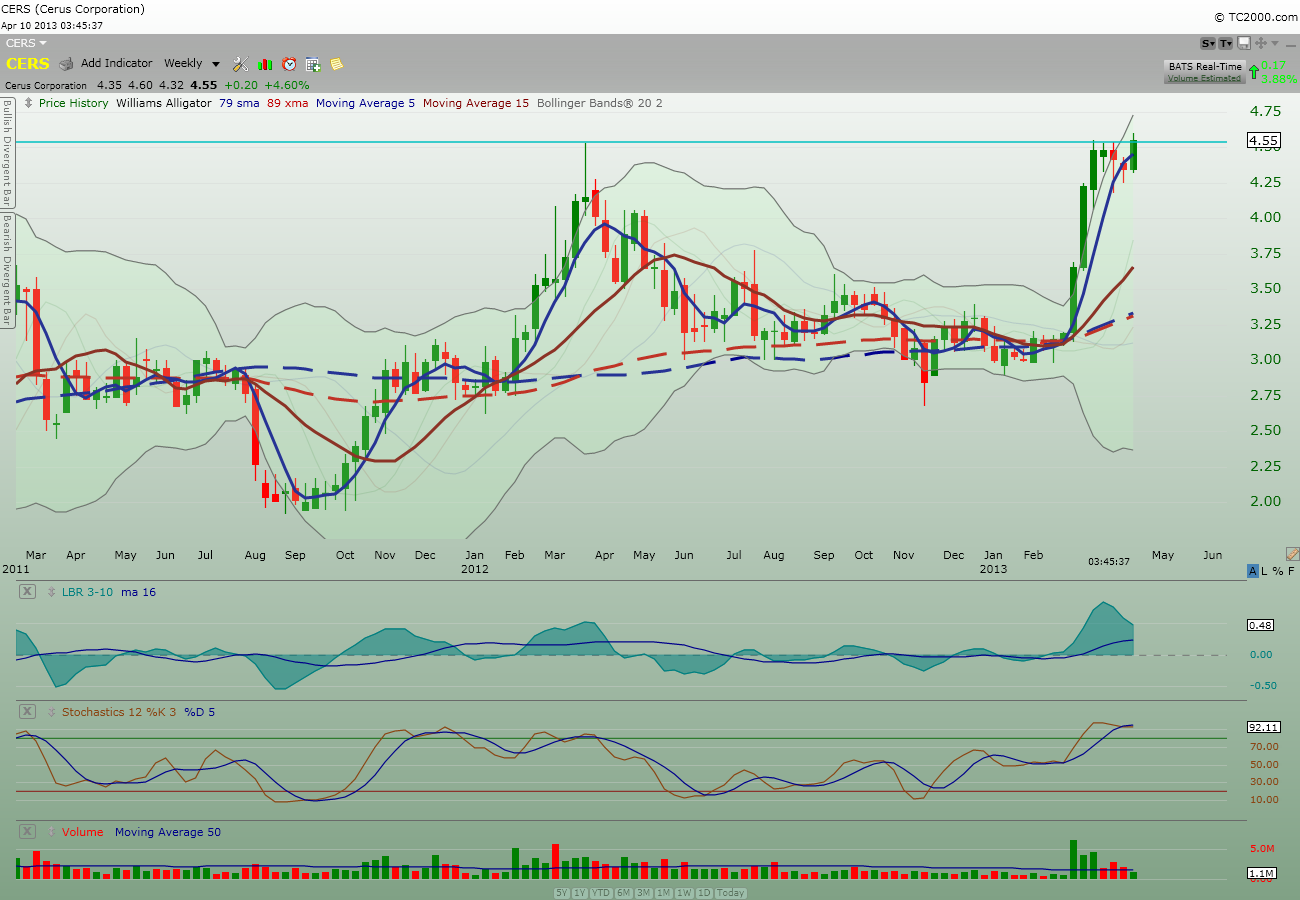
$APRI meanwhile was taking heat so I unloaded shares to minimize exposure; however, later in the day when price action climbed back up, I bought back some shares I sold earlier.  I did the same with $CERS; sold some in the morning and bought them back later.  Yes, I bought them back at higher price.  And yes, that was the cost of my playing safe.

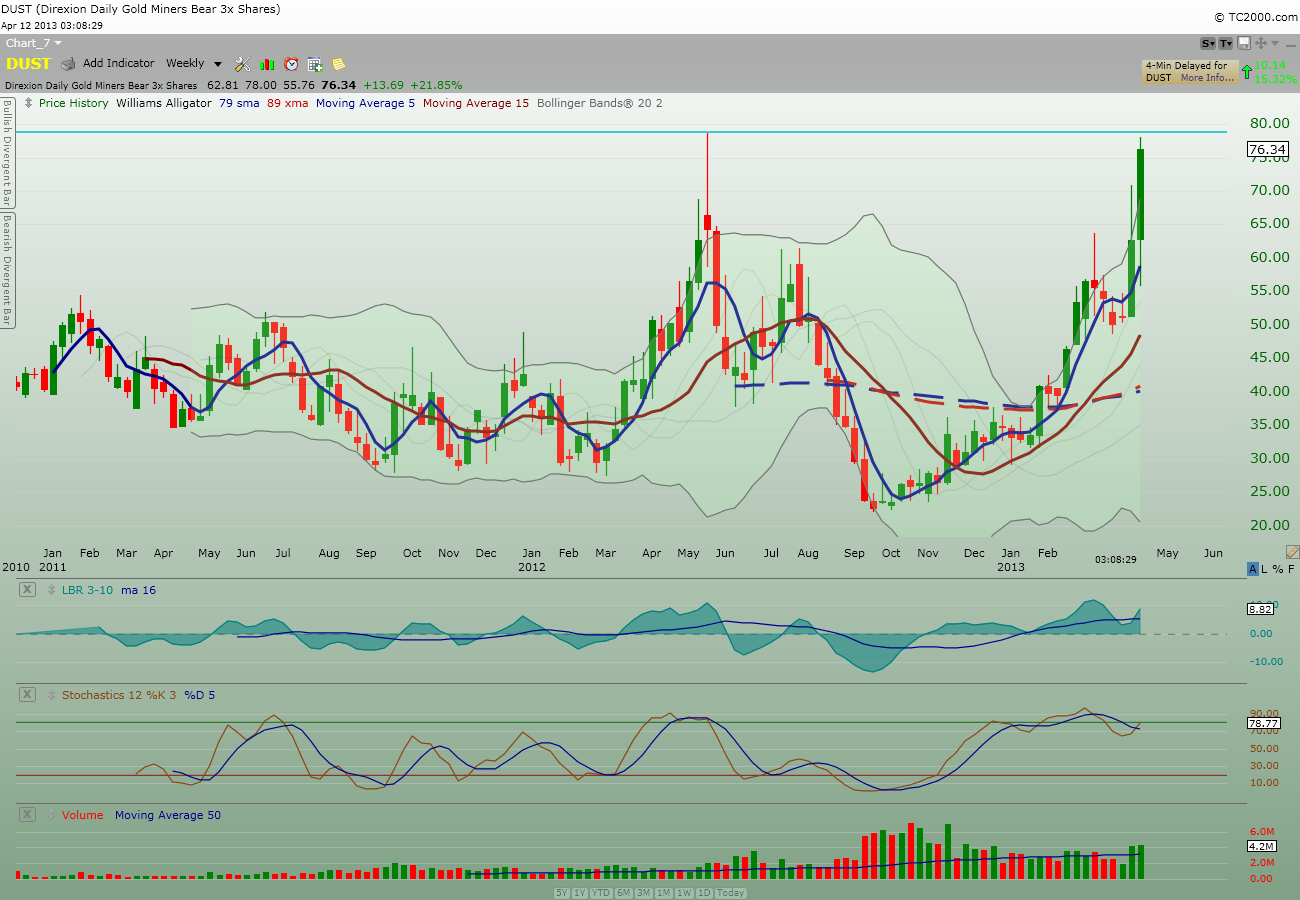
Later on, after seeing that gold and silver had been taking to the cleaner, I took a look at $DUST chart and found that it was reaching for the price of previous year high.  Having seen that, my intuition told me that price action might take out that high very soon.  Thus, despite $DUST being up all day already, I bought starter position to chase it.  Fortunately, price continued upward and I ended the day in the money.

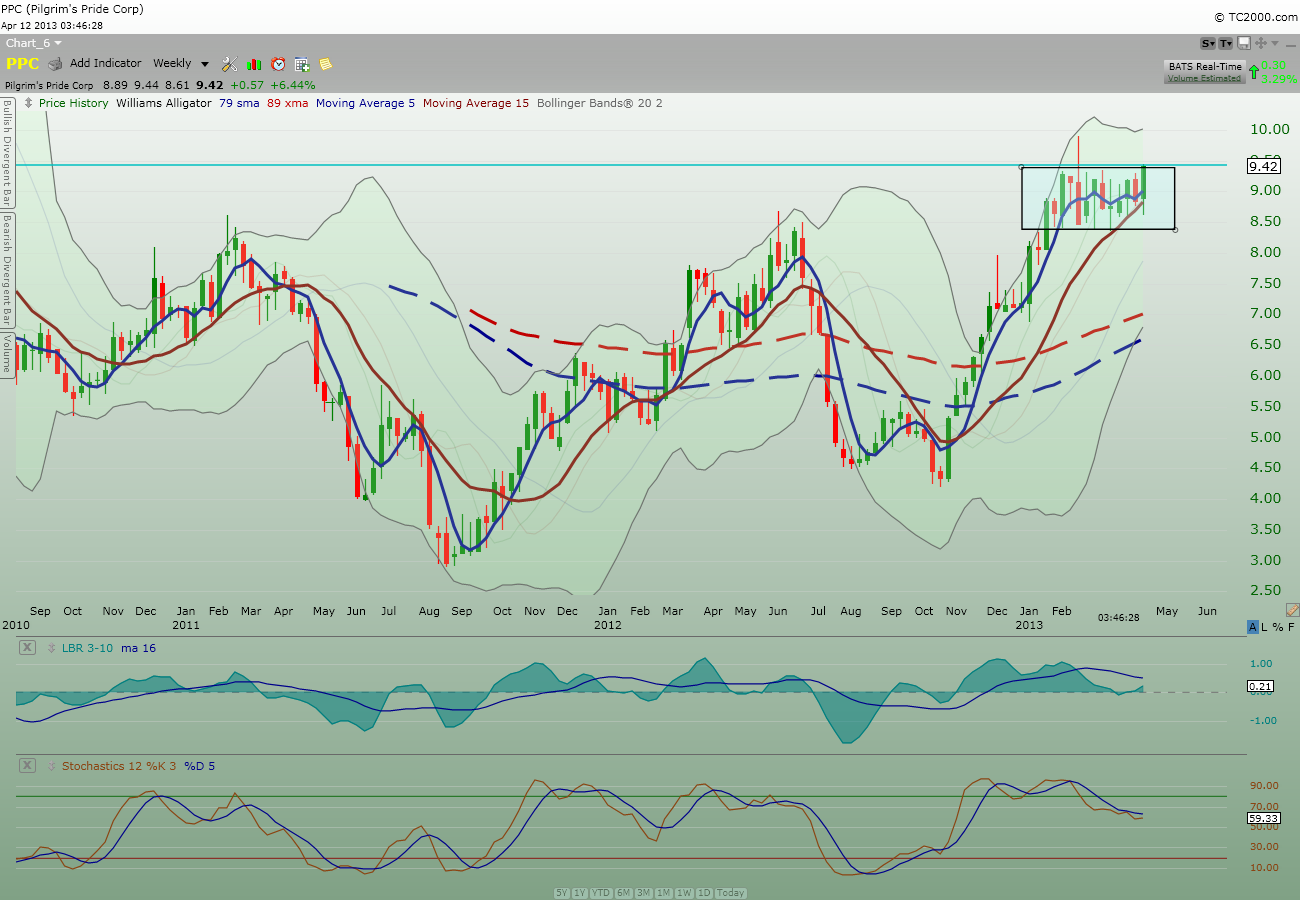
Then, Vertigo from here alerted me of $PPC.  I took a look at the chart and it was a no brainer.  My quantum computer saw the chart and it literally moved my hand to the keyboard and mouse to execute the buy order.  I bought the starter position looking for a breakout to the upside next week.  $PPC had been consolidating for the last twelve weeks and a breakout from here could create a runner.

Before market closed, I saw $DDD made a come back from a down day and the daily chart looked good; so I bought a starter position.

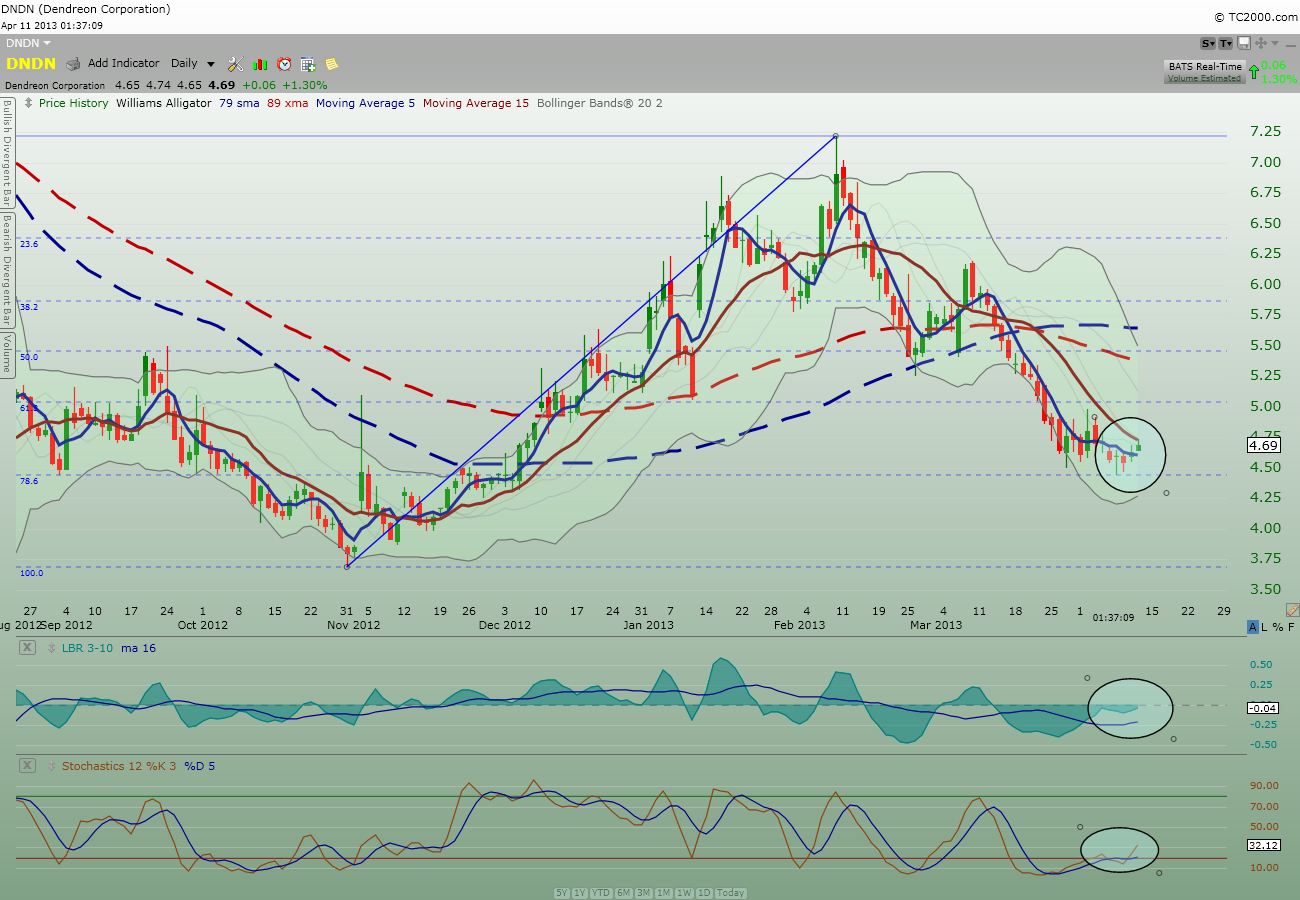
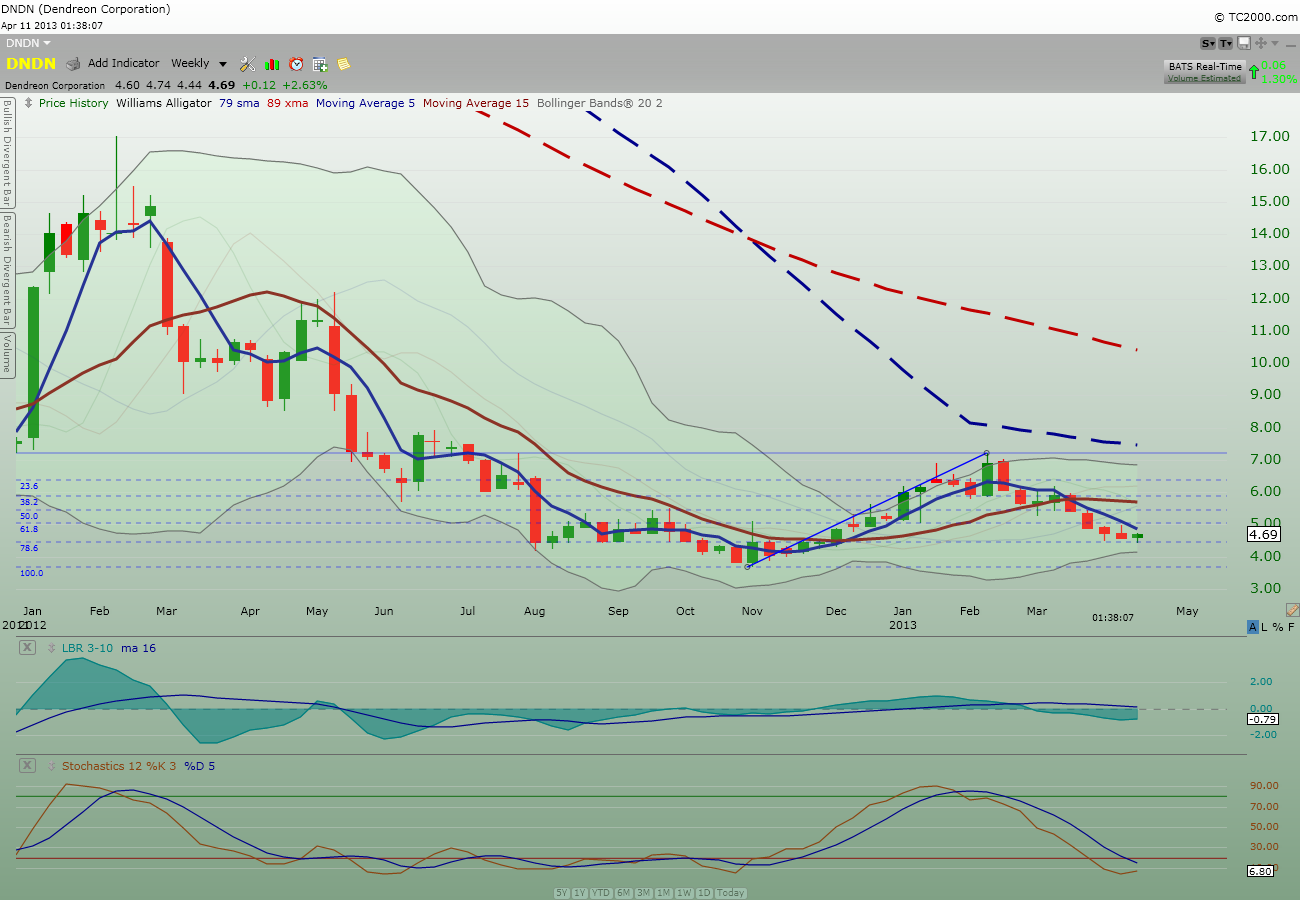
I was disappointed with $DNDN ’cause it had been holding up quite well in the morning thru the afternoon; but by day end, it was falling apart.  I had no choice but to reduce my position size by half to minimize my exposure.

By day end, $APRI, $CERS, $SZYM, $BCRX were all holding well in their price action.

Current holdings:

LRAD, AMRN, SZYM, TINY, CERS, DUST, PPC, PACB, DDD, APRI, BCRX, DNDN and 32% cash

My 2 cents

@tradingmy2cents

The trades I made in the journal were time-stamped in twitter

Comments »

Don’t call me chicken

Because I’m buying $PPC.  Thanks to the alert from Vertigo.

The fundamental makes sense, China is killing a lot of chicken due to the bird flu crisis.  We may have shortage of chicken from China and $PPC may run because of this.

Take a look at the weekly $PPC chart below.

PPC_daily

As you can see, price action may be taking out the current consolidation to the upside.

My 2 cents

Comments »

Biting the $DUST

I’m going to chase the $DUST because I believe it is going to take out the top set in May 2012.  If gold price is being clobbered, the gold miners will be decimated.

Take a look at the weekly $DUST chart.  My sense is that last May high will be taken out by next week.  Perhaps, gold is no longer a safe haven because people are coming back to buy stocks as you can see we have made new high on the DOW.

DUST_weekly

Come to think of it, we may even take out last year high today… there are still 35 minutes for this to happen.

My 2 cents.

Comments »

Bounce Alert!

I’ve been managing $BCRX since last week after getting the alert from RaginCajun.  I elected to forgo the quick profit from the gap up the next day after my entry because I sensed that this one could be a runner.  Thus, I’ve bought and sold shares of $BCRX to manage my risk so I don’t get slaughtered along the way.   I was down to 25% of original position from yesterday and now I’m back to 110% due to the positive price action this morning.

The chart below clear shows a bounce.

BCRX_daily

Time will tell if this will become a runner like I sense it is.

My 2 cents

Comments »

Today Portfolio Adjustment (04-11-2013)

Today was a slap on the face and a big made-up kiss.

Market opened lukewarm positive but $AAPL was being difficult with a negative open.  I moved my stop to breakeven and it was hit.  I left it alone afterward due to no follow-up with yesterday up day.  I expected to see an up day with strong continuation; otherwise, adios!  It seems to me that $AAPL is now a day-trading stock and not like the trending stock you are used to see in 2012.

$BCRX, again, was on a defensive, so I unloaded some more of my position to cut losses and minimized exposure.  I’m now holding on 25% of the original position so I could give it more room to gyrate around before I cut it out for good for nonperformance.

$CHK opened negative and began a waterfall and I was going, “What the heck?”.  Needless to day, I immediately dumped it and was lucky to get out at breakeven.

$CERS opened neutral and after an hour or so, price began to climb.  As it climbed, I added some more.  It peaked at $5.18 and profit-taking brought it back down to $4.88 area but still up for the day.  I did not take profit because I wanted to see how tomorrow price action behaves first.  Sometimes, too much excitement might push the price action too high too fast in the same day; and then price would continue the next day.

I saw $DNDN during my bio-tech round-up review and chart looked like it might be bottoming.  I bought starter position first and added more later in the day when price action was encouraging on the upside.

$DDD intra-day chart looked horrible and I wished I looked at it earlier; nevertheless once I saw how bad it looked, I dumped my position to lock in profit even though today was still an up day.  But the development of a shooting star candlestick bar did not sit well with me and I didn’t want to wait for confirmation of a bearish stance by taking out today low tomorrow.  I always reminded myself that this was a swing trade and should be treated like a swing trade- take your profit and run when price action began to wobble around.  Don’t worry about the earlier paper gain you’ve given back, just take whatever is left on the table and run.  If you are worry about missing the run back up; then it is your ego and greed talking to you.

$DCTH was acting defensive and weak all day and I just had it.  I dumped this nonperformance stock for small losses (from recent re-entry) and walked away.  $DCTH was a swing trade idea and I held no conviction on this one.  Btw, having conviction on a stock pending FDA approval is like having conviction that the metal ball will land on red on the roulette table.  This is cheap conviction and is not worthy for anyone to fret over.

$FB, $AIG, $SZYM, $AMRN were all doing great today while $PACB, and my remaining shares of $BCRX were still in small red.  I’ll give these two another day before I decide the proper action to take.

Current holdings:

AMRN, LRAD, FB, SZYM, TINY, AIG, APRI, CERS, DNDN, PACB, BCRX and 22% cash

My 2 cents.

@tradingmy2cents

The trades I made in the journal were time-stamped in twitter

Comments »

Bottoming Alert!

I’ve been watching $DNDN on and off and today the quantum computer in my head is alerting me that we may be seeing a bottom here.

Take a look at the daily chart below:

DNDN_daily

Did you see the low from earlier this week landed right on the 78.6% Fib retracement?  Did you also see how the two momentum indicators below both turn up and how the price action today is reflecting a “rounding up” pattern?

Price action today also crossed over the 5 min moving average line.  All of this give me a level of comfort to buy a starter position.

Look at the weekly chart below:

DNDN_weekly

Again, the weekly chart is just to show you the prior landscape.  If $DNDN is bottoming out here, we are in the process of starting a 3rd (impulse) wave of Elliot Wave Pattern.  FYI, the 3rd wave, if it is one, is usually the longest wave of the 5 waves pattern…

My 2 cents.

Comments »

Breakout Alert!

Yesterday, I posted a thesis on possible breakout of $CERS within a couple of days and speculated accordingly.  It is my duty to inform you that the breakout occurs today.

Yippee Yapa doo!

Ok, now that I got that wave of excitement out of the way, let’s look at the charts a little bit more:

Below is the daily $CERS chart:

CERS_daily


The breakout is clean and solid.  Notice that it also took out the upper range of the Bollinger band.  That usually mean the bullish force is tremendous here.

Below is the weekly $CERS chart.  This chart is just to show you the possible potential giving the prior landscape.

CERS_weekly


Per my trading strategy, I added to $CERS today.

My 2 cents

Comments »

Today Portfolio Adjustment (04-10-2013)

Today was a “load up the boat” day.

Market opened higher and proceeded to climb all day.

$FB opened strong and after seeing the WSJ news on how Facebook is culling the data of its one billion plus users to improve their advertising business model, I added more without thinking.  Before the morning hours was over, I doubled down on my $FB investment.  When I see fundamental news backing up a positive charting outlook, I do not hesitate to double-down.

$DCTH was acting positive since the open, so I added more.  Having cut cost from yesterday news, I see a more positive outlook in their business model if their specialized chemotherapy delivery system is approved by the FDA.

$BCRX was not dead yet.  It actually tried to climb back up to the positive territory after opening down.  I added a bit more since the bird flu crisis is not over yet.  In other words, my gambling bet is still alive.

I was going to buy $AAPL at the open giving the overall market was up; however, having seen $AAPL trekked down despite an up market before, I waited.  But when it finally took out the intra-day high in the late morning, I bought a starter position.

With market heating up, it is natural for me to think that real estate rally is one of main reason; so I added to $AIG for future prosperity.

$APRI took out the $3 price when I was not looking; so when I found out later, I added more.  Based on the weekly chart, I think $APRI still has a lot of room to run.

I was quite disappointed that $S did not partake on today strong rally; instead, it went down.  So, I dumped it for tiny losses.

I’ve been looking at $CERS for awhile since I missed the buy at low $3.xx; but after seeing it was trying to breakout from the multi-year double top; I bought a starter position to bet that it would be a matter of days before the brearkout occurred.

$PACB was looking good with a positive green bar today.  This green bar presented a sandwich to yesterday red bar since there was another green bar two days ago.  In my book, this is a bullish signal; naturally, I added more today.

$DNN was another non-performing stock today giving today up market; so I sold it for tiny losses as well.

All in all, I bought more than I sold today.

Current holdings:

LRAD, AMRN, FB, SZYM, AAPL, AIG, APRI, TINY, DDD, CERS, CHK, PACB, BCRX, DCTH and 10% cash.

My 2 cents.

@tradingmy2cents

The trades I made in the journal were time-stamped in twitter

Comments »

How do you double $CERS yourself?

By buying the breakout of a double-top (Mar 2012 and Mar 2013) of $CERS.

Take a look at the $CERS weekly chart below:

CERS_weekly

I had traded and made money on $CERS years ago and recently missed the run from low $3 to current price.  Interesting thing was that when it was trading at low $3, my mind was saying “Hey, you better get ready for this one!”.  But I ignored that inner voice by forgetting to follow up with it.  But now that it was trading at critical breakout point, I cannot ignore it any longer.

Below is the Yahoo-Finance Profile description of the company if you are interested:

Business Summary
Cerus Corporation, together with its subsidiary, Cerus Europe B.V., operates as a biomedical products company that focuses on developing and commercializing the INTERCEPT Blood System to enhance blood safety. The company’s INTERCEPT Blood System is based on its proprietary technology for controlling biological replication and is designed to target and inactivate blood-borne pathogens, such as viruses, bacteria, and parasites, as well as potentially harmful white blood cells, while preserving the therapeutic properties of platelet, plasma, and red blood cell transfusion products. Its INTERCEPT Blood System for platelets is designed to inactivate blood-borne pathogens in platelets donated for transfusion; and INTERCEPT Blood System for plasma is designed to inactivate blood-borne pathogens in plasma donated for transfusion. The company is also developing INTERCEPT Blood System for red blood cells, which is designed to inactivate blood-borne pathogens in red blood cells donated for transfusion. It markets its platelet and plasma systems through its direct sales force and distributors primarily in Europe, the Commonwealth of Independent States, and the Middle East. The company has collaboration agreements with Baxter International, Inc. for the development and commercialization of the INTERCEPT Blood System. Cerus Corporation was founded in 1991 and is headquartered in Concord, California.

My 2 cents.

Comments »

APRIL for $APRI for Triangle Breakout

Although we have a another up-day for $APRI, price is still at the beginning stage of a triangle breakout in the weekly chart.

Take a look at the weekly chart below:

APRI_weekly


What it means is that if the breakout to the upside happens on the weekly chart, we are still in the infantile stage of a run.

My 2 cents.

Comments »