During After Hours with Option Addict, I talked briefly about the Zweig breadth thrust signal that went off back on 10/9. This was in response to overall discussions about the velocity of this upside swing in stocks, and differentiating bullish or bearish.
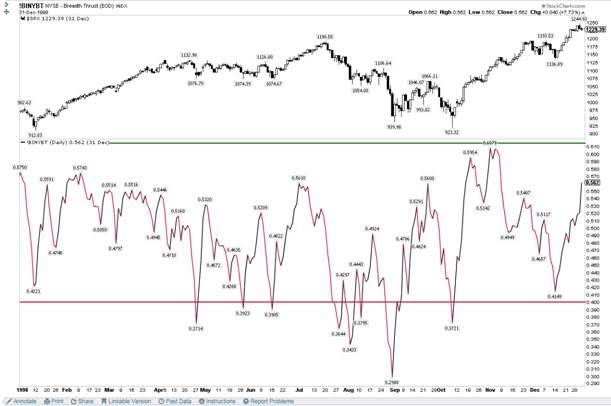
I wondered out loud if this had been the case back during the 1998 analogue, so my man Brian pinged me with a bad ass chart this evening.
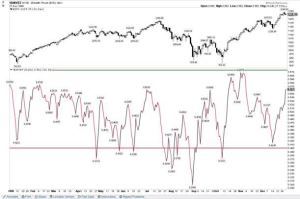 I find this to be quite odd that we didn’t also see one in 98. Everything else I’ve encountered signal wise also fit into the analogue.
Nonetheless, I wanted to post a few more stats on this indicator and what should be taken away from it.
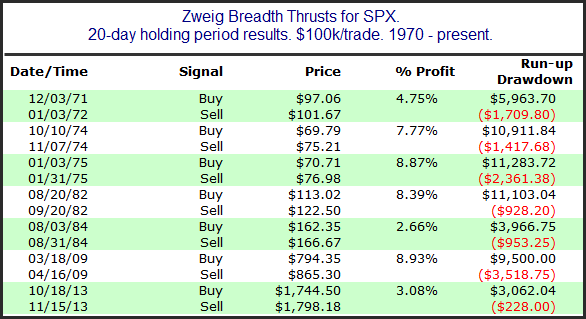
This is only the eighth time that the Zweig Breadth Thrust indicator has been triggered since 1970, and in all seven previous instances, the S&P 500 finished higher 20 days later, with positive readings in 1975, 1982, and 2009 all leading to 20-day rallies greater than 8%.
Rob from Quantifiable Edges posted these stats:
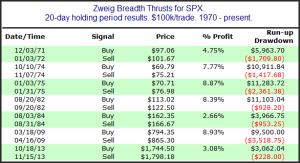
Every instance has closed higher 20 days later. (And 19 and 18 and 17 and 16 and 15 and 14 and 13.) All 7 instances saw a runup of at least 3% over the next 4 weeks, and only once did the market pull back as much as even 2.5%.
I’ve studied the 1974 signals back in the day, because I always looked at 1974 as the 08/09 low point of the secular bear of the 60’s and 70’s. The 60’s-70’s had some striking resemblance to 00-09. Anyway, four of these signals went off at that low.

The next four signals came in 1982 and 1984:

Then came the signal at the 2009 lows, and two that went off in the fall of 2013.
Why do we care about this guy? His indicator has been pretty a pretty decent tell in the last 50 years. The guy also called the 87 crash right before it happened.
Anyway, there’s a little more detail per the mention in After Hours with Option Addict.
OA
Comments »