[youtube://http://www.youtube.com/watch?v=j4dzECaBxFU#t=203 450 300]
Comments »How to Protect Your Assets
“Picture a paradise where you can be lawsuit-proof. A place to hide your hard-earned assets far from the grasp of former or soon-to-be-former spouses, angry business partners or, if you happen to be a doctor, patients who might sue you.
Lawyers drumming up business say they have found just the place: the Cook Islands. And, thanks to a recently released trove of documents, it’s become clear that hundreds of wealthy people have stashed their money there, including a felon who ran a $7 billion Ponzi scheme and the doctor who lost his license in the Octomom case.
These flyspeck islands in the middle of the Pacific would be nothing more than lovely coral atolls, nice for fish and pearls, except for one thing: The Cooks are a global pioneer in offshore asset-protection trusts, with laws devised to protect foreigners’ assets from legal claims in their home countries.
The Cayman Islands, Switzerland and the British Virgin Islands capture headlines for laws and tax rates that allow multinational corporations and the rich to shelter income from the American government. The Cook Islands offer a different form of secrecy. The long arm of United States law does not reach there. The Cooks generally disregard foreign court orders, making it easier to keep assets from creditors, or anyone else.
Win a malpractice suit against your doctor? To collect, you will have to go to the other side of the globe to plead your case again before a Cooks court and under Cooks law. That is a big selling point for those who market Cook trusts to a broad swath of wealthy Americans fearful of getting sued, and some who have been.
“You can have your cake and eat it too….”
Comments »U.S. Household Net Worth Hits an All Time High
“U.S. household net worth climbed to a record in the third quarter as home prices marched higher and the value of stocks and mutual funds surged, boosting the economic outlook.
The Federal Reserve said Monday net worth increased $1.9 trillion to $77.3 trillion in the third quarter, the highest level since records started in 1945.
The value of residential real estate rose by $428 billion between July and September, and corporate equities and mutual funds were up by $917 billion over the period, it said….”
Comments »U.S. Banks Shrink to an All Time Low, Are We Approaching An All Time High Risk Watermark?
“Updated Dec. 3, 2013 7:33 a.m. ET

The number of banking institutions in the U.S. has dwindled to its lowest level since at least the Great Depression, as a sluggish economy, stubbornly low interest rates and heightened regulation take their toll on the sector.
The number of federally insured institutions nationwide shrank to 6,891 in the third quarter after this summer falling below 7,000 for the first time since federal regulators began keeping track in 1934, according to the Federal Deposit Insurance Corp.
The decline in bank numbers, from a peak of more than 18,000, has come almost entirely in the form of exits by banks with less than $100 million in assets, with the bulk occurring between 1984 and 2011. More than 10,000 banks left the industry during that period as a result of mergers, consolidations or failures, FDIC data show. About 17% of the banks collapsed.
The consolidation could help alleviate concerns that the abundance of U.S. banks leads to difficulties in oversight or a less-efficient financial system. Meanwhile, overall bank deposits and assets have grown, despite the drop in institutions.
“Seven thousand is still an awful lot of banks,” particularly in an era where brick-and-mortar branches are becoming less profitable, said David Kemper, chief executive of Commerce Bancshares Inc., a regional bank based in Missouri. “There’s no reason why we need that many banks, especially if those smaller banks have a much lower return on capital. The small banks’ bread and butter is just not there anymore.”
Still, the falloff is raising alarms among boosters of community banks, who say such lenders—which represent the vast majority of U.S. banks—are critical to the economy because they are more likely to make small-business loans. The number of physical bank branches in the U.S. is also shrinking. From the end of 2009 through June 30 of this year, the total number of branches dropped 3.2%, according to FDIC data.
“All too often, the large banks use their models and their algorithms, and if you don’t fit in their boxes, you don’t get the loan,” said Sheila Bair, the former FDIC chairman who is now a policy adviser at the Pew Charitable Trusts think tank.
Unlike before the financial crisis, new startup banks aren’t rushing to take the place of exiting institutions. Every year from 1934 to 2009, investors in the U.S. chartered at least a few and sometimes hundreds of new banks, according to the FDIC data. The Bank of Bird-in-Hand opened in Bird-in-Hand, Pa., on Monday—it was the first new bank startup in the U.S. since December 2010.
The reticence stems from slim profits and rising regulatory costs as Washington tries to ensure banks won’t fail en masse as they did during and after the 2008 financial crisis, bankers and industry consultants say.
SNL Financial, a firm that tracks bank data, said the median loan-growth rate for banks with less than $100 million in assets was about 2% during the year ending Sept. 30, well behind the roughly 3.4%-to-7% rate for midsize banks, or those with assets as high as $10 billion.
FDIC researchers, in a study of community banks released in December 2012, found that, as net interest margins—the difference between the interest charged on loans and that paid on deposits—declined across the industry in recent years as interest rates dropped….”
Will the Housing Crisis Rear Its Ugly Head Yet Again?
?U.S. borrowers are increasingly missing payments on home equity lines of credit they took out during the housing bubble, a trend that could deal another blow to the country’s biggest banks.
The loans are a problem now because an increasing number are hitting their 10-year anniversary, at which point borrowers usually must start paying down the principal on the loans as well as the interest they had been paying all along.
More than $221 billion of these loans at the largest banks will hit this mark over the next four years, about 40 percent of the home equity lines of credit now outstanding.
For a typical consumer, that shift can translate to their monthly payment more than tripling, a particular burden for the subprime borrowers that often took out these loans. And payments will rise further when the Federal Reserve starts to hike rates, because the loans usually carry floating interest rates.
The number of borrowers missing payments around the 10-year point can double in their eleventh year, data from consumer credit agency Equifax shows. When the loans go bad, banks can lose an eye-popping 90 cents on the dollar, because a home equity line of credit is usually the second mortgage a borrower has. If the bank forecloses, most of the proceeds of the sale pay off the main mortgage, leaving little for the home equity lender.
There are scenarios where everything works out fine. For example, if economic growth picks up, and home prices rise, borrowers may be able to refinance their main mortgage and their home equity lines of credit into a single new fixed-rate loan. Some borrowers would also be able to repay their loans by selling their homes into a strengthening market…..”
Comments »
Banks May Start Charging You Just to Hold Your Deposits
The Fed’s Catch 22 just got catchier. While most attention in the recently released FOMC minutes fell on the return of the taper as a possibility even as soon as December (making the November payrolls report the most important ever, ever, until the next one at least), a less discussed issue was the Fed’s comment that it would consider lowering the Interest on Excess Reserves to zero as a means to offset the implied tightening that would result from the reduction in the monthly flow once QE entered its terminal phase (for however briefly before the plunge in the S&P led to the Untaper). After all, the Fed’s policy book goes, if IOER is raised to tighten conditions, easing it to zero, or negative, should offset “tightening financial conditions”, right? Wrong. As the FT reports leading US banks have warned the Fed that should it lower IOER, they would be forced to start charging depositors.
In other words, just like Europe is already toying with the idea of NIRP (and has been for over a year, if still mostly in the rheotrical and market rumor phase), so the Fed’s IOER cut would also result in a negative rate on deposits which the FT tongue-in-cheekly summarizes “depositors already have to cope with near-zero interest rates, but paying just to leave money in the bank would be highly unusual and unwelcome for companies and households.”
If cutting IOER was as much of an easing move as the Fed believes, banks should be delighted – after all, according to the Fed’s guidelines it would mean that the return on their investments (recall that all US banks slowly but surely became glorified, TBTF prop trading hedge funds since Glass Steagall was repealed, and why the Volcker Rule implementation is virtually guaranteed to never happen) would increase. And yet, they are not:
Executives at two of the top five US banks said a cut in the 0.25 per cent rate of interest on the $2.4tn in reserves they hold at the Fed would lead them to pass on the cost to depositors.
Banks say they may have to charge because taking in deposits is not free: they have to pay premiums of a few basis points to a US government insurance programme.
“Right now you can at least break even from a revenue perspective,” said one executive, adding that a rate cut by the Fed “would turn it into negative revenue – banks would be disincentivised to take deposits and potentially charge for them”.
Other bankers said that a move to negative rates would not only trim margins but could backfire for banks and the system as a whole, as it would incentivise treasury managers to find higher-yielding, riskier assets.
“It’s not as if we are suddenly going to start lending to [small and medium-sized enterprises],” said one. “There really isn’t the level of demand, so the danger is that banks are pushed into riskier assets to find yield.”
All of the above is BS….”
Comments »The Petro Dollar Trembles as China Considers Pricing Black Gold in Yuan
“With the US shale revolution set to make America the largest exporter of crude, however briefly, the influence of Saudi oil is rapidly declining. This has been felt most recently in the cold shoulder the US gave Saudi Arabia and Qatar first over the Syrian debacle, and subsequently in its overtures to break the ice with Iran over the stern objections of Israel and the Saudi lobby (for a good example of this the most recentsoundbites by Prince bin Talal ). But despite the shifting commodity winds and the superficial political jawboning, the reality is that nothing threatens the US dollar’s hegemony in what many claim is the biggest pillar of the currency’s reserve status – the petrodollar, which literally makes the USD the only currency in which energy-strapped countries can transact in to purchase energy. This may be changing soon following news that the Shanghai Futures Exchange could price its crude oil futures contract in yuan, its chairman said on Thursday, adding that the bourse is speeding up preparatory work to secure regulatory approvals.
In doing so China is effectively lobbing the first shot across the bow of the Petrodollar system, and more importantly, the key support of the USD in the international arena.
This would be in keeping with China’s strategy to import about 100 tons of gross gold each and every month….”
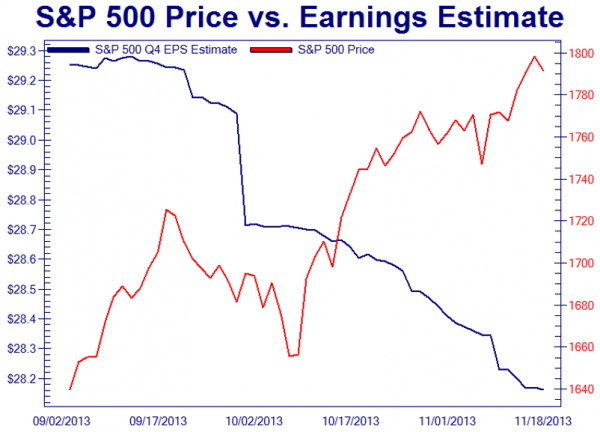
Comments »Price vs Earnings
Bitcoin Hits $5 Hundo Yo

Danger: Money Multiplier Continues to Crash
“The Federal Reserve’s Quantitative Easing has given rise to an all time low in the money multiplier which, in turn, has a higher probability of rising than falling. Notwithstanding the recent explosion of personal debt, Chart #5 above shows an emerging propensity of the US public to want to save a higher percentage of their income and/or pay down debts. Therefore, the most likely driver of a rising ratio will be a rise in savings relative to money stock which, in turn, will place a downward pressure on corporate earnings. It follows that continuation of QE by the Fed will do nothing other than push the money multiplier ratio lower. Therefore QE is becoming impotent as a strategy for driving the US economy. By extension, if the savings rate continues along its early rising trend, this will likely be accompanied by recessionary conditions which, in turn, will place a downward pressure on Price:Earnings ratios.
There are two unconventional analysts who have come to my attention over the years and whose work is unique to them:
The first is Mr. Alan Newman, who publishes a report entitled “Pictures of a Stock Market Mania”. His latest report, dated November 5th 2013 can be viewed here: www.cross-currents.net/charts.htm ).
The second is Professor Didier Sornette, who’s bio can be viewed at (http://www.er.ethz.ch/people/sornette ) and whose stock-market relevant work is summarised on the following You-Tube of a TED Talk entitled “How can we predict the next financial crisis?”that he gave in June 2013.http://www.ted.com/talks/didier_sornette_how_we_can_predict_the_next_financial_crisis.html
If Professor Sornette’s model is to be believed, we can expect a significant market peak in mid November 2013 – see chart below: (source: Casey Research)
Chart # 1 – Time Singularity Forecast
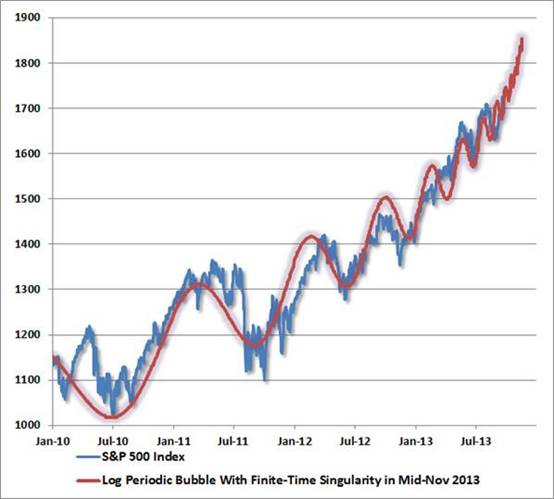
Of course, this begs the question as to whether this will be just another trading peak or whether it will be a significant peak.
My own view is that Alan Newman’s work should be seen as a backdrop to any analysis. From the time that Alan Greenspan came onto the scene, the Dollar Trading Volume (DTV) as a multiple of Gross Domestic Product has been rising. At the peak of the 1929 stock market bubble it was well over 100%. Now it is around 350%.
In 1929, the ratio of DTV to Market Capitalisation (the combined value of all companies quoted on the NYSE) was around 200%. Now it is just shy of 300%, having fallen from a peak of 400% in 2009.
Of course, this has occurred as a direct consequence of what has come to be known as “algorithm” trading and as an indirect consequence of the US Federal Reserve’s loose money and low interest rate policies.
A couple of days ago a friend sent me a Point & Figure chart of the gold price – which showed a “buy” signal. Within a day or so of his having sent it, the chart looked like this (source stockcharts.com)
Chart #2 – Point & Figure Chart of the Gold Price (Nov 6th 2013)
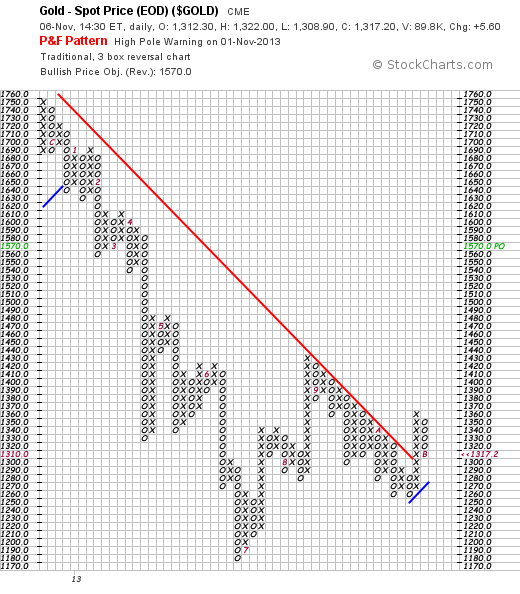
Note how the buy signal reversed itself with a high pole warming sell signal and that reversal coincided with a rise to a new high by the Dow Jones Industrial Index (not shown).
Of relevance, on November 6th 2013, the percentage of financial advisers who were bullish on equities was 82.4%, having pulled back from a high of 89.2% on May 29th. “Blue skies, nothing but blue skies”, do they see
Of course, this begs the question of when the stock market mania will end? Will it end around mid November, as per Sornette’s model? The short answer is: There is a high probability.
The chart below (courtesy Bigcharts.com) is worrying from two perspectives:
Chart # 3 – Monthly Chart of the Dow Jones Industrial Index.
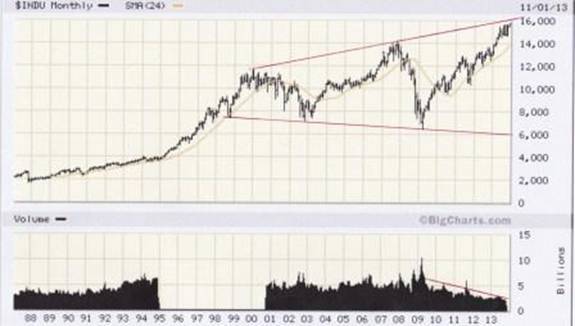
First, the reader will note the two diverging red trend lines…..”
Comments »Bitcoin Hits a New All Time High, China Now Has the Largest Exchange for the Virtual Currency
“If James Bond, Sergey Brin and Paul Volcker…designed their ideal currency, it might look a lot like bitcoin.”
 (Credit: 123dartist/Shutterstock)
Bitcoin’s price hit a record at $261 on the Bitstamp online exchange, driven by wider acceptance of the virtual currency.
The digital money, which can be used to pay for goods and services on the Internet, has risen 20-fold so far this year, as trading activity has increased. Bitcoins were trading at $259.02 apiece at 1:17 p.m. in New York on Bitstamp, one of the more active Web-based exchanges where Bitcoins are traded for dollars, euros and other currencies.
The rally comes a month after the closing of the “Silk Road Hidden Website,” where people could obtain drugs, guns and other illicit goods using Bitcoins. The virtual currency lost a third of its value in the days after the website was shut down. Bitcoins are becoming increasingly popular, particularly in China, said Ugo Egbunike, director of business development at IndexUniverse, an index-fund researcher.
“I thought Silk Road is going to do some damage to the price,” Egbunike said. “But with BTC China buying this up — they seem to have picked up the slack.”
BTC China is now the world’s largest Bitcoin exchange, Nicholas Colas, a ConvergEx Group analyst, wrote in a Nov. 5 report.
The virtual currency exists as software that’s designed to be untraceable…”
Exchanges
| Market | Last | Volume (24h) | Bid | Ask | High | Low |
|---|---|---|---|---|---|---|
| mtgoxUSD | 316.8110 | 87,486.39 | 316.51 | 318.49 | 324.20 | 266.00 |
| btcnCNY | 1912.9800 | 65,506.58 | 1913.30 | 1913.48 | 1919.99 | 1665.01 |
| bitstampUSD | 297.0100 | 51,193.33 | 296.00 | 297.02 | 299.12 | 264.67 |
| btceUSD | 286.5000 | 36,257.66 | 285.30 | 287.20 | 292.50 | 255.00 |
| mtgoxEUR | 237.0000 | 13,258.27 | 233.96 | 234.00 | 237.00 | 195.60 |
| btcdeEUR | 212.0000 | 3,530.09 | 216.12 | 220.00 | 251.97 | 185.00 |
| mtgoxJPY | 30487.2040 | 2,994.61 | 30500.00 | 31186.45 | 31650.00 | 25597.96 |
| bitcurexPLN | 900.0500 | 2,796.03 | 891.00 | 910.00 | 910.00 | 779.50 |
| mtgoxGBP | 200.0000 | 1,743.34 | 197.00 | 198.71 | 200.00 | 166.50 |
| btceRUR | 8900.0000 | 1,383.13 | 8870.00 | 8890.00 | 8998.99 | 7900.00 |
| virtexCAD | 293.0100 | 1,377.72 | 293.01 | 295.00 | 297.99 | 260.51 |
| mtgoxAUD | 334.0000 | 1,163.03 | 330.10 | 336.64 | 339.48 | 280.00 |
| localbtcGBP | 212.4600 | 1,041.78 | 211.54 | 137.40 | 1142.68 | 166.67 |
| cbxUSD | 284.9500 | 978.85 | 281.01 | 284.96 | 291.13 | 245.01 |
| localbtcUSD | 356.9800 | 880.74 | 1172.00 | 131.40 | 500.15 | 202.99 |
| mtgoxPLN | 978.0000 | 728.57 | 964.99 | 979.88 | 990.00 | 825.00 |
| btceEUR | 218.6770 | 674.37 | 216.50 | 218.34 | 222.93 | 185.00 |
| virwoxSLL | 70000.0000 | 418.72 | 68708.00 | 70000.00 | 70000.00 | 62337.00 |
| localbtcEUR | 217.8500 | 360.38 | 286.92 | 129.54 | 299.62 | 136.25 |
| mtgoxCAD | 334.5000 | 273.24 | 330.00 | 334.35 | 336.74 | 272.77 |
| kptnSEK | 1850.0000 | 252.13 | 1850.00 | 1889.50 | 1950.00 | 1731.73 |
| localbtcAUD | 314.1800 | 170.56 | 429.73 | 256.73 | 367.57 | 210.03 |
| mrcdBRL | 788.9900 | 154.78 | 752.74 | 788.99 | 797.15 | 671.00 |
| bitcurexEUR | 212.0000 | 133.52 | 209.00 | 212.00 | 225.01 | 190.00 |
| rockEUR | 217.9900 | 110.53 | 210.00 | 219.80 | 220.00 | 190.01 |
| localbtcCAD | 345.8800 | 92.40 | 341.58 | 295.00 | 369.57 | 257.56 |
| bitcashCZK | 6000.0000 | 85.81 | 5890.00 | 6000.00 | 6250.00 | 4850.00 |
| rippleXRP | 30999.0000 | 84.58 | 30502.00 | 31888.00 | 35453.94 | 30501.00 |
| bitnzNZD | 399.0000 | 82.53 | 366.00 | 399.90 | 400.00 | 320.00 |
| justNOK | 1839.0000 | 74.73 | 1718.00 | 1823.46 | 1839.00 | 1596.86 |
| btcmarketsAUD | 320.0000 | 49.63 | 295.00 | 320.00 | 320.00 | 257.00 |
| bit2cILS | 980.0000 | 47.63 | 980.00 | 1000.00 | 989.00 | 888.00 |
| mtgoxCHF | 284.0000 | 46.81 | 284.15 | 295.72 | 290.47 | 249.00 |
| fybsgSGD | 383.0000 | 34.44 | 350.00 | 375.00 | 384.00 | 316.50 |
| fybseSEK | 1800.0000 | 33.48 | 1800.00 | 1870.00 | 1870.00 | 1690.00 |
| mtgoxNZD | 378.1942 | 31.09 | 368.39 | 382.44 | 378.19 | 350.00 |
| mtgoxHKD | 2360.2646 | 20.13 | 2393.62 | 2491.22 | 2502.36 | 2315.00 |
| mtgoxCNY | 1840.0000 | 16.50 | 1881.10 | 1952.86 | 1964.94 | 1662.77 |
| crytrUSD | 282.9900 | 16.49 | 261.00 | 290.00 | 290.00 | 259.00 |
| justEUR | 202.0050 | 15.86 | 209.70 | 212.40 | 212.21 | 196.52 |
| bidxtrmPLN | 900.0000 | 15.60 | 854.59 | 940.00 | 940.50 | 789.99 |
| localbtcMXN | 4247.7400 | 14.20 | 4036.08 | 3982.99 | 4798.00 | 3540.81 |
| bitxZAR | 3180.0000 | 13.27 | 3180.00 | 3250.00 | 3420.00 | 3110.00 |
| localbtcINR | 18085.3200 | 13.24 | 18526.01 | 19289.79 | 18906.60 | 15580.39 |
| localbtcNOK | 1892.2400 | 12.71 | 1882.52 | 1936.54 | 1892.24 | 1580.99 |
| localbtcSGD | 297.5000 | 11.42 | 360.01 | 471.57 | 353.86 | 297.50 |
| mtgoxSEK | 2038.6310 | 10.98 | 2012.59 | 2089.33 | 2074.72 | 1822.68 |
| localbtcHKD | 1986.5500 | 10.27 | 2302.31 | 2455.72 | 2427.89 | 1986.55 |
| mtgoxSGD | 392.5262 | 9.87 | 383.95 | 399.60 | 392.53 | 364.28 |
| localbtcZAR | 4059.7400 | 9.72 | 3081.16 | 4118.38 | 4059.74 | 2771.29 |
| localbtcCHF | 263.7700 | 8.91 | 271.91 | 281.62 | 313.44 | 217.13 |
| localbtcARS | 2755.6600 | 8.70 | 2700.00 | 2756.99 | 2900.00 | 2495.00 |
| intrsngEUR | 215.0000 | 8.52 | 212.39 | 215.00 | 225.00 | 198.96 |
| justLTC | 30.0000 | 6.30 | 41.00 | 69.70 | 74.73 | 30.00 |
| localbtcBRL | 751.7500 | 5.49 | 706.99 | 763.23 | 758.02 | 657.78 |
| anxhkHKD | 2299.9474 | 4.87 | 2152.00 | 3100.00 | 2300.00 | 1858.00 |
| bitkonanUSD | 281.0000 | 4.58 | 280.01 | 348.00 | 426.00 | 269.00 |
| localbtcNZD | 435.0900 | 4.35 | 370.00 | 325.18 | 435.09 | 341.89 |
| mtgoxRUB | 9568.3347 | 3.69 | 9993.74 | 10401.07 | 10185.47 | 8642.51 |
| justUSD | 287.7700 | 3.31 | 282.60 | 305.62 | 287.77 | 259.32 |
| localbtcDKK | 1516.5400 | 3.00 | 1545.54 | 1780.26 | 1516.54 | 1516.54 |
| localbtcSEK | 1524.3500 | 2.96 | 2326.20 | 2068.46 | 1642.05 | 1524.35 |
| localbtcCZK | 4782.6800 | 2.93 | 5855.87 | 6387.74 | 5255.69 | 4765.67 |
| localbtcPLN | 946.4000 | 2.88 | 995.66 | 945.00 | 946.40 | 946.40 |
| rippleUSD | 259.0000 | 1.56 | 260.00 | 300.00 | 295.00 | 250.00 |
| localbtcRUB | 9583.9700 | 1.37 | 9577.25 | 9778.81 | 9667.79 | 9518.59 |
| justXRP | 29000.0000 | 1.07 | 29000.00 | 34900.00 | 35000.00 | 29000.00 |
| localbtcTHB | 8927.5200 | 1.00 | 9487.26 | 8396.13 | 8927.52 | 8927.52 |
| rockUSD | 280.0000 | 0.90 | 268.00 | 299.00 | 280.00 | 268.00 |
| crytrEUR | 207.0000 | 0.61 | 207.00 | 280.00 | 214.00 | 207.00 |
| intrsngGBP | 69.3600 | 0.05 | 68.94 | 69.36 | 69.36 | 69.36 |
$FB 2.0? $TWTR Raises IPO Price by 25%
“This morning’s announcement of the 25% rise in the IPO price of Twitter raised a few eyebrows across Wall and Main Street. Most will argue that investors have all learned many lessons in the 18 months since Facebook IPO’d to a clarion call for retail money large and small from every form of media that exists… The following headlines from the pre-IPO suggest, unfortunately, that we learned absolutely nothing…”
Comments »
Investor Confidence Builds as IPOs Get Scooped Up in a Frenzy Like State
“Investors are stampeding into initial public offerings at the fastest clip since the financial crisis, fueling a frenzy in the shares of newly listed companies that echoes the technology-stock craze of the late 1990s.
October was the busiest month for U.S.-listed IPOs since 2007, with 33 companies raising more than $12 billion. The coming week is slated to bring a dozen more initial offerings, including Thursday’s expected $1.6 billion stock sale by Twitter Inc., the biggest Internet IPO since Facebook Inc. FB -0.10% ‘s $16 billion sale in May 2012.
The 190 U.S.-listed IPOs this year have raised $49.2 billion, more than the $45 billion raised by the 132 deals during the same period in 2012.

Container Store Group Inc. TCS +101.11% rose 101% on its first day of trading Friday, making it the sixth company this year to double in its first day of U.S. trading. There were eight such doubles in the previous 12 years, according to data tracker Dealogic.
The rush to buy shares of newly public companies is the latest sign of investors’ thirst for assets with potential upside, at a time when relatively safe investments are generating scant income due to tepid economic growth and Federal Reserve policies that have kept a lid on U.S. interest rates.
Many of these companies aren’t profitable. But investors increasingly are willing to roll the dice, particularly on technology firms that they say have the potential to “disrupt” the industry.
“After all these years of the market going up, investors are getting reacquainted with equities,” said Alan Gayle, senior investment strategist at RidgeWorth Investments, which manages $49 billion in Atlanta. “In a slower-growth environment, the newer names are much more likely to be disruptive. Disruptive companies are more likely to grow their top line at a fast pace.”
To some, the hunger for shares of newly public companies is a sign that the IPO market has begun to find its footing after five years in the doldrums, and could return to being a driver of growth for companies looking for capital to expand and hire.
To others, however, the demand is an indication that a rally fueled primarily by abundant liquidity from the Fed, and not by earnings growth and economic expansion, is entering dangerous territory.
“When I hear intelligent investors asking me not which companies are good to invest in, but which IPOs can I get into, it scares the heck of me,” said Mark Lamkin, a wealth-management adviser based in Louisville, Ky.
So far this year, 61% of companies selling U.S.-listed IPOs have lost money in the 12 months preceding their debuts, according to Jay Ritter, professor of finance at the University of Florida. That is the highest percentage since 2000, the year the Nasdaq Composite Index roared to its all-time high of 5048.62. The index closed Friday at 3922.04.
Investors this year are putting a higher value on debut companies’ revenue than at any time since the crisis. The median IPO this year has been priced at five times the past 12 months’ sales, according to Mr. Ritter. That is the highest mark since 2007, when the median ratio was more than six times.
Companies holding their IPOs in the U.S. this year have posted an average 30% gain in share price, according to Dealogic. That compares with a 23.5% advance in the S&P 500 index…..”
Comments »Are Puerto Rico’s Bonds a Canary in the Coal Mine ?
“Despite the fact that Puerto Rican (PR) municipal bonds are triple-tax-exempt (no federal, state, or local income taxes apply on their interest), their interest rates have skyrocketed since the Detroit bankruptcy first disrupted the complacency among municipal bond investors in July. High quality municipal bonds are paying little more than 1 percent annually, but PR bonds, even though they remain investment grade (barely), have spiked to paying between 8 and 10 percent, with some predicting that even higher rates will be necessary in order to attract new investors.
Comparisons to Detroit are tempting, but a careful look at the headwinds facing Puerto Rico makes Detroit’s problems seem almost not worth mentioning. Detroit’s bankruptcy filing in July was for $18 billion. Puerto Rico’s debt is nearly four times larger.
A partial listing of those headwinds include:
• Moody’s downgrade of PR debt on October 3 to just above junk, with its outlook changed from stable to negative;
• The recent settlement by UBS bank’s Puerto Rican branch with the Securities and Exchange Commission over hiding the country’s faltering financial condition and artificially supporting bond prices;
• The necessity by Puerto Rico treasury officials to borrow in the private market because the bond market is essentially closed to them;
• The U.S.-enforced minimum wage in Puerto Rico, which makes it too expensive for business owners to hire workers, impacting the island’s already high unemployment rate — a rate that is nearly twice that in the United States;
• National debt that is greater than any American state, except California (population of 38 million) and New York (population of 20 million) — Puerto Rico has a population of just 3.6 million;
• A ratio of debt to personal income (which in the United States averages 3.4 percent) is an eye-popping 89 percent;
• A labor force participation rate of just 41 percent, compared to 63 percent in the United States;
• The sharp increase in income taxes by President Alejandro Padilla in his attempt to balance the government’s budget by 2016;
• Overly generous welfare and disability income programs, which discourage employment and encourage dependency;
• Bloated government, where one in five workers are employed by the government;
• The country’s pension plan, which is only 7 percent funded;
• The government’s cash flow, which has been negative for the past 13 years, and
• Its 2012 Comprehensive Annual Financial Statement, due months ago, has yet to be filed.
As a territory of the United States (more accurately, the relationship between the United States and Puerto Rico is that of asuzerainty), Puerto Rico therefore suffers from the welfare state mentality of its northern neighbor. The country has subsisted on handouts, special incentives (such as a tax code that, until 2006, allowed U.S. corporations with offices in Puerto Rico to send their earnings to their parent without paying corporate income tax), and triple tax exemptions that allowed the government to continue to borrow at artificially attractive rates from American investors who assumed that their investments were safe. For those investors it was the best of all worlds: In a low interest-rate environment, they were able to generate excellent real rates of return without risk to their capital.
Until now.
Most of Puerto Rico’s borrowings have been absorbed by municipal bond funds run by big names such as Franklin, Fidelity, and Oppenheimer. According to MorningStar, the mutual fund tracking service, 180 mutual funds in the United States hold at least five percent of their portfolios in PR municipal bonds. Some of them, such as the Franklin Double Tax-Free Income fund, has a 60 percent exposure to Puerto Rico and has seen its value drop a harrowing 15.7 percent in just the last five months. In other words, investors in that fund have seen their capital shrink by three percent per month just since May, losing one-sixth of their initial investment.
One mutual fund manager, affiliated with UBS bank, has seen its two primary Puerto Rico funds — the UBS Puerto Rico Tax-Free Target Maturity Fund and the UBS Puerto Rico Tax-Free Target Maturity Fund II — lose an astounding 88.9 percent and 83.5 percent of their value, respectively.
The impact on borrowing costs ripple out far beyond that of a small island in the Caribbean. It is estimated that the entire municipal bond market in the United States exceeds $4 trillion. If the situation in Puerto Rico continues to unravel, interest rates are likely to rise significantly across the board, raising borrowing costs for every municipality from Dubuque to Portland….”
Comments ».com Bubble 2.0 ?
” “It’s gotten pretty frothy,” is how one portfolio manager describes the behavior in internet-based companies currently as signs of pre-2000 exuberance can be seen in Silicon Valley and the nearby area. As WSJ reports, home prices in San Francisco and surrounding counties rose more than 15% in the past year. Office rents in San Francisco are 23% above their 2008 peak. As SnapChat, Pinterest, and Twitter are set to join such illustrious names as RocketFuel; asset managers are careful to remind suckers investors that it’s not at all like 1999 – companies going public are more mature, the leadership teams more seasoned, the business models more proven – but the “reach for growth” at all costs echoes Kyle Bass’ remarks that “financial memory is no longer than two years,” with even younger and more revenue-deprived companies come to market at massively elevated multiples.

Via WSJ,
“It’s gotten pretty frothy,” says Daniel Cole, a senior portfolio manager at Manulife Asset Management who has invested in highflying IPOs, including for Rocket Fuel Inc. The Redwood City, Calif., online-advertising company sold shares to the public last month at $29 each. They traded at $61.72 a share Friday, giving Rocket Fuel a market valuation of $2 billion, without having recorded a profit.
… Technology and finance veterans say this time is different—and it is. Companies going public are more mature, the leadership teams more seasoned, the business models more proven. Social networks such as Twitter and Pinterest are drafting off the success of Facebook Inc., which sports a market value of $126.5 billion, or about 70 times next year’s expected earnings.
But the current surge is accelerating, aided by some little-appreciated factors. Big companies are scarcely growing, and interest rates remain near zero, boosting zeal for investment opportunities in companies with high-growth potential….”

State of the Union
By Michael A. Fletcher, Published: October 23
“A majority of Americans with 401(k)-type savings accounts are accumulating debt faster than they are setting aside money for retirement, further undermining the nation’s troubled system for old-age saving, a new report has found.
Three in five workers with defined contribution accounts are “debt savers,” according to the report released Thursday, meaning their increasing mortgages, credit card balances and installment loans are outpacing the amount of money they are able to save for retirement.
The imbalance is expanding even as policymakers are encouraging people to set aside more by offering generous tax breaks and automatically enrolling workers in retirement accounts that in some cases automatically escalate the amount of money over time.
Currently, workers with retirement savings accounts put aside more than 11 percent of their pay for retirement — 5 percent in their own accounts, and 6.2 percent in Social Security.
Despite that — and despite the $2.5 trillion the report says employers have poured into defined contribution accounts from 1992 to 2012 — the retirement readiness of most Americans has been slipping, according to the report by HelloWallet, a D.C. firm that offers technology-based financial advice to workers and conducts research of economic behavior.
“Policy has tunnel vision. It tends to tackle problems on a piecemeal basis. The impact of policy on consumer finances is a bit like playing a game of Whac-A-Mole,” said Matt Fellowes, founder and chief executive of HelloWallet and a former Brookings Institution scholar. “We raised the victory flag as people increased retirement contributions, but in reality the ability of people to retire is a function of lots of different variables, most important of which is what they are doing on the other side of the ledger.”
The HelloWallet report is the latest in an expanding line of research suggesting that the United States is facing a looming retirement security crisis. A growing number of researchers are concerned that the nation is on the cusp of a shift in which more Americans are on a track that will lead to a decline in their living standards when they retire.
The report says that debt is among the biggest culprits. The amount of money that households nearing retirement are dedicating to pay down debts has increased 69 percent over the past two decades, the report said. Households headed by people ages 55 to 64 now spend 22 cents of each dollar to pay off old loans — about the same percentage as younger people, the report found.
The problem is not confined to the poorest Americans, many of whom have no retirement savings. Most of the people with accounts who are accumulating debt faster than retirement savings are older than 40, college educated and earning more than $50,000 a year, the report said.
More than a third of them, the report said, are older than 50, a time when financial planners say people should be paying down debt and increasing their efforts to prepare for retirement.
“My work confirms that people are reaching the threshold of retirement much more in debt than in the past,” said Olivia Mitchell, professor of economics and executive director of the Pension Research Council at the University of Pennsylvania’s Wharton School of Business.
Mitchell said the main reasons for the growing debt appear to be greater spending on housing, larger and more auto loans, and more credit card debt….”
Comments »CME Hikes S&P 500, Dow Jones, Nasdaq E-Mini Margins By 9%
“Remember when the CME and the administration punished speculative gold longs in 2011, and crude longs in 2012 by hiking or warning to hike margins beyond the breaking point for levered holders of futures contracts? It works for stocks as well. Last night, the CME may have taken Obama’s warning to the market a little too seriously, and announced a hike in the core E-Mini futures contracts of about 9% ….”
Comments »Real Wealth vs Perceived Wealth
“Why is there a fundamental mismatch between stock market performance as reported in financial headlines – and the actual retirement behavior of the many millions of Americans who own those stocks in their portfolios?
Using 15 years of stock market performance data and the type of analysis tools used by sophisticated wealth management professionals, we will solve that mystery in this research-based tutorial. The results may come as a major surprise, even for well read and financially literate investors who have been buying stocks for decades.
On the one hand, stocks have been in a sustained rally, with the markets recovering from the depths of 2008 and 2009 and finally moving on to all new highs. This should have created enormous wealth for tens of millions of long-term retirement investors who have stock-heavy investment portfolios in their retirement accounts.
Yet at the very same time, according to recently released government data as reported in Bloomberg and the Washington Post, the fastest growing group of workers in the United States is older than age 65, up 67% in 10 years, and their average weekly pay has climbed from $502 to $825 over that time.
Over a decade, there has been a three-part change in behavior among those aged 65 and older, with a reduction in the percentage of those retiring, an increase in full time work rather than part time work, and incomes that are higher than those of all workers on average. So people with higher wages than the rest of the population are not only not retiring, they are increasingly not slowing down either, but are continuing full time jobs.
Now where the mystery comes in, is that people who are older than 65 with successful careers and good incomes are the exact same people who would be expected to have substantial stock portfolios in their retirement accounts. So if stocks have in fact been creating so much wealth in recent years, why is it that the same segment of the population that owns the largest amount of those stocks are in practice the same group that is changing their retirement behavior in order to prolong their careers and keep their full income coming in?
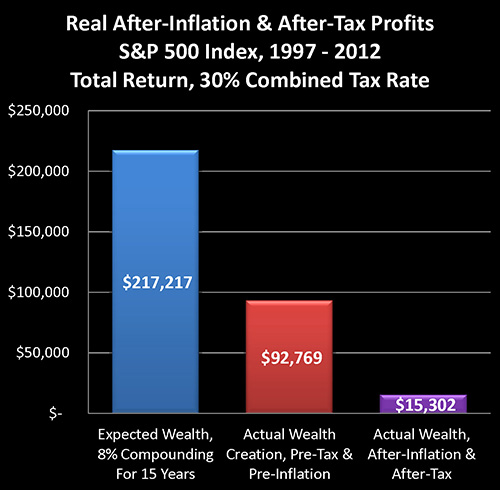
The explanation of the mystery can be found in the graph above, which is based upon historical performance of the Standard & Poor’s 500 index from the end of 1997 through the end of the 2012, as well as official US government inflation statistics for those same 15 years. As such, the graph should act as a reasonable proxy for the real world long term performance results achieved by tens of millions of American investors during those years.
Based on an assumed starting portfolio value of $100,000, the blue bar reflects expectations for the compounding of wealth through stock investment. It assumes an 8% average return – which has been a quite common assumption, particularly 15 years ago.
The red bar shows actual real-world performance on a total return basis, with price movements in the S&P 500 index, dividend payments and the reinvestment of dividend payments. It is much lower than expectations, but still substantially positive.
The purple bar shows what really matters – the purchasing power of average stock market investments on an after-tax and after-inflation basis. As shown above, in the real world for many millions of investors, the purchasing power of long term stock market profits has been virtually non-existent. If we compare what really matters – which is what money will buy for us on an after-tax basis – then real gains are a mere 7% of expected wealth gains.
The purple bar is what reconciles the mystery, and explains the divergence between the headline illusion of major profits and the reality of actual after-tax purchasing power in retirement that is currently driving the behavior of millions of investors.
As we will explore, the ultimate bottom line number of what our investments will buy for us after we’ve paid our taxes has been dominated by something that few average individual investors fully understand, which is the powerful and deceptive relationship between inflation and taxes.
What may come as a particular surprise is that these dramatic results are entirely based upon the officially reported 2.42% average rate of inflation over the 15 years. If our personal experience …..”
Comments »Greece is Expected to Be Approved for a $10.4 Billion Aid Program
“Euro-area finance ministers will probably approve the latest disbursement of bailout aid toGreece when they meet in Brussels later today, a European Union official said.
Teams from the so-called troika that oversees euro-zone bailouts reached a staff-level agreement with the Greek authorities on the policies needed to ensure that the country’s aid program “is on track to reach its objectives,” the troika said in a statement.
The troika comprises the European Commission, the European Central Bank and the International Monetary Fund. The IMF’s Executive Board is also due to consider approving the Greek review this month, according to the statement.
Approval of the agreement at the meeting of euro-area finance ministers that begins at 3 p.m. in the Belgian capital would be a first step toward Greece, which has been unable to tap bond markets since 2010, receiving payments of 8.1 billion euros ($10.4 billion)….”
Comments »$DB Puts Out a Report on 33 Stocks That Will Outperform
“Deutsche Bank’s U.S. Equity Strategy team led by David Bianco are concerned about stock market volatility in the near-term as interest rates rise.
“The S&P should stay above 1525 given tentative signs of 10yr yields stabilizing around 2.5% and unshaken oil prices and Euro,” wrote Bianco. “A further near-term jump in yields could spark fears of a surge and dislocate credit, FX, and commodity markets, but this is not likely.”
However, he continues to be bullish on the long-run. He sees the S&P 500 at 2,000 by the end of 2015.
With this framework in mind, Bianco and his team offer 33 buy-rated stocks on his latest “What To Buy Now” list.
Each have a market capitalization over $10 billion, a price-earning ratio on 2013 EPS below 20, 2013 EPS growth above 5 percent, and a net debt to market cap ratio below 30 percent (excluding Financials).
Comments »