“The Federal Reserve’s Quantitative Easing has given rise to an all time low in the money multiplier which, in turn, has a higher probability of rising than falling. Notwithstanding the recent explosion of personal debt, Chart #5 above shows an emerging propensity of the US public to want to save a higher percentage of their income and/or pay down debts. Therefore, the most likely driver of a rising ratio will be a rise in savings relative to money stock which, in turn, will place a downward pressure on corporate earnings. It follows that continuation of QE by the Fed will do nothing other than push the money multiplier ratio lower. Therefore QE is becoming impotent as a strategy for driving the US economy. By extension, if the savings rate continues along its early rising trend, this will likely be accompanied by recessionary conditions which, in turn, will place a downward pressure on Price:Earnings ratios.
There are two unconventional analysts who have come to my attention over the years and whose work is unique to them:
The first is Mr. Alan Newman, who publishes a report entitled “Pictures of a Stock Market Mania”. His latest report, dated November 5th 2013 can be viewed here: www.cross-currents.net/charts.htm ).
The second is Professor Didier Sornette, who’s bio can be viewed at (http://www.er.ethz.ch/people/sornette ) and whose stock-market relevant work is summarised on the following You-Tube of a TED Talk entitled “How can we predict the next financial crisis?”that he gave in June 2013.http://www.ted.com/talks/didier_sornette_how_we_can_predict_the_next_financial_crisis.html
If Professor Sornette’s model is to be believed, we can expect a significant market peak in mid November 2013 – see chart below: (source: Casey Research)
Chart # 1 – Time Singularity Forecast
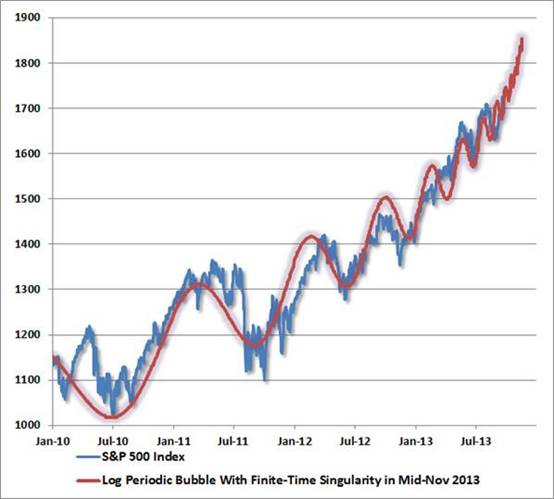
Of course, this begs the question as to whether this will be just another trading peak or whether it will be a significant peak.
My own view is that Alan Newman’s work should be seen as a backdrop to any analysis. From the time that Alan Greenspan came onto the scene, the Dollar Trading Volume (DTV) as a multiple of Gross Domestic Product has been rising. At the peak of the 1929 stock market bubble it was well over 100%. Now it is around 350%.
In 1929, the ratio of DTV to Market Capitalisation (the combined value of all companies quoted on the NYSE) was around 200%. Now it is just shy of 300%, having fallen from a peak of 400% in 2009.
Of course, this has occurred as a direct consequence of what has come to be known as “algorithm” trading and as an indirect consequence of the US Federal Reserve’s loose money and low interest rate policies.
A couple of days ago a friend sent me a Point & Figure chart of the gold price – which showed a “buy” signal. Within a day or so of his having sent it, the chart looked like this (source stockcharts.com)
Chart #2 – Point & Figure Chart of the Gold Price (Nov 6th 2013)
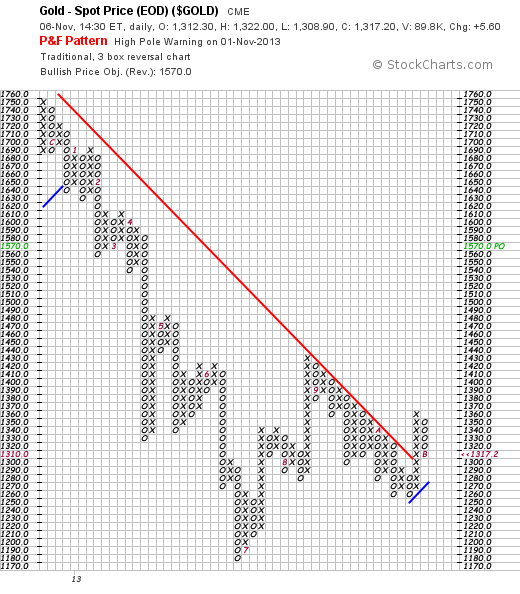
Note how the buy signal reversed itself with a high pole warming sell signal and that reversal coincided with a rise to a new high by the Dow Jones Industrial Index (not shown).
Of relevance, on November 6th 2013, the percentage of financial advisers who were bullish on equities was 82.4%, having pulled back from a high of 89.2% on May 29th. “Blue skies, nothing but blue skies”, do they see
Of course, this begs the question of when the stock market mania will end? Will it end around mid November, as per Sornette’s model? The short answer is: There is a high probability.
The chart below (courtesy Bigcharts.com) is worrying from two perspectives:
Chart # 3 – Monthly Chart of the Dow Jones Industrial Index.
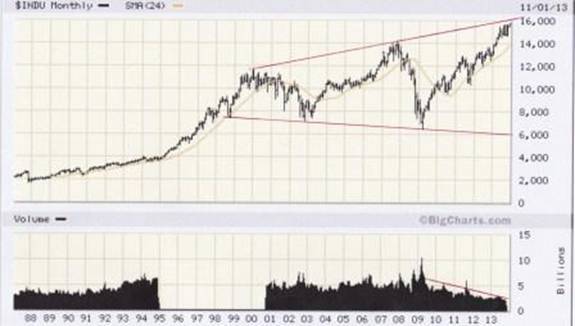
First, the reader will note the two diverging red trend lines…..”
If you enjoy the content at iBankCoin, please follow us on Twitter
