At the epicenter of the Exodus platform are mean reversion algorithms. For those new jacks on the site who are unfamiliar, it is a method of measuring stress points in the market, cross referencing it against historical movements, and then deducing some intelligence from it.
We do this for the overall market down to the individual stock. One of my favorite tools is the hybrid (cross between fundies and tech) oscillator that shows you the overbought/oversold condition of the sector. From this you can determine whether or not the sector is worth gambling on.
Quit kissing your teeth and BEHOLD what I’m about to show you.
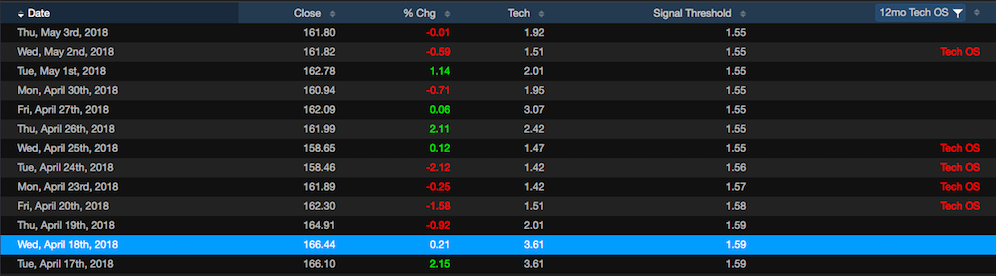
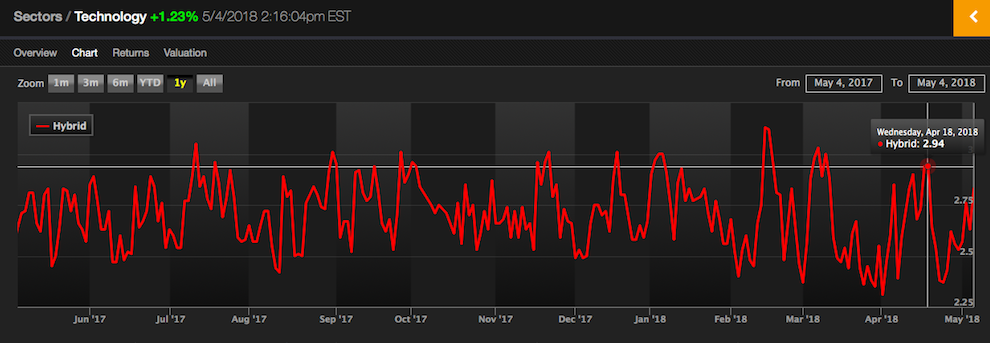
For this demonstration, I am using the price action of QQQ and our tech oscillator. On April 18th, 2018, the QQQ was trading $166, a short term top clearly demonstrated by the chart below. If you saw this on the 18th, you might’ve lightened up or at least held off on any new purchases, yes?
Now for the bottom.
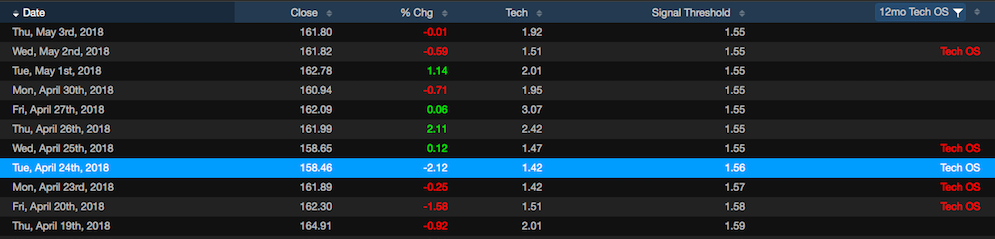
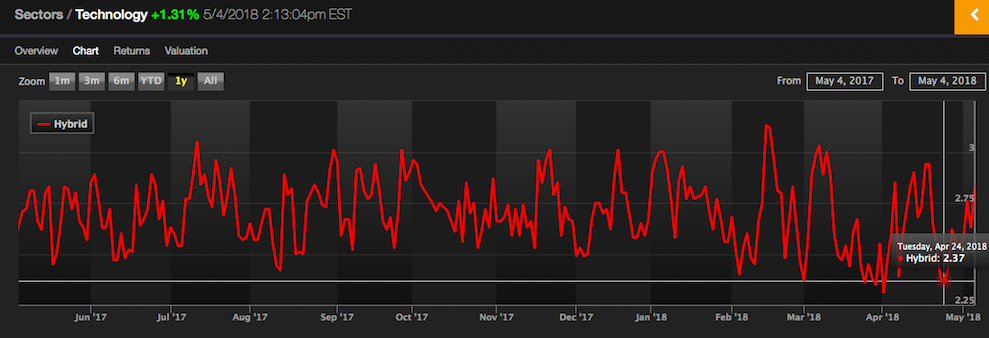
On April 24th, 2018, stocks were sucking dick and the QQQ was knifing lower, trading $158. Look at the chart below you fucking FAGlord — that’s what you call SHOMP (sublime harmony of mathematical precision). None of you ham and eggers can come close to matching this shit here. That was a bottom and markets melted up from there.
Any questions?
If you enjoy the content at iBankCoin, please follow us on Twitter


How thick of a rib eye do you like now?
Also, I need to notify you that I will be turning 42 1/2 in August. Nice knowing you Le Fly!
Nice try. The cut off is and always has been 47.5. I’ve got another 5 years left before I pass the torch onto Fly II, like the Pope.
The comment section on this blog stinks since sarc was banned. Free speech Fly, let him back.
You can enjoy comments like Sarc’s all day at Daily Stormer.
The ONE comment that made me laugh contained a reference to Dr Hufaaarr & Dr Necessitor (The Man with Two Brains). Unfortunately it linked out a doomsday apocalypse site.
Common mistake of chart technicians: judging past peaks and valleys based upon information not known at the time.
Example: you peak is marked as 2.94. So on April 18, how would you *know* that was the peak? Looking at your cahrt, you can see that the past peask were above 3. So it would be logical to think that your indicator was going to go higher, perhaps with a momentary dip below 2.9.
As for the bottom, your own table shows that you indicator called the bottom 4 days in a row.
No, I *do* think that you indicator is a GREAT tool, so don’t get me wrong. However, I think that you are assinging precision to it that you can only see looking backwards..
On a different note, has anybody looked at a YTD $SPY chart? Does that Descending Trainlgle look bullish to anyone? What about the fact that SPY just hit the 50-day MA resistanve line? -> bought some puts, waiting for 250
Hopefully one day you’ll get enough clients to move out of your Mother’s house.
But her cooking is so good!
Once it breaks through it’s 50 day moving average, it will. Didn’t you feel disappointed yesterday after it broke the 200 day MA and recovered? We haven’t topped yet, new highs later this year.
SPY is still > 200d MA and the 200d MA is still trending up
Okay, but think about the math behind your statement: the 200d MA is a average of 200 closing prices. For the 200d MA to trend down, you would need several **weeks** of prices **at or below** the current 200d MA. This means that the market will always peak several weeks before the 200d MA turns downward.
So my strategy may be high-risk by tryign to get in early, but you play is equally high-risk ignoring that the 200d MA will turn over well after the bear market is underway (and ignoring the near- term, multi-month chart pattern).
Numbers just outnumbered you the fuck out Phil, it only took 50 plus words and shit.
Moving averages are only “potential” areas of support or resistance. To make a trade without evidence of buyers or sellers AT those points is gambling. How many times have we breached the 50 day since ATH’s? Looks like 3 by my count. Didn’t really amount to anything of significant meaning. However, the long tail off the 200 day on good volume followed by a strong candle suggests there is evidence of buyers down there. Now we wait to see what happens at the 50 day. Point I am trying to make is nobody knows shit.
And by breach, I am mean to the upside. SPY found resistance at some arbitrary point beyond the 50 day.
I can attest that exodus is an exemplary paper trading platform.
I’ve been accused of many things, some malicious lies, some well-deserved. But kissing my teeth was never one of them. I protest.
Comment section chart analysis is a weak aids patient. Find yourselves in the Pelican room, lady boys and girls.