Here’s some data to get you prepared for the week ahead, courtesy of Exodus. You fuckers should be eternally grateful.
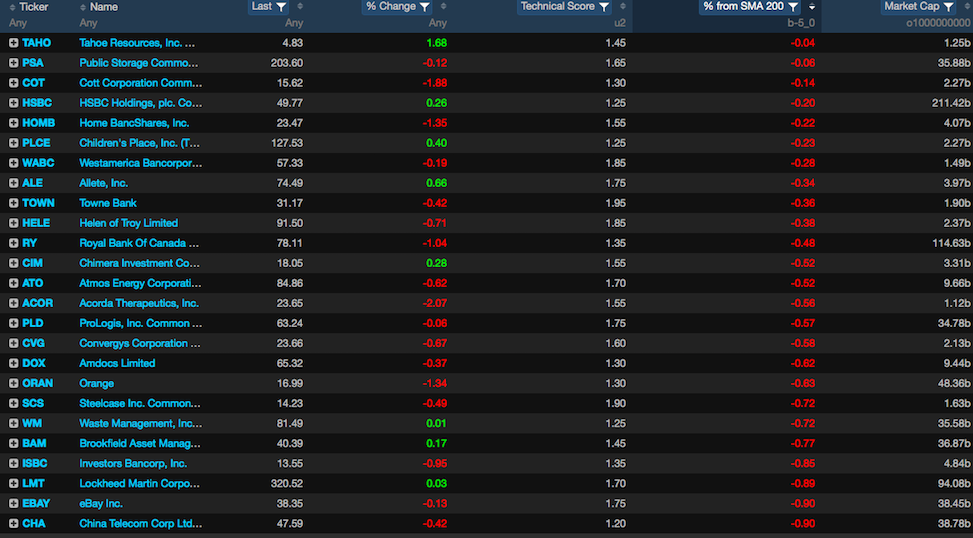
Here are stocks straddling the 200 day moving average. I know a lot of you are 200 dayFAGS, who love to buy stocks at this key support line. Some of these stocks might be breaking above the 200 day too. If I wanted to, I could simply screen for technicals and find out which one’s are strongest — but I don’t feel like doing it.
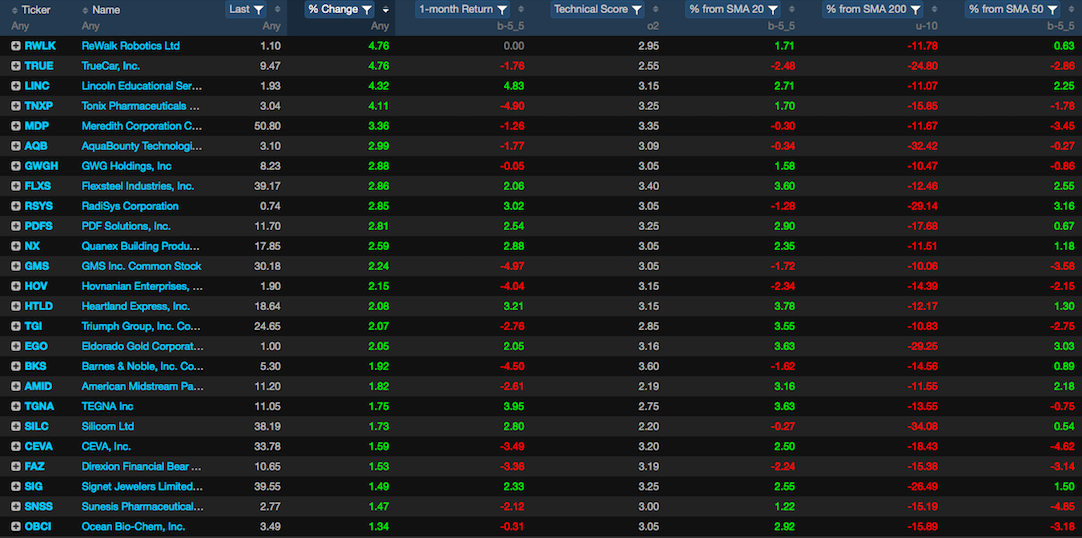
Here are stocks that produce a chart of consolidation. After fiddling with the moving averages, I’ve digitized what you cavemen search for in your 10 hours charting sessions in a click of the mouse. Here are stocks with nice charts. Again, I could further enhance this, and so could members of Exodus, but we don’t feel like doing it right now.
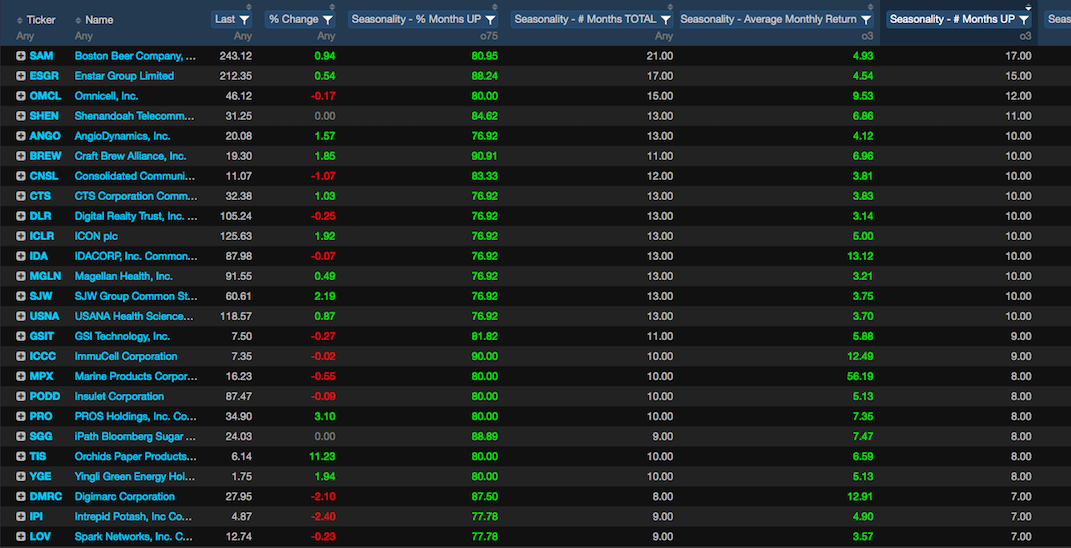
Here are stocks that really do well in the month of June. There are a lot of ways to skin this cat — I simply went for high percentage win rate and sorted by stocks with the most data. Looks like people like to get drunk in June.
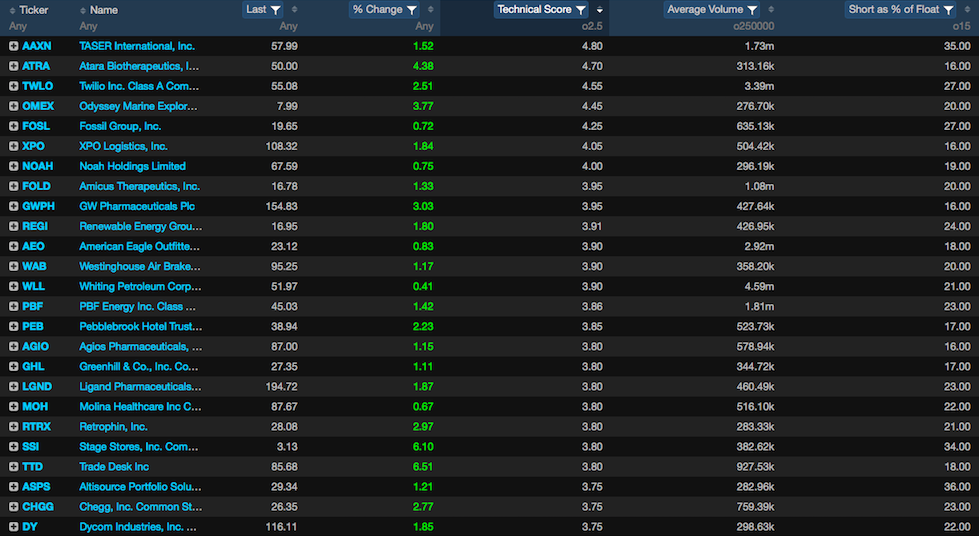
Here are stocks that are short squeezing higher — ranked high in technicals with a large percentage of the float sold short.
Lastly, here’s an interesting exercise. I like to profile for what’s working inside the platform. On the issue of buying stocks that are heavily shorted, there is always debate whether or not these stocks actually do better than stocks that are not shorted. Here is the data.
All stocks, 5,000+: median YTD return +0.32%
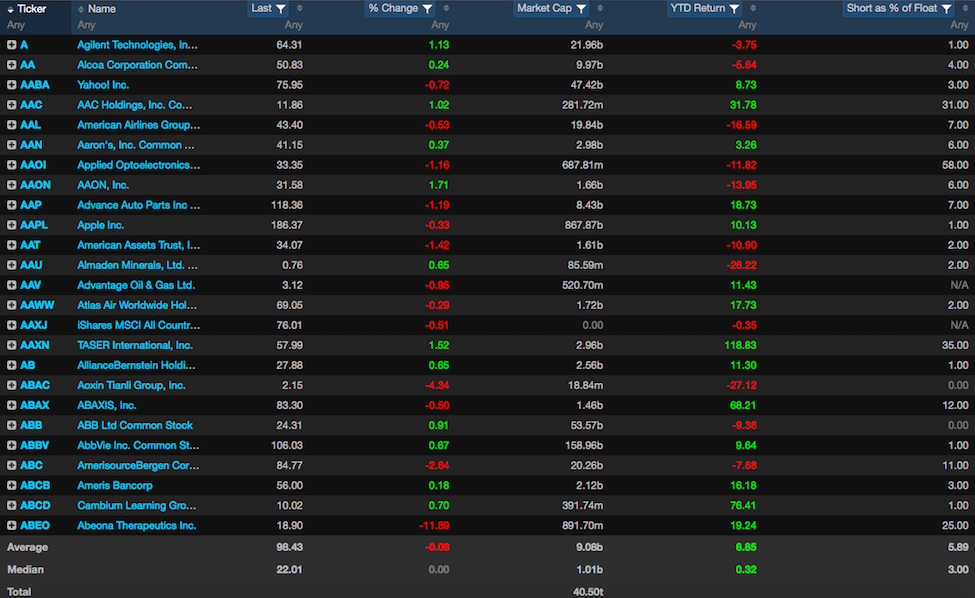
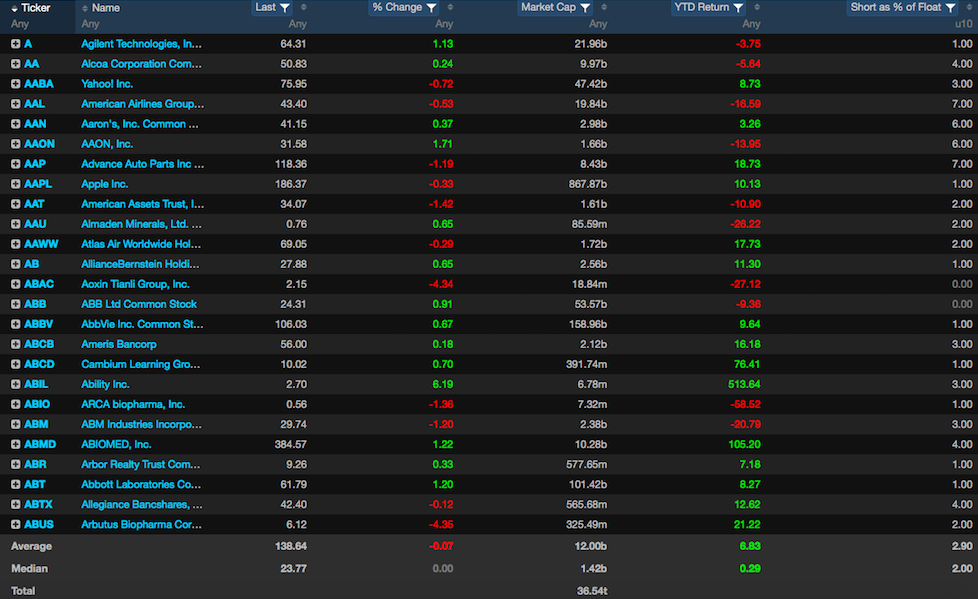
Stocks with less than 10% of shares sold short: median return +0.29%
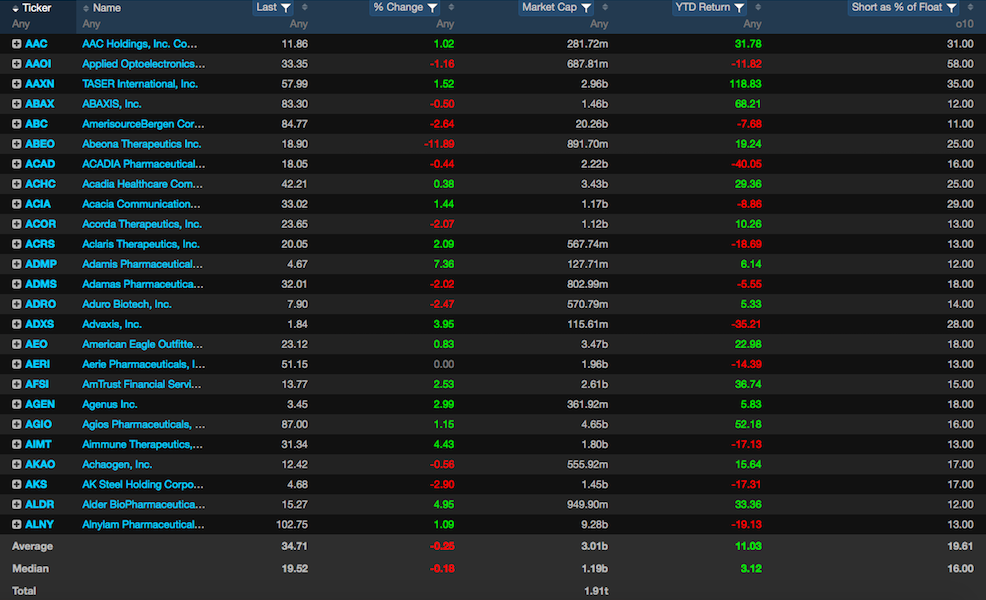
Stocks over 10%: Boom +3.12%
It’s with this sort of reverse engineering that I found the perfect combination or profile for investable stocks. This method is used in my quantitative strategies, posted every month.
If you enjoy the content at iBankCoin, please follow us on Twitter


$GWPH going ape
“On the issue of buying stocks that are heavily shorted, there is always debate whether or not these stocks actually do better than stocks that are not shorted….Here is the data. ”
Fly, do you not see the obvious problem with your data as presented? Do you want to take another crack at it or should I point it out for you?
Ok, late post, so no reponse.
Anyway, the problem with your data is that you are comparing *past* performance with *current* short ratios. This means that you aren’t showing that the most shorted stocks are more likely to outperform the market, but instead that stocks that outperform the market are more likely to be shorted. You are mixing up cause and effect.
A valid analysis would need to compare the short ratio on 1/1/2018 with the YTD performance..
Drawign conclusions from your data above is like looking at the heights of NBA players and concluding that playing basketball makes you taller.