iBankCoin
Home / Tag Archives: $SPY (page 2)

Tag Archives: $SPY

Alert! The BEAR has broken through MAJOR SUPPORT

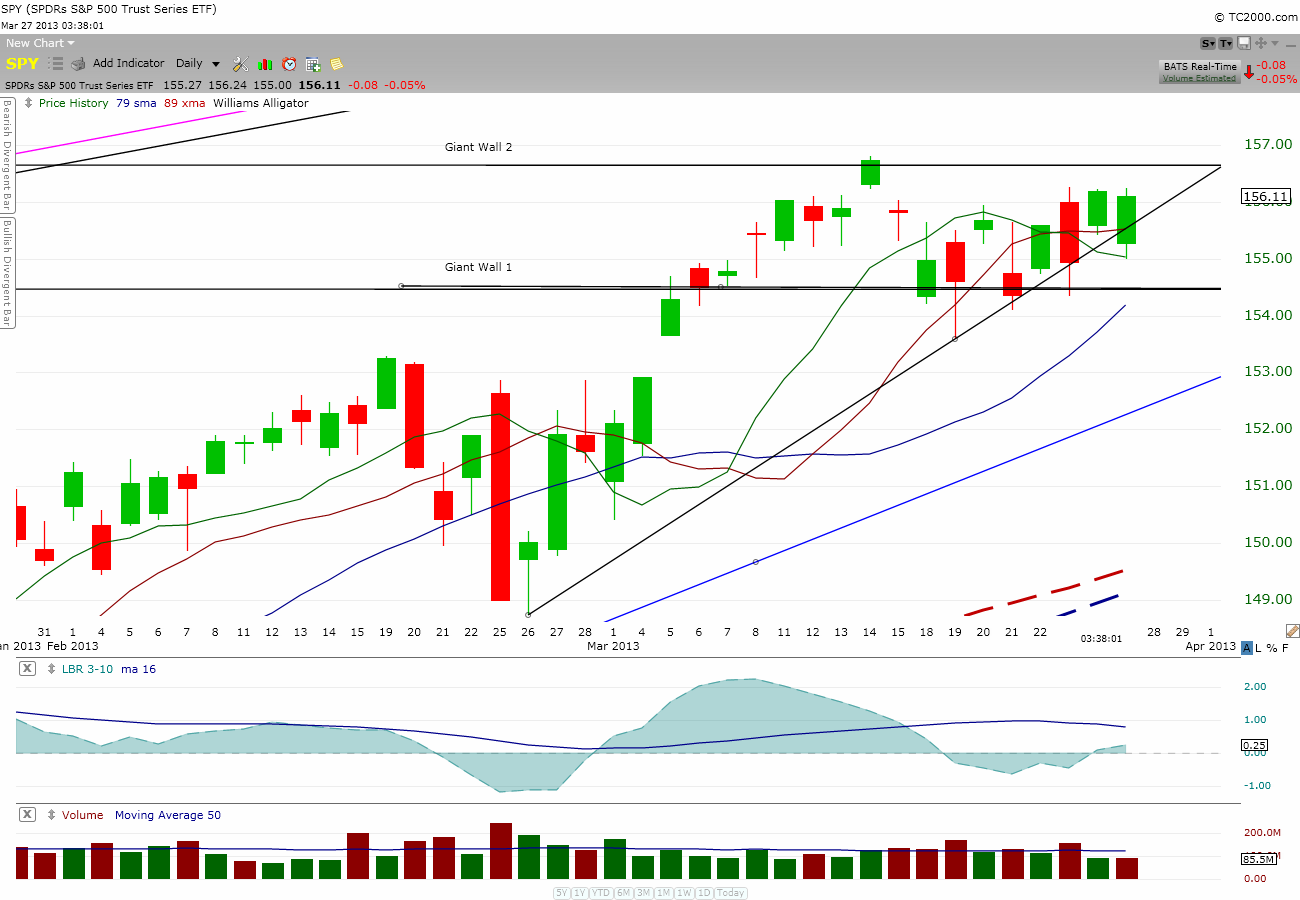
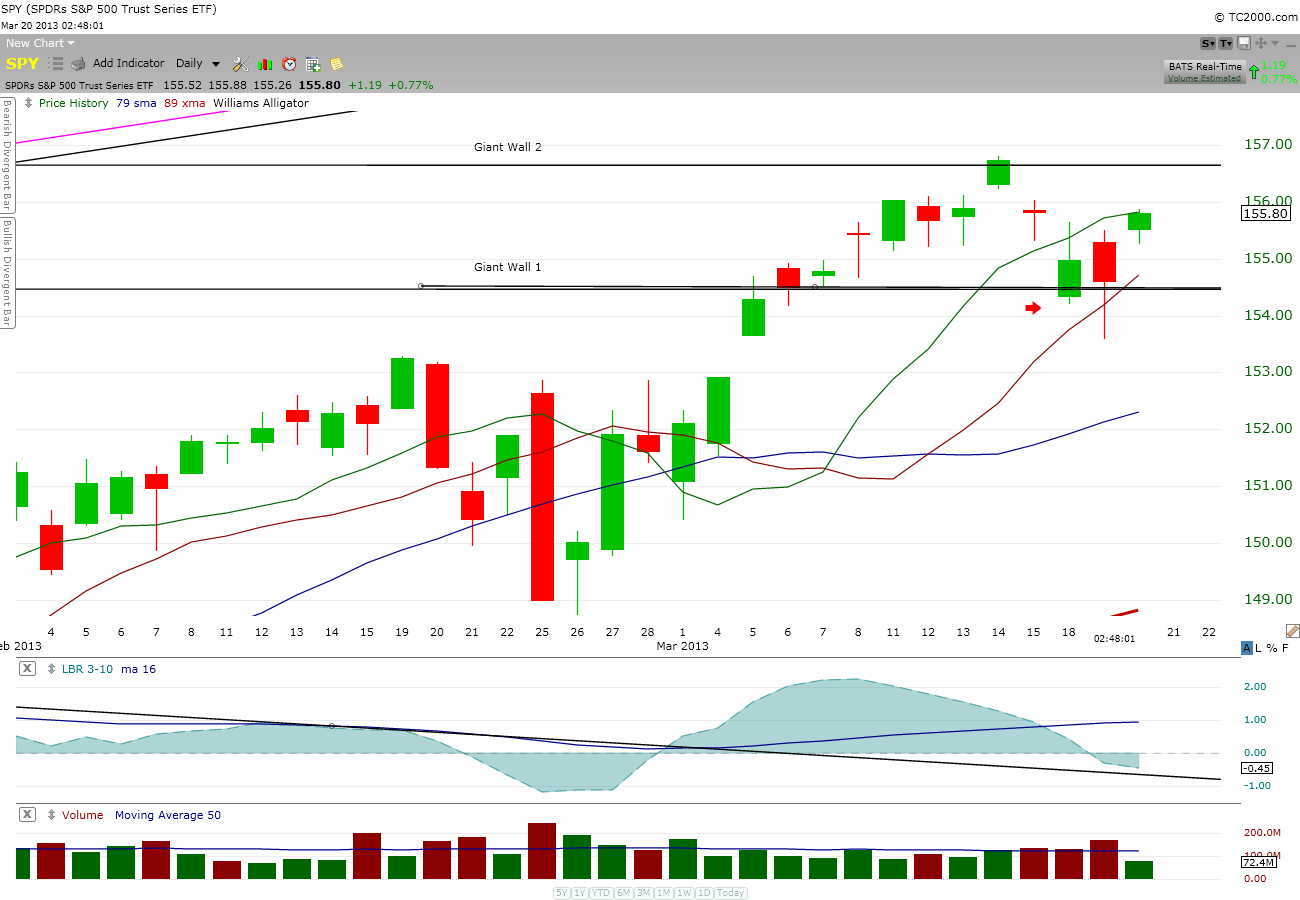
Take a look at the $SPY daily chart below.

SPY_Daily

Market opened below the Giant Wall One support and that to me was a big red flag for the bull.  It’s going to take a LOT more effort to climb back up to take out the resistance of this Giant Wall One which was once a support.

Needless to day, I placed all my swing order trades to sell at open using market order.  There was no if or but or “wait to if there is a bounce” type of mental digression.  All were for small losses except for $FB which I still had a healthy gain.  When a bad payroll data came out and market tanked like this before market open, I like to stand aside with more cash and see what happen next.  I do not like to watch with my cash at risk.

The way I see it, all mini-rallies are shortable.  I’ll be looking for short as a day-trade.

Holding only my position trades LRAD, AMRN, TINY and 67% cash.

Be safe!

My 2 cents.

Comments »

Tomorrow is judgement day

Be prepared to hold on to your wallet…

In order for the Evening star to be confirmed totally bearish, price needs to take out the low of today and never look back.

Currently, $SPY is making a valiant attempt to bounce back.  Will it hold?

Which way will it go tomorrow?

Stay tune.

Meanwhile I’ve raised my cash level to 61%.

Be safe.

My 2 cents.

Comments »

Here comes the dreaded evening star

Well, we are finally being dealt the dreaded evening star bearish candlestick formation.  And the worst part is that it is occurring at the level of GW2 which is usually an indication of a topping pattern.  In a manner of speaking, the probability of a nasty correction is high.  So, hold on to your rail or cut your losses.

Like The Fly, I’m building up cash by getting rid of my swing trades except for the recent biotech I’ve bought ($MNKD & $APRI) and $FB.  However, once these three start to turn red, I’ll dump them for cash.

Below is the daily $SPY chart:

SPY_Daily

Look at that ugly red bar today? Yuk!  Notice also that the short-term up-trendline is broken soundly as of now.

Currently holding 43% cash.

Be safe.

My 2 cents.

Comments »

Where’s the bear?

Wait a minute, wasn’t there supposed to be bear around here?  Where did it go?

If the Bull can continue to piss on the bear then the bear may finally get the message- the BULL will take the GW2 by end of this week!

Take a look at the $SPY daily chart below:

SPY_Daily

Does it look like the bear is in control?  No?  I see more green bars than red.  Not only that, I see the uptrend is still inside the uptrend line.  On closer look, we are ALMOST there at GW2!

Get ready to celebrate an historical event of our mankind driving the stock market into an historical high again.

Yipee YapaDoo!

Oh, don’t mind me, I’ve been smoking too much $POT…

My 2 cents.

Comments »

When does seesaw becomes a whipsaw?

It is when you are whipped for putting chewing gum under a public park seesaw in Singapore.

Today is a day to be cautious.  I sold all my swing trades pronto at open without thinking much.  All for small losses. I even reduced position size on $SZYM with the intent to buy them back cheaper.

So far, all mini-rallies are being countered with a bear attack; therefore if you are thinking about bargain hunting, you may want to put a tight stop “just in case”.

Below is the 1m $SPY chart:

SPY_1m

Be safe!

My 2 cents.


Comments »

This stubborn bear is beginning to annoy…

Take a look at the 15m $SPY chart below:

SPY_15m

The market opened and rose up nicely and then had a waterfall price drop to show for the day.  If you are not annoyed then I take my hat off for you.  But my internal radar alerted me to move to cash; therefore, I spent all morning liquidating all my swing trades position and raised my cash to 50% as well.  (I said ‘as well’ because I just read The Fly posted that he was also at 50% cash.)  Thus, in a manner of speaking, I fired all my swing trade positions today.  However, due to an incessant pleading from $DCTH, I hired it back for a temporary basis to see if it can prove itself to make me some dough.

Take a look at the daily chart below, if the bear has its way, price action may just as well drop below the GW1 support.  Sometimes, it is better to be safe than sorry.

SPY_Daily

Be safe!

My 2 cents.


Comments »

Consolidating in the twilight zone… Oop! I meant twi-walls zone

Today $SPY bounce confirmed the solidity of Giant Wall One as a support.  Thus, price action is now consolidating inside the two Giant Walls.

I see this as a confirmation that the bear is not winning the war here; otherwise, $SPY would have fallen under GW1 and created widespread panic.  Last night before I went to bed, SP500 was printing negative 2.50 but I told myself that I would wake up to see a positive SP500; lo and behold, I was right.  Why would I think that?  That is because I see the GW1 as a huge support.  You see, these two mythical walls from 2007 and 2000 hold a lot of psychological power among us simply because of its historical significance.  Thus, each of these two walls can either be a powerful resistance or support.  It just so happen that these two walls are in the vicinity of each other that we have a twi-wall zone that holds such unfathomable power.

Consider ourselves lucky to be witnessing such historical price interaction inside these two mythical walls.  Due to the steeper angle of this current rally, my money is that we are taking out GW2 shortly.

Take a look at the daily chart below and you will understand where I’m coming from:

SPY_Daily

My 2 cents.

Comments »

Consolidation with bias to the upside

The daily $SPY chart below shows that price action is bouncing off the Giant Wall 1 but still below the resilient Giant Wall 2.

SPY_Daily

The weekly chart below shows that a solid uptrend is still intact.  I like the fact that we have a green weekly bar in mid-week.  If this is a red bar with price below the GW1, I would be worry; however, current green bar provides positive bias to the upside.  My bet is that by end of week, $SPY will attempt to breach GW2 once again.

SPY_weekly

My 2 cents.

Comments »

The battle at Giant Wall 1

Breaking news from ZENews!  Sally Comegetme is on location reporting…

“Zen, we have a fierce battle going on here but I can see the Bull is putting a strong defense.  From where I stand, I can see the Bull is still fighting in the proximity of the Giant Wall 1 and the Bear could not move the bull away from the wall.”

Without warning, an arrow zipped right through b/w Sally and the cameraman and almost threw the cameraman off balance to the ground.  The camera was accidentally pointed to the sky for a brief seconds during the tumble and we could see a dragon flying its way down to the bear camp with fire shooting from its mouth.

“Whoa! Is that a dragon I just saw?”

“Yes, but they are friendly to to the Bull, Zen.  Wow!  Did you see that Zen, the Bear camp just light up like a Christmas tree!   Way to go, dragon-bull!”

Without warning, the connection was cut and we lost the picture of Sally.

Well, look like the Bull may be able to come back on this one.  If you look at the SPY weekly chart below, we are forming a doji bar right at the Giant Wall 1 support.  In other words, the support is holding.

SPY_weekly

The daily chart below doesn’t look too bad either.  I like the longer tail at the bottom; this signify the bull is making a valiant fight back.

SPY_Daily

Zen out.

My 2 cents.


Comments »

This 3rd multiyear SPY rally has a steeper angle of ascending

Take a look at the monthly $SPY chart below:

SPY_Monthly

I create parallel trendline of the recent 2009-2013 rally and lay it on the last two rallies.  You can tell the angle of ascending of this current rally is steeper than the last two.

What does that mean to have a steeper angle of ascending? You asked.

Well, it could mean the following theories:

1) There is a lot of money in the system going back into the market

2) There is a lot more money than the prior two rallies going back into the market

3) The universe is always expanding, along with our population; hence there are much more money going back into the market than ever before.

4) With so much money wanting to go back into the market, the speed of ascending of this rally is faster; hence the steeper angle of ascending.

5) Giving my 2 cents economic theories from the above, there may be a lot of pent-up power and money waiting to go back to the market that the two great walls of resistance will be taken out pretty soon.  Well, the first one has already been taken out; the second one will be a matter of time now.

There, there.  We may have a mother-of-all-rally this year.  My earlier panic-attack, I learned with the help of  The Fly, has to do with my overweight on biotech speculation.  11 of my 14 positions was in Biotech.  No wonder I panic when I saw the $PACB red bar Friday morning.

Btw, this is a monthly $SPY chart, so there will be wiggle in the daily bar; so trade accordingly.

My 2 cents.

Btw: I change my username from zenhunter to TradingMy2cents.  Time to reinvent myself…

Comments »