Â
Comments »Keeping an Eye on the Trannies
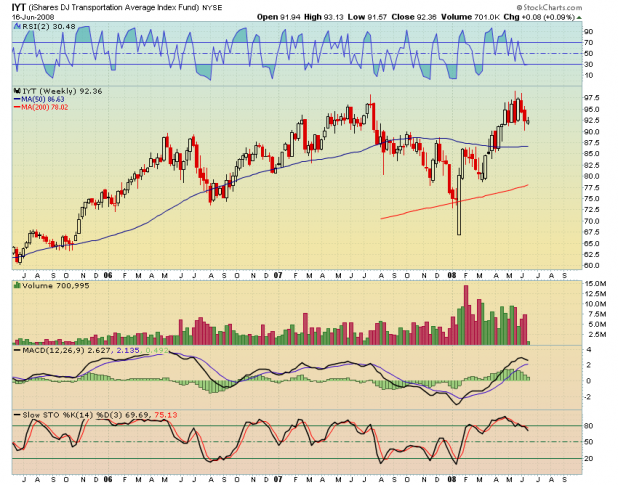
This weekly chart of [[IYT]], the ETF that tracks the Dow Jones Transports, looks very toppy. Specifically, the railroad tracks that have formed (Isn’t that what W. O’Neil called them?) Â through April, May, and June show a great deal of churning and volatility, with little progress made.
I made the mistake of including the 50 and 200 week average rather than my usual 10 and 40 week averages. I’m not fixing the chart, so just ignore the moving averages on the weekly period.
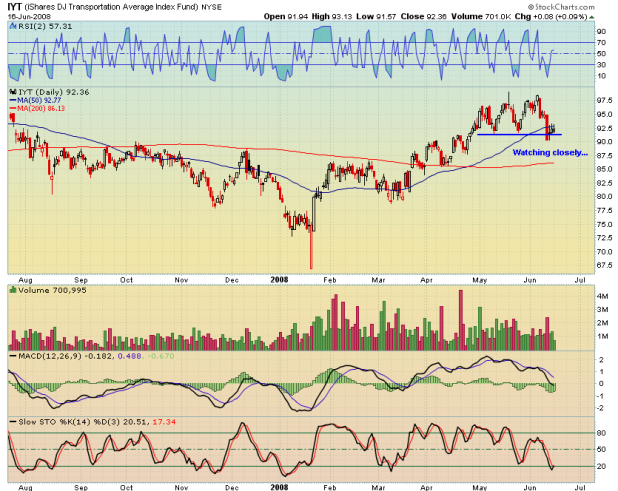
The daily chart shows a break of the trend and the 50 day average. There have been several quiet inside days which have consolidated just above support and beneath the 50 day average. I may take a small short position here with a tight stop above the 50 day. I believe there is probably 7 points of downside should that support break. Should oil break, I imagine IYT will want to sprint to new highs, so caution is advised.
Comments »The Daily Breakout
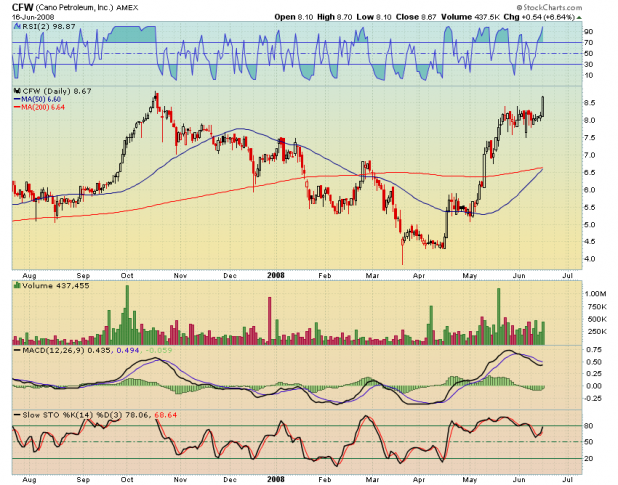
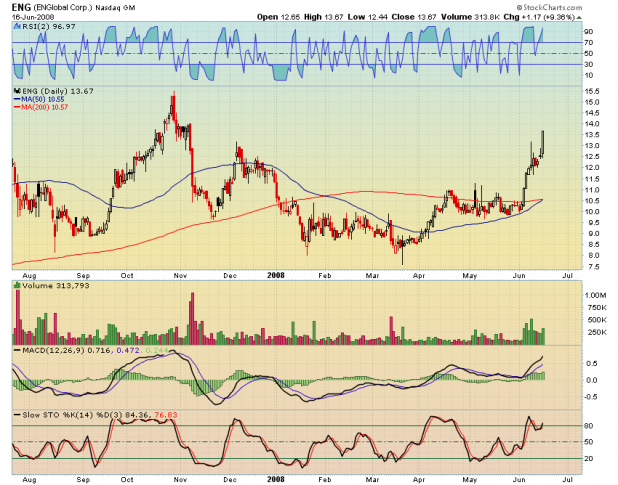
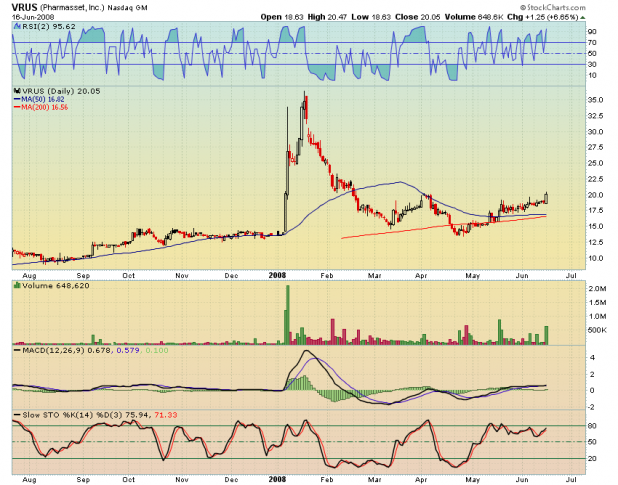
Energy stocks continue to break out. I’ve also included a biotech just in case anyone is feeling extra brave.
[[CFW]] Cano Petroleum, Inc., together with its subsidiaries, operates as an independent oil and natural gas company in the United States. [[ENG]] ENGlobal Corporation, through its subsidiaries, provides engineering and professional services principally to the energy sector in the United States and internationally.Once energy related names blow up, maybe you can take whats left of your account and go for a dice-roll on a some biotech.
[[VRUS]]Â Pharmasset, Inc., a clinical-stage pharmaceutical company, focuses on discovering, developing, and commercializing drugs to treat viral infections. Its primary focus is on the development of oral therapeutics for the treatment of hepatitis B virus (HBV), hepatitis C virus (HCV), and human immunodeficiency virus (HIV). Comments »RSI(2) Oversold Play: MYGN
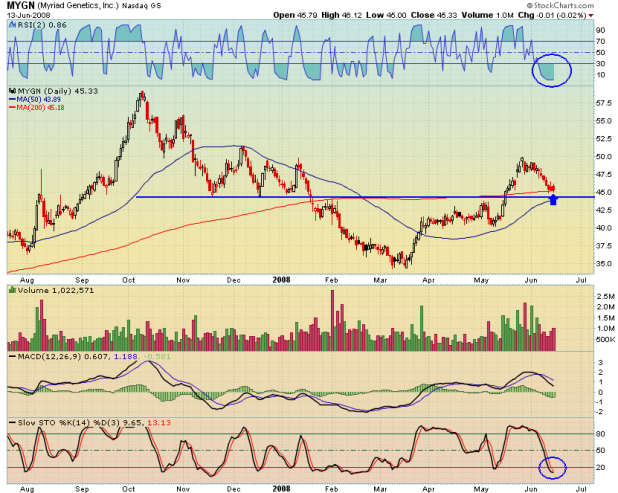
The RSI(2) Oversold Play seeks to identify a stock that is below 2 on RSI(2), and will have pulled back to both moving average support and a major trendline/support level.
[[MYGN]] has found support for the last 3 days right above the 200 day average. The 50 day average is rising and is only 2.5 points beneath the 200 day. The blue line represents an area of long term support. MYGN bounced three times from this area in 2007 and was twice rejected by this level in 2008. It now sits just above it.There are no guarantees of a bounce here, but I believe that when these three factors are in play at the same time, the chances are good.
A word about biotech. Fly says playing biotech is like playing catch with hand grenades: Eventually you’re gonna get an arm or leg blown off.
Comments »Indexes Print Bullish Weekly Closes
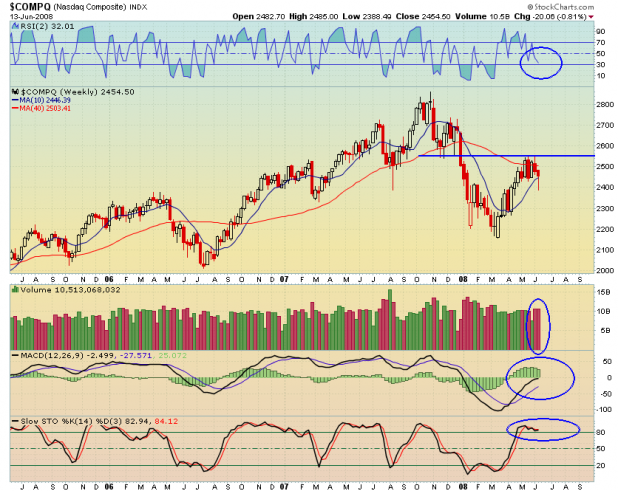
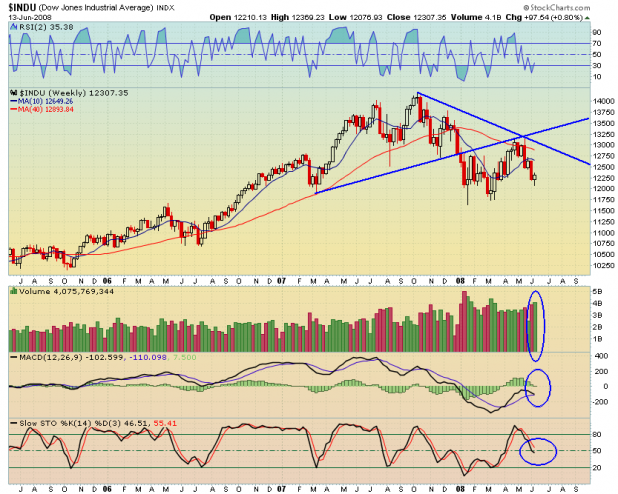
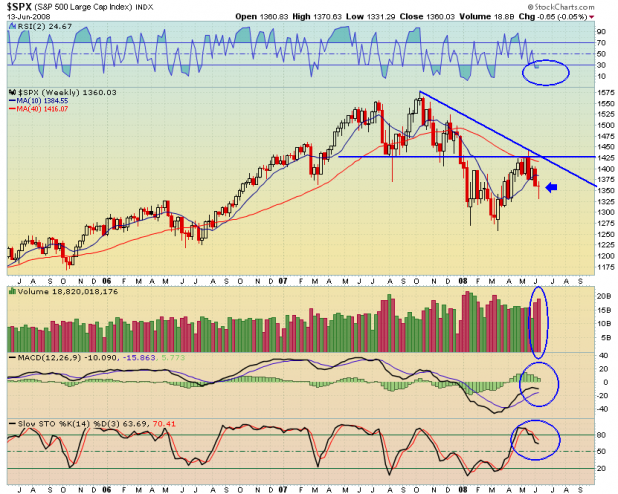
The indexes printed a variety of bullish weekly closes. The Nasdaq printed a bullish hammer, the S&P formed a slightly bullish doji, while the Dow Jones actually finished up on the week. Hat tip to Bill Rempel for bringing the hammer to my attention.
Bill is bullish, and believes the markets have put in an intermediate to long-term bottom. While I disagree, he is able to make a good case for his beliefs.
Looking at the weekly Nasdaq chart above, we see significant resistance has developed at 2550. MACD is starting to roll over and the Stochs are overbought. While I have not tested RSI(2) on a weekly basis, it is interesting that the indicator is not yet oversold.
I would not be at all surprised to see the index again challenge the 2550 area, but my suspicion and intuition is that the March lows will be tested before the index can break 2550.
The Dow Jones did manage to close up for the week with volume swelling to one of the highest weeks of 2008. In a post about a week ago, it was mentioned by Chivas that 12,250 should be Dow support, and I agreed. The area has held, for now.
Here is the thing about the Dow. It is only 550 points from the March lows. With volatility the way it is, that is 2 days worth of movement. Why not test it? I firmly believe it will be tested, and I know it seems simple-minded, but I think it will be tested just because. The lows are like a magnet. The closer the index gets to them, the stronger the pull.
Should the Dow continue back up, I will look for resistance around 12,800, or near the primary downtrend line and the 40 week average. Should the Dow rally, but then be unable to surpass the 10 week (50 day) moving average, I will be looking for another quick flush lower.
The SPX printed high volume this past week. This volume is the highest since January and February. On a weekly basis, it is still nearer to overbought than oversold, according to the Stochs, while RSI(2) is nearing oversold. To me, this just mean more volatility. I’m looking for another 25 points of rally, taking the index to 1385 area, before reversing again. I will be watching the 50 day average very closely for the SPX. Like the Dow, should the index fail to overtake the moving average, I believe there will be another swift move downward.
One final note. If one observes the weekly candles in May, across the indexes, the “railroad tracks” become apparent. I believe William O’Neil coined the term railroad tracks to describe several weeks of long candles, with volatile up and down motion. He associates this pattern with tops. I have to agree with William and not Bill that the May highs will likely be an intermediate term top.
Comments »Strategy Results for the Week
I did close out some very profitable trades Monday, but I did not include them here, as they were included in last week’s mark to market summary.
This week saw 3 trades entered, and all three were closed with gains. The peformance summary shows 9 trades, but that is because I scaled out of the 3 initial positions.
Psychologically, this week was a difficult period to be buying weakness, but it did pay off.
Since the inception date of May 19th, the strategy account is showing a return on initial capital of 4.5% and an annualized rate of 63.53%
Comments »The Important Matter of Ragin’ Cajun and RIMM
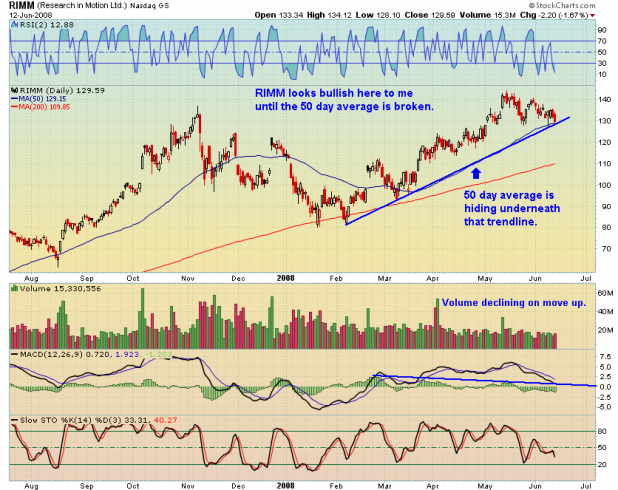
When I heard Cajun’ talking about being a RIMM bear, I had to take a look at the RIMM chart. I mean, when Cajun’ gets bearish on the perennial tech favorite, either he is going to be dead-on right, or there is something that is out of alignment in the universe.
Now Cajun’ is not known for being wrong very often, so I believe that something is out of alignment here.
When I see the chart, I see a decent looking breakout that is testing a pivot point and the 50 day average. Granted, it is not perfect, as volume has been declining. But, I would not want to be making a lot of bearish bets on RIMM, just yet.
All that being said, should the 50 day average and the trendline get broken, I think RIMM could see $110.00 very quickly.
Comments »
