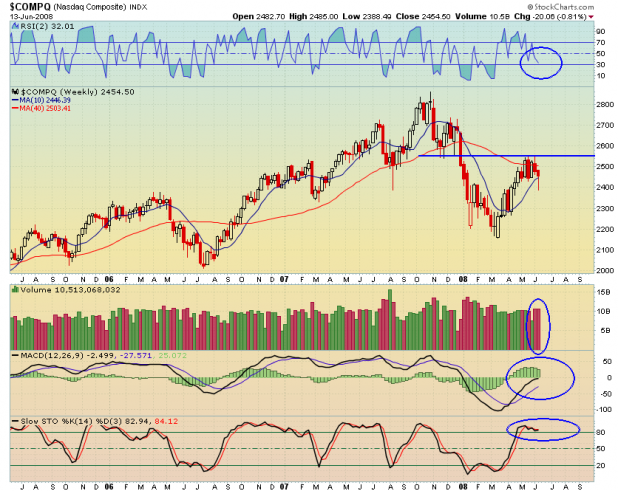
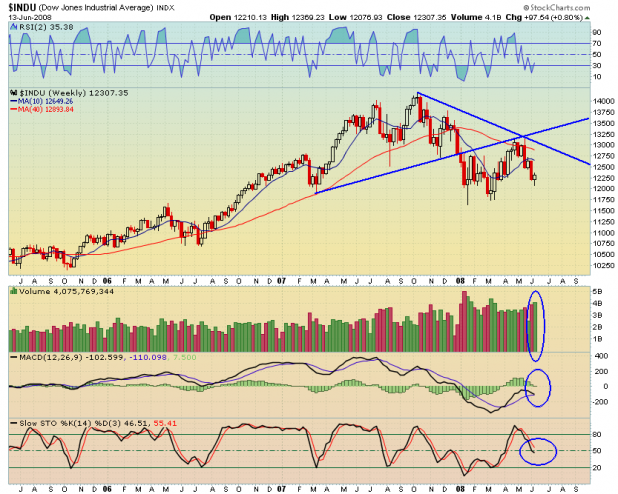
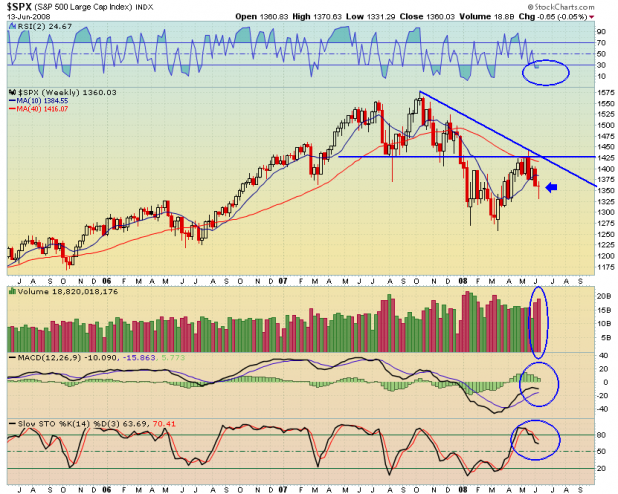
The indexes printed a variety of bullish weekly closes. The Nasdaq printed a bullish hammer, the S&P formed a slightly bullish doji, while the Dow Jones actually finished up on the week. Hat tip to Bill Rempel for bringing the hammer to my attention.
Bill is bullish, and believes the markets have put in an intermediate to long-term bottom. While I disagree, he is able to make a good case for his beliefs.
Looking at the weekly Nasdaq chart above, we see significant resistance has developed at 2550. MACD is starting to roll over and the Stochs are overbought. While I have not tested RSI(2) on a weekly basis, it is interesting that the indicator is not yet oversold.
I would not be at all surprised to see the index again challenge the 2550 area, but my suspicion and intuition is that the March lows will be tested before the index can break 2550.
The Dow Jones did manage to close up for the week with volume swelling to one of the highest weeks of 2008. In a post about a week ago, it was mentioned by Chivas that 12,250 should be Dow support, and I agreed. The area has held, for now.
Here is the thing about the Dow. It is only 550 points from the March lows. With volatility the way it is, that is 2 days worth of movement. Why not test it? I firmly believe it will be tested, and I know it seems simple-minded, but I think it will be tested just because. The lows are like a magnet. The closer the index gets to them, the stronger the pull.
Should the Dow continue back up, I will look for resistance around 12,800, or near the primary downtrend line and the 40 week average. Should the Dow rally, but then be unable to surpass the 10 week (50 day) moving average, I will be looking for another quick flush lower.
The SPX printed high volume this past week. This volume is the highest since January and February. On a weekly basis, it is still nearer to overbought than oversold, according to the Stochs, while RSI(2) is nearing oversold. To me, this just mean more volatility. I’m looking for another 25 points of rally, taking the index to 1385 area, before reversing again. I will be watching the 50 day average very closely for the SPX. Like the Dow, should the index fail to overtake the moving average, I believe there will be another swift move downward.
One final note. If one observes the weekly candles in May, across the indexes, the “railroad tracks” become apparent. I believe William O’Neil coined the term railroad tracks to describe several weeks of long candles, with volatile up and down motion. He associates this pattern with tops. I have to agree with William and not Bill that the May highs will likely be an intermediate term top.


Nice one shed.
I disagree with Bill too.
Anyway, do you remember the quantifiable edges study (I believe it was there, maybe it was the IBD blog) that tested how important volume is in the scheme of market movements? It found that volume was somewhat unimportant in determining direction. Sorry I can’t link the article. Do you remember it/your thoughts on it?
Also, side point, I have a whole shitload of iBC Machine evidence (definitely not to be discounted, given its track record) that says the “real” bottom was in march, not january, fwiw. Off in iBC land, indices are still bearish, though recovering off Thursday’s selloff.
That might be a semantics issue but I was wondering your viewpoint there.
12,5 s
12,25 s1
12,8 R
13,15 R1
sound about right?
http://ibdindex.blogspot.com/2008/03/volume-affect.html
There’s the study for you Danny.
I agree the bottom that I’m watching was March. I think if we look at the indexes as failing to break out of a double bottom base (excepting maybe the Nasdaaq), then March has to be the bottom.
I’m not sure about the code at the bottom. I’m sure its simple and I’m just too old or something.
thanks.
Re my code, yes you are way, way too old, lol
they are support resistance levels in the dow, as I see em. probably so obvious it was a waste posting them, now that you know what they mean.
12,500 support
12,250 support 1
12,800 resistance
13,150 resistance 1
cool brah?
See, I knew I was too old to get it.
I’m really doubtful that the Dow will get past 12,6-12,75. I’m really curious to see how it handles the 50 day.
Should it be able to regain that average, then I agree with your resistance levels.
I’m amazed at how complancent everyone is, and fearless.