iBankCoin
Joined Nov 11, 2007
1,458 Blog Posts

Strategy Trading Results for the Week

  All Trades
Long Trades
Short Trades
Total Net Profit $908.34 $908.34 $0.00
Gross Profit $908.34 $908.34 $0.00
Gross Loss $0.00 $0.00 $0.00
Profit Factor n/a n/a n/a
       
Roll Over Credit $0.00 $0.00 $0.00
Open Position P/L $0.00 $0.00 $0.00
       
Select Total Net Profit $908.34 $908.34 $0.00
Select Gross Profit $908.34 $908.34 $0.00
Select Gross Loss $0.00 $0.00 $0.00
Select Profit Factor n/a n/a n/a
       
Adjusted Total Net Profit $565.02 $565.02 $0.00
Adjusted Gross Profit $565.02 $565.02 $0.00
Adjusted Gross Loss $0.00 $0.00 $0.00
Adjusted Profit Factor n/a n/a n/a
       
Total Number of Trades 7 7 0
Percent Profitable 100.00% 100.00% 0.00%
Winning Trades 7 7 0
Losing Trades 0 0 0
Even Trades 0 0 0
       
Avg. Trade Net Profit $129.76 $129.76 $0.00
Avg. Winning Trade $129.76 $129.76 $0.00
Avg. Losing Trade $0.00 $0.00 $0.00
Ratio Avg. Win:Avg. Loss n/a n/a n/a
Largest Winning Trade $253.44 $253.44 $0.00
Largest Losing Trade $0.00 $0.00 $0.00
Largest Winner as % of Gross Profit 27.90% 27.90% n/a
Largest Loser as % of Gross Loss n/a n/a n/a
       
Net Profit as % of Largest Loss n/a n/a n/a
Select Net Profit as % of Largest Loss n/a n/a n/a
Adjusted Net Profit as % of Largest Loss n/a n/a n/a
       
Max. Consecutive Winning Trades 7 7 0
Max. Consecutive Losing Trades 0 0 0
       
Max. Shares/Contracts Held n/a n/a n/a
Total Shares/Contracts Held 774 774 0
Account Size Required n/a n/a n/a
Total Commission $11.24 $11.24 $0.00
       
Return on Initial Capital 1.82%    
Annual Rate of Return 153.65%    
Buy & Hold Return (2.10%)    
Return on Account n/a    
Avg. Monthly Return $908.34    
Std. Deviation of Monthly Return n/a    
       
Return Retracement Ratio n/a    
RINA Index n/a    
Sharpe Ratio n/a    
K-Ratio n/a    
       
Trading Period 4 Dys, 6 Hrs, 43 Mins
Percent of Time in the Market 76.68%    
Time in the Market 3 Dys, 6 Hrs, 45 Mins    
Longest Flat Period 23 Hrs, 57 Mins    
       

Max. Equity Run-up(Daily)


$1,576.77    
Date of Max. Equity Run-up 06/06/08 16:15    
Max. Equity Run-up as % of Initial Capital 3.15%    
       

Max. Drawdown(Daily)


Value ($427.26) ($427.26) $0.00
Date 06/05/08 16:15    
as % of Initial Capital 0.85% 0.85% 0.00%
Net Profit as % of Drawdown 212.60% 212.60% n/a
Select Net Profit as % of Drawdown 212.60% 212.60% n/a
Adjusted Net Profit as % of Drawdown 132.24% 132.24% n/a
       

Max. Drawdown(Trade Close)


Value $0.00 $0.00 $0.00
Date 06/02/08 09:31    
as % of Initial Capital 0.00% 0.00% 0.00%
Net Profit as % of Drawdown n/a n/a n/a
Select Net Profit as % of Drawdown n/a n/a n/a
Adjusted Net Profit as % of Drawdown n/a n/a n/a
       
Max. Trade Drawdown ($389.30) ($389.30) $0.00


I have two open positions that are marked to market here. Trust me, it is highly doubtful that they will be closed for a loss.

I never had more than half my available capital in the market, so for fun, you can double the return on initial capital.

Comments »

Middlebrook Almost Killed Me

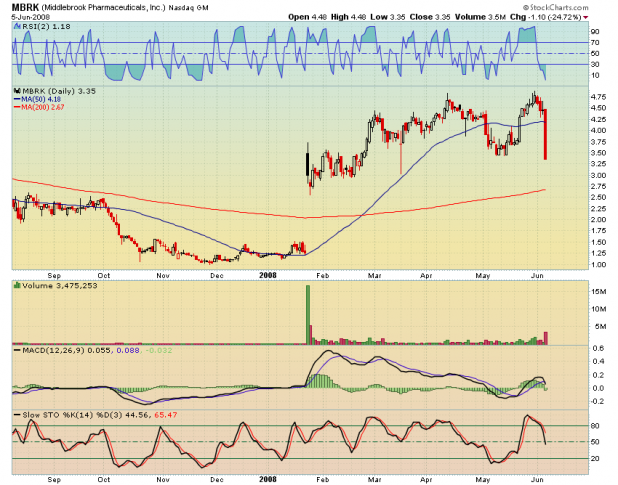
Or maybe we should call the company Middlebroke. Going into the day, [[MBRK]] was my largest position. I cannot find any explanation for the beat down it took.

I do not know if I’ll get another post up tonight. I’m going to sit here and figure out what to do with this fucker when the market opens tomorrow.

Comments »

The Daily Breakout

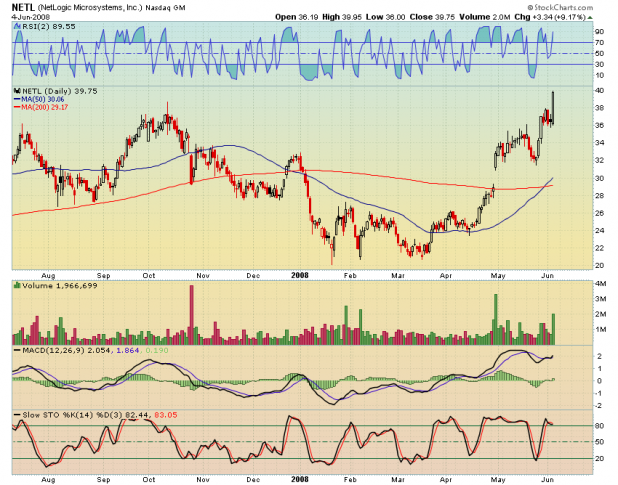
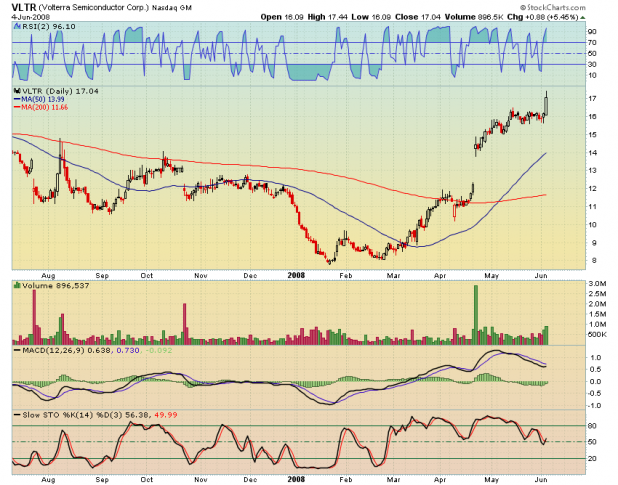
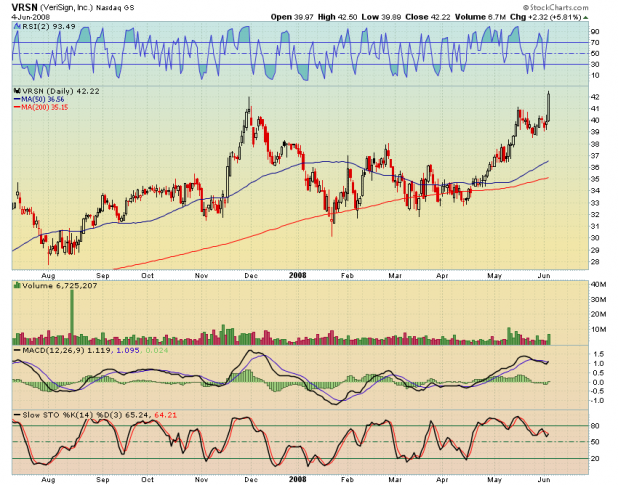
Despite more weakness in the Dow and S&P, there were still some nice breakouts today. Since money is moving into Tech, these three are technology plays.

[[NETL]] NetLogic Microsystems, Inc., a fabless semiconductor company, designs, develops, and markets processors and integrated circuits.

It seems a VP sold some shares today, so it might be possible to get this one a bit cheaper tomorrow.

[[VLTR]] Volterra Semiconductor Corporation designs, develops, and markets analog and mixed-signal power management semiconductors for the computing, storage, networking, and consumer markets.

[[VRSN]] VeriSign, Inc. provides infrastructure services that enable and protect interactions of voice, video, and data networks worldwide.

What a beautiful cup-with-handle breakout!

Comments »

Is Oil Going to Donkey Punch You?

It appears to me that Oil is setting up to donkey punch the oil bears and market bulls alike.

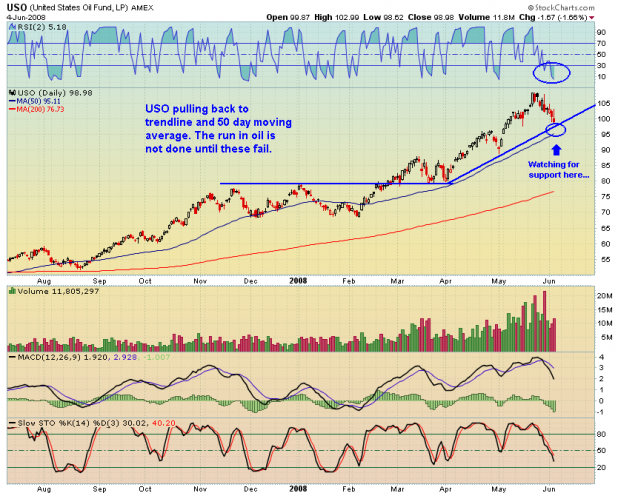
Oil, via [[USO]] looks like nothing more than a great breakout with an orderly pullback to a trendline and moving average support.

If you are short oil here, or betting on a stronger general market due to relief in oil prices, be very careful over the near term until we see if the technicals breakdown.

If you have been considering an investment in oil or its related services, this may be a good entry point to start a small position.

Comments »

The Daily Breakout

While the number of breakouts from quality bases has slowed considerably, there are still some phenomenal charts out there.

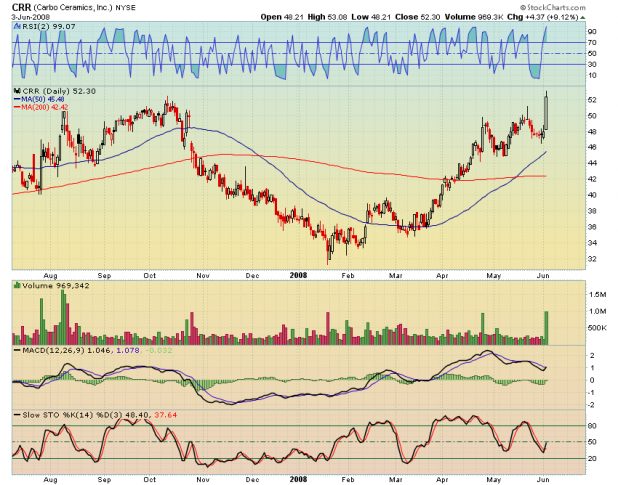
I think this is a beautiful Cup-with-Handle breakout. And, being from the oil and gas industry, I think this one may have long-term potential.

[[CRR]] CARBO Ceramics, Inc. engages in the manufacture and supply of ceramic proppants used in hydraulic fracturing of natural gas and oil wells.

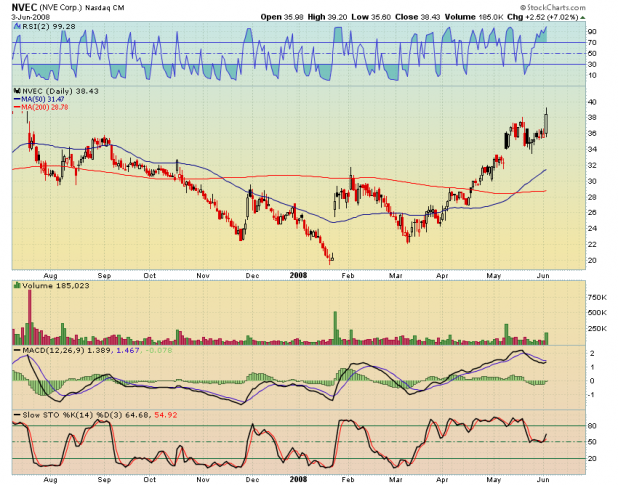
[[NVEC]] NVE Corporation engages in the development and sale of devices using spintronics, a nanotechnology, which utilizes electron spin rather than electron charge to acquire, store, and transmit information.

I don’t know what the heck spintronics is, or why it could be profitable for information storage and transmission, but I checked the fundamentals on this one and they appear to be very healthy.

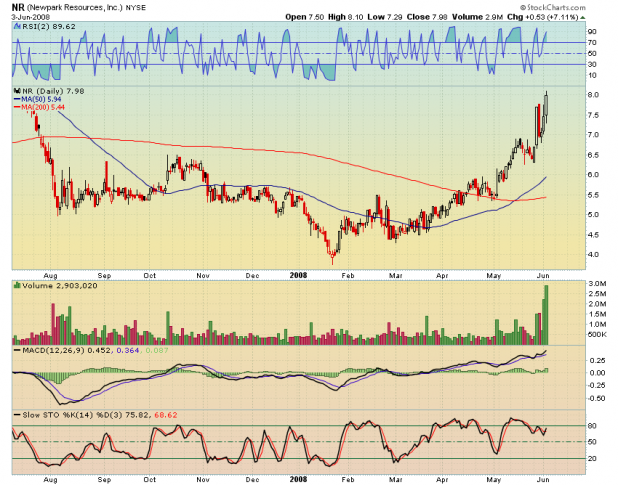
[[NR]] Newpark Resources, Inc. provides integrated fluids management and well site preparation products and services to the oil and gas exploration and production industry in the United States, Canada, Mediterranean region, Mexico, and Brazil.

Comments »

Peril Showing in the Technicals

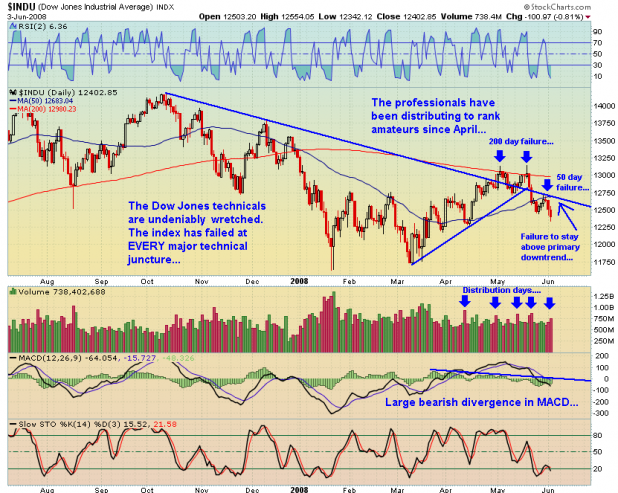
I’m finding it somewhat amusing and yet a tad aggravating that people choose to argue semantics (is it a Bear Market?) while professionals are obviously distributing stock to rank amateurs. We’ll deal with the semantics first and the distribution second.

From Investopedia: Bear Market- A market condition in which the prices of securities are falling or are expected to fall. Although figures can vary, a downturn of 15-20% or more in multiple indexes (Dow or S&P 500) is considered an entry into a bear market.

From Wikipedia: Bear market

What we can learn from the above links is that there really is no generally accepted definition of a bear market. Now that we can put those semantics behind us, I think we can all agree that the following characteristics give us clues that there is distribution.

1. Dow Jones is beneath its 50 and 200 day averages.

2. Dow Jones failed a double bottom breakout and is back within a base or trading range.

3. Dow Jones failed to stay above its primary downtrend line, which started in October, 2007.

4. All high volume days since April have been sell-offs. 

5. MACD has been negative for almost a month.

What should we learn from this, and the chart above? The basic assumption we should make is that a majority of market participants are expecting lower prices in the future than today’s prices. Forget about the pundits and a 2nd half of the year recovery. Forget about the Dow Jones components having “international exposure.” All you need to know is that many money managers, most likely smarter than me and you, are selling, and have been selling for well over a month.

Rant On

I’ve suffered through multiple displays of idiocy as many pundits have remarked about the failure of technical analysis during this period. They are complete morons. Please, if you encounter this crap, run as fast as you can away from them. The only thing that has failed is their ability to profit during a difficult market environment.

Clearly, from the chart above, technical analysis has not failed. That particular chart should be an advertisement for technical analysis. The Dow Jones has tested almost every basic technical element: moving averages, trendlines, and support/resistance. The response of the index to these technical elements has been textbook. When support has held, the index moves up. When a test fails, the index has moved down.

Rant Off

Now that we’ve established that there is distribution, that the market is still in a down trend, and that technical analysis has been a great tool for gauging market health, what is our take-away? I think it is obvious: The market will test its March lows. You might ask why I feel so certain of this. I think it is very simple: The market has been moving down for 9 months. With the exception of the Nasdaq 100 (which will roll over again too), there are absolutely no signs of the decline stopping. Therefore, the market will eventually reach its March lows.

Some may choose to wish and hope their way out of this decline They can make 100 excuses as to why the market shouldn’t be going down or why it will soon stop going down. They are disillusioned, and are ignoring the obvious peril evident in the technicals.

Comments »

WTF Is Wrong With Leveraged ETFs

I’ve read many comments expressing confusion about the fact that the ultralong and ultrashort (leveraged) ETFs do not seem to be correlating 2:1 with the underlying indexes they are supposed to be tracking. While this should not be of a real concern to traders with short time horizons, this discrepancy can be extremely detrimental for long-term holders of leveraged ETFs. I think most traders will be very surprised to see how these leveraged ETFs really work.

As best as I can determine, there are 2 major reasons why the ETFs do not track the underlying indexes 2:1

The first and primary reason is that these ETFs seek to track the daily return. For short term traders, this is acceptable. However, for longer term holders, the ETF will not double the underlying index on an annualized basis. It is calculated only on a daily basis.

Lets look at some numbers.

We’ll use the $NDX, the Nasdaq 100 index, and assign it a value of $100.00 

For the QLD, the double long ETF that tracks the $NDX, we’ll assign a price of 50.00, and we’ll assign the same price for the QID, the double inverse ETF of the $NDX.

Gain/Loss $NDX  QID QLD
  $100.00   $50.00   $50.00
5.00% $105.00   $45.00   $55.00
-13.00% $91.35   $56.70   $40.70
7.00% $97.74   $48.76   $46.40
-2.00% $95.79   $50.71   $44.54
10.00% $105.37   $40.57   $53.45
-9.00% $95.89   $47.87   $43.83
-7.00% $89.17   $54.57   $37.69
11.00% $98.98   $42.57   $45.99
2.00% $100.96   $40.87   $47.83
-5.00% $95.91   $44.95   $43.04
       
Ratio after 10 days      2.13    2.23
Total Loss 4.10% 10.1% 14%

In the chart above, we have the beginning amounts, and then 10 days of index results. Of course, I magnified the hypothetical daily moves to be much greater than would occur in real trading to show how easily the ETF gets off track with the underlying index.  In this example, the QLD has now lost double the underlying index loss, plus 6%. 

Even more interesting is that the QID has lost 10%, despite the fact that the underlying index it is supposed to be double short has lost 4.10%. A common misconception is that the QID would have gained 4%.

The real culprit here is that with percentages, once the ETF has a loss, it must increase more in percentage terms than it lost to get back to break-even.

The second source of any tracking error is also due to the returns being tallied on a daily basis. If the ETF value at the close is even a fraction of a percent off from the value of the underlying index (this seems to happen very often), that discrepancy is carried forward to the next trading day, where it becomes part of every calculation thereafter.

I hope these calculations will help put to rest the confusion concerning the 2x leveraged ETFs and the underlying indexes they track. These calculations should be of greatest concern to buy-and-hold type investors who believe erroneously that these ETFs will track 2x the underlying on an annualized basis.

Comments »