iBankCoin
Joined Nov 11, 2007
1,458 Blog Posts

ATR Position-Sizing and Stops Can Be Superior: Part 2

Link to Part 1.

Part 1 established the following:

  1. A stock’s movement is its volatility.
  2. Average True Range (ATR) is a measure of volatility.
  3. ATR can be used to position-size to account for volatility.

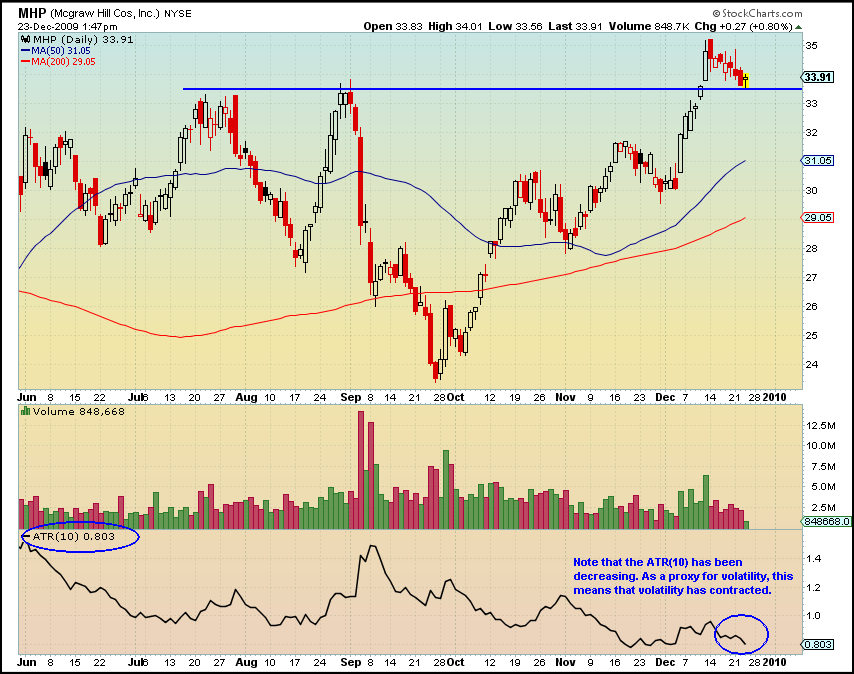
And we examined the chart below and performed some calculations…

mhp1

Using the ATR(10) indicator in the bottom pane of the chart, we divided the ATR(10) by the close and multiplied that result by 100 to get a percentage.

(.803/$33.91=0.023)*100=2.3%

It is important to for anyone wanting to explore ATR position-sizing to know how to figure out  what 1ATR equals in percentage terms. If 1ATR=2.3%, then 3ATR=6.9%. I’ll jump a couple of steps ahead and say that if a 3ATR stop is applied to MHP, it will be -6.9% beneath its close of  $33.91

We now have most of the information we need to position-size and set a stop using ATR.

Here are the 4 necessary pieces of information to position-size using ATR:

  1. ATR(10) calculation, readily available at Stockcharts. (I prefer a 10 period setting but the default setting is 14).
  2. The ATR multiple, or what number you will use to multiply by the ATR (typically between 1.5 to 5).
  3. The most recent closing price.
  4. How much $$$ to be risked. (We will use 1% of equity as our amount to be risked).

Here is the ATR Position-Size Calculation:

(R/(ATR*M))*C=position-size

Where R=risked amount.
ATR = Average True Range with a period setting.
M= Multiple applied to ATR.
C= Most recent closing price.

Assuming account equity of 100K and 1% risk, our 3ATR position-size calculation for The McGraw-Hill Companies, Inc. [[MHP]] would look like this:

($1,000/(.803*3)) =415 shares

415*$33.91 = $14072.65 position-size

The easy part is that the stop is already calculated- it is simply the ATR multiplied by the multiple (we used 3). So the stop is .803*3 = $2.409

Lets look at another example:

tpi-12_24

Above is [[TPI]] , which was the PDS pick on Wednesday evening. Yes, it is another gorgeous pullback, the kind that the PDS finds daily.

Let’s run through the calculations, using the same parameters, with a 3 multiple for the ATR.

$1000/(.322*3)=1035 shares (We would complete this calculation the night before, and put in the order for that number of shares. Remember that $1,000 is 1% of our equity and the amount we are risking.)

1035*$4.27 = $4419.45 position-size (On Thursday morning, TPI opened at $4.27).

Stop = .966 beneath the entry of $4.27

Let’s Make Sense of It All

Carefully note the following:

Both MHP and TPI used an ATR multiple of 3 to position-size, yet this yielded two completely different sized positions.

For example, the MHP position is over 3x larger than the TPI position, yet the TPI stop is 3x wider than the MHP stop.

MHP position = $14,072 with a -6.9% stop.
TPI position = 4419.45 with a -22.6% stop.

What does it all mean?

The simplest way to understand it is that TPI is more volatile than MHP. Thus, we take a smaller position in TPI and use a wider stop.

Since MHP is less volatile, we might expect it to move 2% in our favor, while we might look for the more volatile TPI to move 6%. (In fact, MHP was closed on 12/24 for a 1.45% gain.)

MHP = 14,072*2% = $281.44 profit.

TPI = 4419.45*6% = $265.17 profit.

Even though the TPI position is smaller, we know that it can earn similar profits to the larger-sized position in MHP.

It is always fun to think about profits, but it is equally important to consider losses. If we took an equal-sized position in TPI as we did in MHP, how would it feel to have TPI move 7-14% against us? It would hurt, yet we should expect that TPI could move that quickly as its average daily range has been over 7%.

Theoretically, building positions that account for volatility help ensure that each position will add the same amount of “heat” to the portfolio. In other words, if you have loaded up with 5 volatile penny stocks, volatility position-sizing will have you buying 5 small positions, leaving a significant amount of cash. Conversely, if you want to fill your portfolio with blue chip stocks (which are typically not relatively volatile), then volatility position-sizing will have you buying a few large positions, and will probably use most of your cash. To see this balance in action, you could buy 7 positions in stocks similar to MHP, using all of your 100K. If you bought 7 positions in stocks similar to TPI, you would have used only 30% of your cash.

Finally, the ATR multiple, be it 1.5, 3, or 5, determines how aggressive your allocations are. A lower ATR multiple will result in larger positions with smaller stops.

Questions and Comments?

If you have any questions or anything I have presented is unclear, please speak up in the comments section.

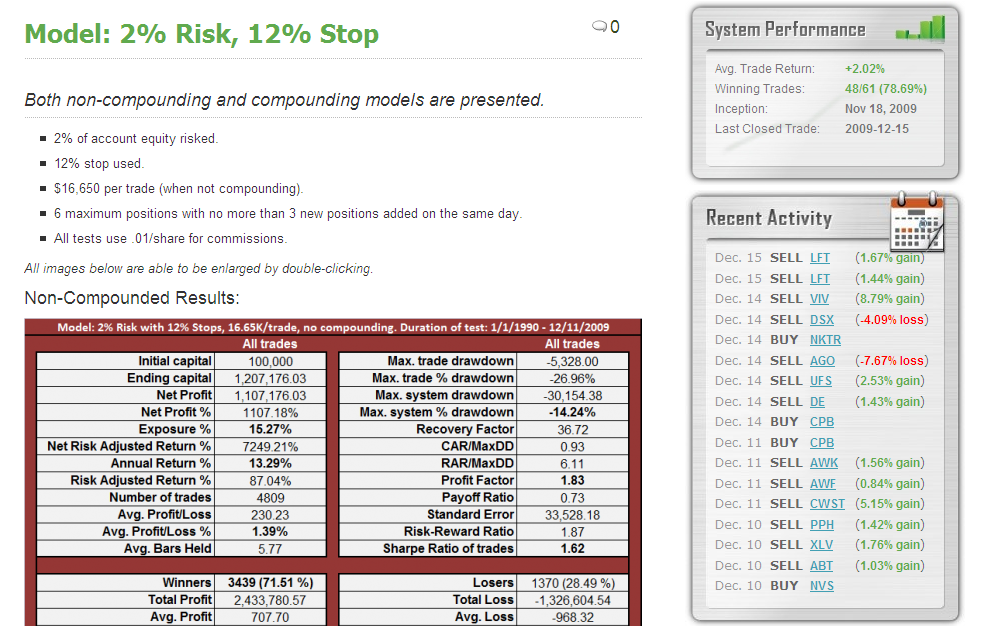
The PDS site includes a 2% risk, 3ATR model that earned 64.64% annualized, with an average trade profit of 1.65%.

Comments »

The Tacky Light Tour

Pictures complements of the Woodshedder Family, from our south Richmond Tacky Light Tour yesterday evening.

Merry Christmas Everyone!

Comments »

ATR Position-Sizing and Stops Can Be Superior

Customary position-sizing has the trader buy X number of shares and set a stop to so that he does not lose more than X dollars. One drawback of this method is that it does not account for the volatility of the security being traded. Volatility is a measurement of change in price over a given period. It is usually expressed as a percentage and computed as the annualized standard deviation of the percentage change in daily price. The more volatile a stock or market, the more money an investor can gain (or lose!) in a short time.

Consider then that our positions can be built to account for the volatility of each security we are trading. For example, if we have two stocks, both priced at $25, and ABC moves on average 1% per day and XYZ moves 3% per day, do we want to take equally sized positions in both stocks? Do we want to use the same stop level for both stocks? If the answer is not immediately clear, think about this: If we use a 1$ stop loss for both stocks, XYZ stock is much more likely to hit the stop, yet this movement may be entirely within a normal range (remember, it moves an average of 3% a day).

We can account for this volatility and position-size accordingly.

The easiest way to do this is to use the Average True Range. ATR is popular as it is readily available in most free charting programs, such as Stockcharts. “The Average True Range (ATR) indicator measures a security’s volatility. As such, the indicator does not provide an indication of price direction or duration, simply the degree of price movement or volatility.”

There is no absolute need to understand exactly how the ATR indicator makes its calculation, as long as there is a basic understanding of what it is calculating. In simplified terms, it is calculating the average daily movement of a security. This is just what we need to position-size for volatility.

Lets take a look at a chart with a plot of ATR(10), where 10 is a user-definable setting. 14 is standard, but I prefer 10.

mhp

Above we have a chart of The McGraw-Hill Companies, Inc. [[MHP]] , which just happened to be one of today’s PDS picks. (Yes, it is a sweet pullback setup. The PDS will find these daily.) In the bottom of the chart, ATR(10) is plotted. We can see that ATR has been steadily decreasing since September. Remember that this means that volatility, or how much the stock moves on average, has been decreasing.

We can complete a quick calculation and get an idea, in percentage terms, of the average daily movement of [[MHP]]. All we need to do is divide  ATR(10) by the price.

.803/$33.91=0.023=2.3%

On average over the last 10 periods, MHP has traded in a daily range of 2.3%. Obviously, using a 2% stop would be foolhardy with this stock.

I’ll quit here to allow digestion of the principles of building positions around volatility using the ATR indicator.

The next post will detail exactly how to use ATR to calculate your stops and build positions that are sized according to the volatility of the stock.

Access to ATR position-sizing and stop models are included in both the trial and full PDS memberships.

Comments »

Commissions Will Have a Large Effect on Performance

Here is a recent post I poached from the Power Dip System blog. It obviously applies to the Power Dip, but the implications can be extrapolated to any trader, either discretionary or mechanical, with a smaller account.

It could be considered in conjunction with this previous post I wrote about commissions: Commission Structures and Small Accounts.

—————————————————————————-

Lets take two hypothetical traders- both with 25K accounts.

Trader A uses a brokerage offering a per-share commission structure of .01/share.

Trader B uses a brokerage offering a per-trade commission structure of 7.00/trade.

We will assume both started trading the Power Dip System on 1/1/2009 and closed all their open trades today. They will have used the baseline model of 1% risk and 10% stop.

Commission study 25K

Note the differences in the key metrics such as annual return and average trade.

Fixed commissions have shaved over 30% off the average trade.

Commissions are a cost of business. Just like any business costs, if they are too high, they will put you out of business. Trading is a business, and as such, the cost of commissions should not be ignored.

In this study, per-share commissions are superior. However, if these same accounts were to compound over the next decade, eventually per-trade commissions will out-perform per-share commissions as the system starts purchasing very large (many shares) positions.

Comments »

I’m Open for Ideas

Now that the Power Dip has launched, I’m anxious to begin working on something new.

Personally, I’m interested in developing a system with a longer time horizon, for example, a system that will hold a trade for a month to 3 months. I think that a rotational system using ETFs might work well. The question is, what is the entry criteria? Relative strength? Rate-of-Change? Breakout?

I’m also interested in continuing work on an existing short-only system, but its time horizon is very short. However, having a good short system that works in all markets would be invaluable.

And then there is always the trend-following system, which was actually the type of system that got me interested in system trading in the first place.

Anyway, I’m open to ideas, in regards to systems to test out. I can’t promise that I will want to test the idea, or that I will be able to code it, but if you have an idea that you are interested in and don’t mind seeing it get fleshed out in public, leave a comment.

Comments »

The Power Dip System is Open for Subscription!

I am proud to announce that the Power Dip System is officially open for subscription.

I encourage you to visit the site, kick the proverbial tires, and evaluate whether or not having access to stock picks with a verifiable edge will be of any benefit to your trading. You will find the service to be simple and completely transparent, yet very valuable.

I continue to trade this system every day, and currently have 10 open positions, generated entirely by the system. That is how much I believe in it.

There are 5 picks for tomorrow’s open. Try the free trial, and you will have access to these picks. Truly, you have nothing to lose.

Best regards,

Woodshedder

Comments »

Models Available for the Power Dip System

I know, its been crickets over here recently. I’ve been working feverishly, behind the scenes, developing and uploading the models to use with the Power Dip System.

What is a model, you might ask? Well, the Power Dip stock picks can be traded any way that one likes best, but I prefer to trade them in a more scientific fashion. This allows me (and you) to get an objective measure of system performance. If every trade you take gets a different position-size and a different stop, it is harder to measure the true performance of the system. Thus, I prefer to think about models, with a model being a specific plan for trading the Power Dip System stock picks.

The baseline model is a simple 1% risk and 10% stop. However, I am providing many different models, both compounding and non-compounding,  including 2% risk models, and models that use volatility-based (ATR) position-sizing and stops. Each model has its pros and cons, and these benefits and drawbacks will have to be carefully considered by each individual user.

Ultimately, I know of no other service that is going to provide you the edge this will, AND provide a dozen or more ways to trade the edge. After all, the easiest part of this endeavor is providing the stock picks. The hardest part will be providing  a methodology for trading the picks that will allow a large number of people to be successful. A “one size fits all” approach will not work. I am confident that each person will be able to find a model that will fit his or her personality, psychology, risk-tolerance, and goals.

Beyond the models, the Power Dip System will continue to evolve based on my needs and the needs of the users. I am very excited about the evolution of this service as I do not believe there is any other service out there providing this level of detail or access to the thought processes of a system trader as he manages the system day after day, month after month.

We will be making these models available as part of the free trial.

Below is a recent screen shot of the PDS site.

system-performance

Comments »