Customary position-sizing has the trader buy X number of shares and set a stop to so that he does not lose more than X dollars. One drawback of this method is that it does not account for the volatility of the security being traded. Volatility is a measurement of change in price over a given period. It is usually expressed as a percentage and computed as the annualized standard deviation of the percentage change in daily price. The more volatile a stock or market, the more money an investor can gain (or lose!) in a short time.
Consider then that our positions can be built to account for the volatility of each security we are trading. For example, if we have two stocks, both priced at $25, and ABC moves on average 1% per day and XYZ moves 3% per day, do we want to take equally sized positions in both stocks? Do we want to use the same stop level for both stocks? If the answer is not immediately clear, think about this: If we use a 1$ stop loss for both stocks, XYZ stock is much more likely to hit the stop, yet this movement may be entirely within a normal range (remember, it moves an average of 3% a day).
We can account for this volatility and position-size accordingly.
The easiest way to do this is to use the Average True Range. ATR is popular as it is readily available in most free charting programs, such as Stockcharts. “The Average True Range (ATR) indicator measures a security’s volatility. As such, the indicator does not provide an indication of price direction or duration, simply the degree of price movement or volatility.”
There is no absolute need to understand exactly how the ATR indicator makes its calculation, as long as there is a basic understanding of what it is calculating. In simplified terms, it is calculating the average daily movement of a security. This is just what we need to position-size for volatility.
Lets take a look at a chart with a plot of ATR(10), where 10 is a user-definable setting. 14 is standard, but I prefer 10.
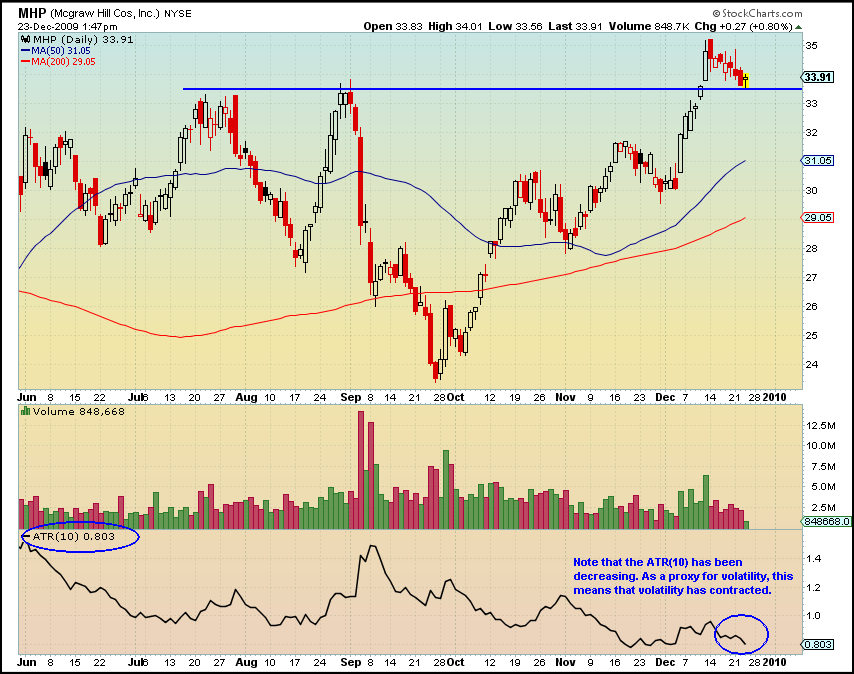
Above we have a chart of The McGraw-Hill Companies, Inc. [[MHP]] , which just happened to be one of today’s PDS picks. (Yes, it is a sweet pullback setup. The PDS will find these daily.) In the bottom of the chart, ATR(10) is plotted. We can see that ATR has been steadily decreasing since September. Remember that this means that volatility, or how much the stock moves on average, has been decreasing.
We can complete a quick calculation and get an idea, in percentage terms, of the average daily movement of [[MHP]]. All we need to do is divide ATR(10) by the price.
.803/$33.91=0.023=2.3%
On average over the last 10 periods, MHP has traded in a daily range of 2.3%. Obviously, using a 2% stop would be foolhardy with this stock.
I’ll quit here to allow digestion of the principles of building positions around volatility using the ATR indicator.
The next post will detail exactly how to use ATR to calculate your stops and build positions that are sized according to the volatility of the stock.
Access to ATR position-sizing and stop models are included in both the trial and full PDS memberships.


Thanks Wood,
Exactly what I needed to understand.
Looking forward to the next post!
Great article, Woodshedder
Very well written and easy to get to the big picture. Has applications to both positions in selected equities as well as scanning for new candidates.
I don’t suppose there’s an easy tool for looking at in-session volatility vs gap volatility. I’m going to take a stab at it sometime in amibroker, but why reinvent the wheel…
Captain, I’m not aware of such an easy tool, but I would love to see what you come up with in AmiBroker. I’m guessing by gap volatility you mean the ROC of the gaps vs. the ROC of the in-session moves?
Really great explanation – looking forward to the next post!
Looking at that chart made me wonder something: I know it would be pretty hard to backtest since it’s a visual thing, but how do you think the system would do using stops based on support levels? That is, putting the stop just below that blue line? It seems like that could allow for tighter stops, and once it moves below the blue line I imagine the chances for the bounce you were hoping for decrease.
Michael, it would be hard to backtest. We would have to operationalize what support is.
However, you could over the course of 1 year test it in real-time if your record keeping is tight.
I used to think in those same terms as you are now. Basically, I just got tired of looking at charts and making somewhat subjective/arbitrary decisions. I think that most times stocks do what is counter-intuitive.
Wood,
I anticipated you post today by calculating the average daily range percentage as you explained in the first post.
Then to make sure my position sizing was equal across a variety of stocks, I took the reciprocal of the average daily range percentages and multiplied it by each stock.
Then I added them together and made that sum equal the total port.
For example, say stock A, B, C, and D make up a one hundred thousand dollar portfolio where the following fractions are reciprocals of the average daily range percentages:
1/1.2 A + 1/1.17B + 1/1.5C + 1/1/26 D = $100,000.00.
In this way the risk on each stock is the same.
This seems right to me. What do you think