iBankCoin
Joined Nov 11, 2007
1,458 Blog Posts

Fidelity Select Sector Rotation Strategy: Part 2

Read Part 1…

One of the benefits of blogging is that it offers opportunities to discuss ideas with some talented folks. After seeing I had linked to his site, John from Fundztrader left a very detailed comment concerning the FSF Rotation Strategy. His links provide ideas on how to improve a FSF rotation strategy. These ideas will be incorporated once we get to the real fun of improving the basic system.

I was able to download FSF data from yahoo for every fund except for FSPFX, the paper & forest products fund. I ran the test with the actual FSF data, and results improved over the test with the ETFs. I did not backtest with the adjusted closes, so the results do not include dividend adjustments. I’m going to go ahead and post the results anyway as I think it might be very instructive to see a comparison of the strategy run without vs. with adjustments for dividends.

Edit: The testing in this article was using the adjusted closes after all, so the results do include dividend adjustments.

What most improved the results was changing the code so that the rotation occurs exactly as required by the rules. The strategy now has the fund held for at least 30 calendar days, (rather than rotating on the 2nd day of each new month) and then begins the calculation to see if a rotation should occur.

The Results

fidelity-select-sector-rotation-v10-stats

fidelity-select-sector-rotation-v10-equity-curve

fidelity-select-sector-rotation-v10-profit-table

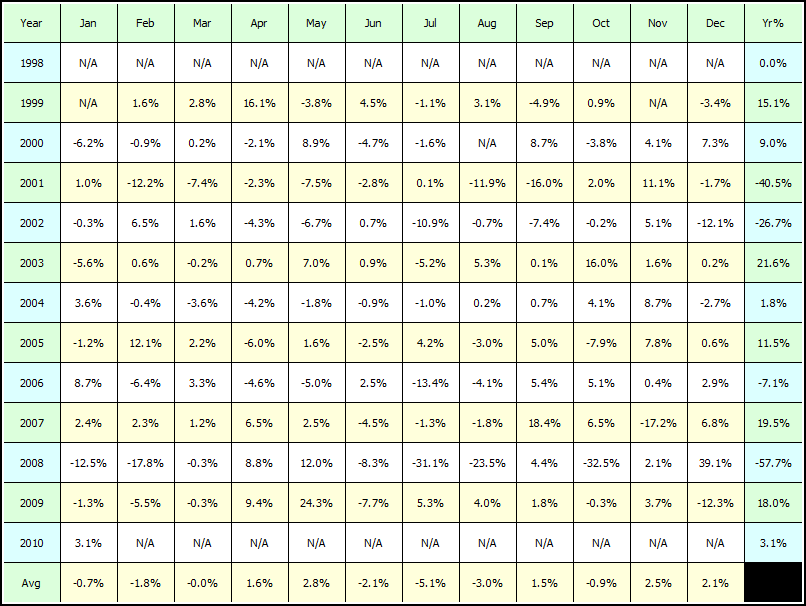
The System Shows Promise…

We now have a system with a positive CAGR of 11.65%. Over the same period the S&P500 has a CAGR of 7.57%. Also, note the performance in 2009…

As John noted in his comments, the equity curve shows how volatile the system is. It is also evident that the system gets hurt during bear markets. It should be fairly simple to improve these shortcomings, and an attempt will be presented in Part 3.

If you would like an Excel sheet with all the trades, email me: Woodshedder73 over at gmail with the subject line of Rotation Strategy Trades.

Comments »

Rotational System: Fidelity Select Sector Rotation Strategy

This is the first in a series of tests on rotational systems. Read Part 2.

As described in the jumping-off post, this is a test of the strategy presented in this article: Sector Rotation Strategy: Simple Rotation Trades Just One Fund a Month.

The bottom line is that my results show that the strategy above loses money. I could not get even close to replicating the results. However, my test suffers from some severe limitations (I’m using ETFs instead of the Fidelity Select Funds) which do not allow for exact replication. I’ll address the limitations in a bit.

Here is a good link listing the Fidelity Select Funds (FSFs) with descriptions and their benchmarks: Fidelity Select Fund List.

The Rules:

1) Track the 25 day (or 5 week) price change in all of the Fidelity Select Mutual Funds.

2) Invest in the Fidelity Select Fund with the highest percentage gain over that 5 weeks.

3) Hold that Select fund for at least 30 calendar days, to avoid the Fidelity early redemption fees.

4) After 30 days, if that Select Fund is still the top Select fund, continue to hold it. Otherwise, exchange it immediately for the currently top ranked Select fund.

5) Hold the new Select Fund for 30 calendar days.

The Results:

Click on the graphs to enlarge…

fidelity-select-sector-rotation-stats

fidelity-select-sector-rotation-equity-curve

fidelity-select-sector-rotation-profit-table

Limitations:

1. I’m backtesting over a list of ETFs which was generously constructed by a reader. View the list here: ETF Equivalents for Fidelity Select Funds. Not only is the list not entirely complete, but not every FSF has an ETF that is highly correlated.

2. Some of the FSFs have been around for almost two decades longer than the ETFs.

3. I set the backtest up quickly, and it is not rotating on exactly the open of the 31st calendar day. Instead, it is rotating on the open of the 2nd trading day of every new month.

4. Other limitations which I haven’t yet discovered.

What’s Next for This System?

I would really like to complete a more accurate test. A quick look at Yahoo data shows that they offer a data history of the FSFs. I should be able to load these up into the ‘ol wayback machine and test over actual FSF data.

Once I get better data, we can attempt some improvements. I’ve already discovered one improvement, although it might not work on the actual FSFs.

I would also like to check and see if I can find more correlated ETFs. I’m sure thankful for Thomas compiling the list, but I should probably double check for better equivalents, just to be sure.

If you would like an Excel sheet with all the trades, email me: Woodshedder73 over at gmail with the subject line of Rotation Strategy Trades.

Comments »

Remember Those 77 Power Dips?

Of the original 77 picks for 1/4/2010:

20 are still open (26%).

56 were closed with gains (72.7%).

1 was closed for a loss of -0.19%.

pd-pitch-graphic

Try the free trial here. No billing information is necessary.

Comments »

Rotational Systems on the Cutting Board

In this previous post, Dave in Philly recommended an interesting rotational system which would use Fidelity funds.

This system interests me in two ways. The first reason is that I am going to delve into some rotational systems in an attempt to find a system with a longer time horizon and lower trading fees, and this system seems to be a good place to start. The second reason that it interests me is that my wife has a 401K with Fidelity, and if the system turns out to be promising, perhaps I will trade it in her account.

Here is the article that describes the rotational system: Sector Rotation Strategy.

I will have to explore the Fidelity Sector funds and then find ETFs that correspond with them, in order to test the idea. The first order of business will be working on reducing the drawdowns that the author states are “at least as deep as the overall market.”

It should be a good jumping-off point.

For anyone who is interested, here is a link to a couple of articles I wrote last year when I was just beginning to code rotational strategies: 5 Day Rate of Change Simple System.

Comments »

The Power Dip Nailed the Dip!

Below are the top 20 Power Dip picks which were identified after Thursday’s close to be acted on today. PDS clearly identified a dip-buying opportunity and then provided picks which moved on average more than twice as much as the market itself. The SPY gained 1.59% while the average gain of the top 20 was 4.35%.

Many subscribers will have already booked these gains, having already acted upon the sell alert email sent out at 3:30.

CRZO    +5.02%
JASO    +3.68%
BID       +4.09%
EWBC   +1.39%
TEN      +9.53%
HP         +5.27%
KWK     +6.13%
ATPG    +6.07%
CCO        +1.35%
AIR        +3.44%
FST         +4.91%
ATLS      +6.32%
BTU        +6.06%
SAH        +2.79%
SM           +5.52%
WCG       +1.06%
SWN       +5.81%
MLM      +2.53%
PRU       +3.92%
UHS       +2.13%

Remember the trial is free and requires no billing information, only an email address.

Comments »

77 Power Dips for Monday

We finally got a pullback, and it has resulted in plenty-o-dips to buy for Monday: 77 to be exact.

If you have not yet taken a trial membership of the Power Dip System, now would be a great time to do it, as you will have many setups to pick from for next week.

There is no billing info required, just an email address.

Try the Power Dip trial by clicking here…

Comments »

Which Way Will it Blow? Updated with Charts

From what I can tell, the recent contracted range and simultaneous diminishing volatility can only mean one thing: We’re going to get a large move, soon.

The charts that follow plot the SPY with my four favorite measures of volatility underneath: 30 day Historical Volatility, Bollinger Band Spread, ATR(10), and the $VIX.

spy-volatility-10-month

Above we see that all measures of volatility are making new lows, except for the Bollinger Band Spread (in purple). The question is, can volatility continue to dissipate? The answer is sure it can (and we’ll see that it has before, in the charts to follow). However, even if volatility does continue to dissipate, it will not do so without a spike. And I believe the spike is coming soon.

Typically, a spike in volatility comes with a market pullback, but we can find instances in the chart above of volatility increasing with price. Depending on your bias, you are likely to believe that this volatility spike will mark a strong breakout, or start a new downtrend. My gut says it will come with a pullback, but I continue to be positioned more long than short.

Our one directional clue from the indicators is that the Bollinger Band Spread is rising. That is because on Tuesday the SPY traded above its upper band. This will cause the bands to widen, and the spread to rise. Of course there is nothing to stop the SPY from trading back down to the lower band, but if it continues to hug the upper band, it seems that when volatility returns, it may bring higher prices.

spy-volatility-2-year

The 2 year chart above shows that with the exception of the VIX, the other 3 measures of volatility are trading at or near 2 year lows. I just don’t see how volatility can decrease much more without a spike first.

spy-volatility-4-year

The 4 year chart above shows the last year from a period of extremely low volatility: 2004-2006. From 1998 to 2003, volatility was more elevated, and I’m expecting that our market going forward will have higher volatility, similar to 1998-2003 (see chart below). I see 2004-2006 as a time of depressed and artificially low volatility (and look what it begat!) and I don’t believe that the fundamentals of the economy will allow the market to trade as it did during that period.

spy-volatility-13-year

And finally we have a 13 year chart. If we examine the last 6 months of volatility, we see how tame it has been, relative to earlier periods.

My prediction was that the SPY would lose 10% in January. I’m expecting the coming volatility spike to bring lower prices, but I may very well be dead wrong. One thing’s for sure, if the market over the last month has lulled you to sleep, it might be time to wake up and start paying attention, again.

Comments »