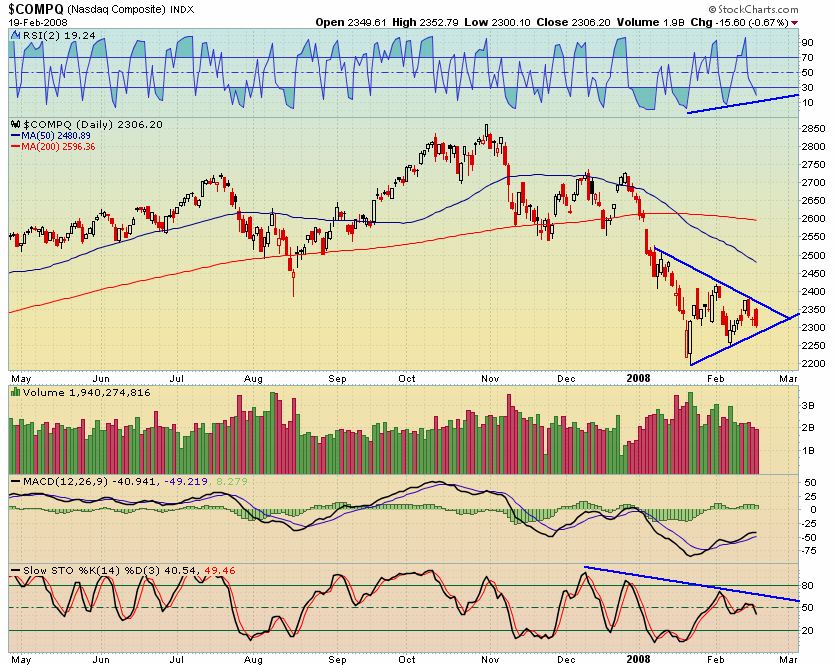
I feel more confident trading triangles because I understand the psychology that shapes their development. The triangle starts with a period of extreme volatility and ends as volatility stabilizes. The price bounces up and down, coils tightly, and then stabilizes. Its as if all the market participants finally reach an agreement on price, if only for a day. As the triangle breaks, it is usually very clear as to which side has taken control.
As these triangles form, volume decreases. Both sides are waiting to see where to place their funds. As most will place their money with the herd, following whatever direction the index breaks out to, the addition of this sidelined capital will accelerate any move.
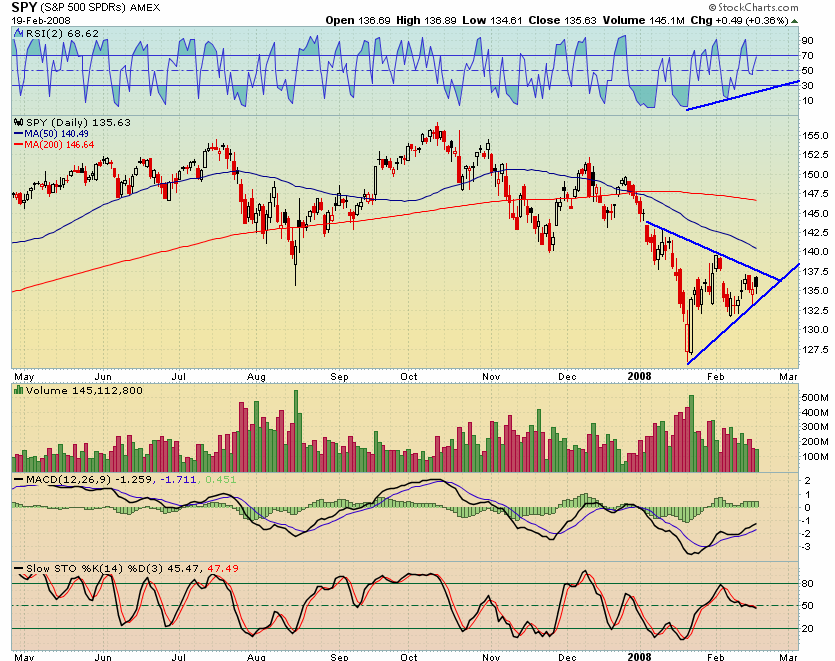
As triangle consolidations are typically continuation patterns, should these index triangles break to the downside, a re-testing of January lows seems inevitable.
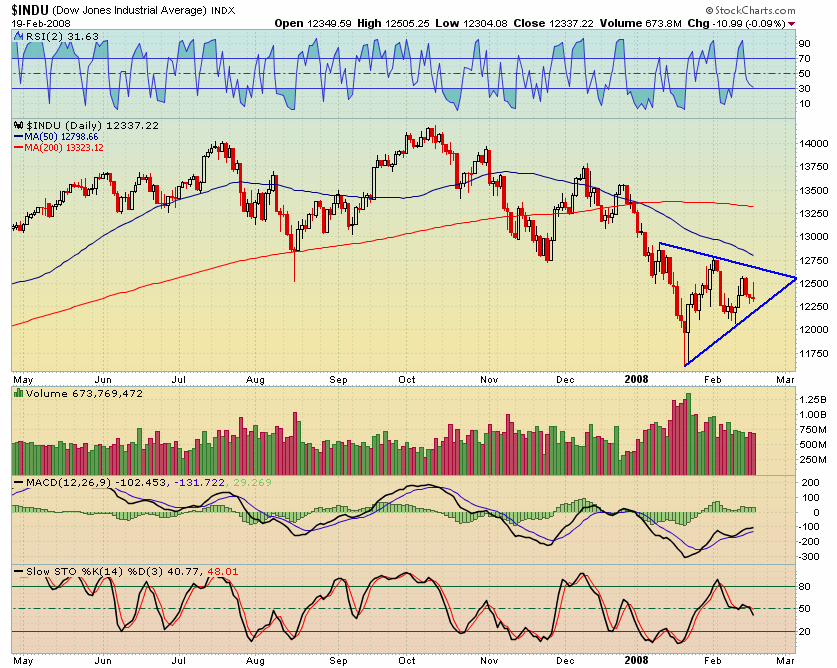
Should these triangles break to the upside, I expect the SPY and DJI to regain their 50 day averages fairly easily. Once the indexes re-gain and test their 50 day averages, I will again be a bull. As it stands, I’m market-neutral in terms of positions, but am ready to add shorts as soon as these triangles confirm.


I find triangles usually are consolidation patterns but rarely bottoms or tops. Also, chart patterns in individual stocks are more reliable than for indexes. More reliable in the case of indexes are horizontal resistance and support levels and, as a measure of momentum, a number of moving averages (60-, 90-, 180- and 300-day).
Sorry Joe, but triangles are not consolidation patterns, they are continuation patterns.
Yeah, technically the price is consolidating in the triangle, but that’s not what they’re used for.
read
According to Investopedia: “A symmetrical triangle is generally regarded as a period of CONSOLIDATION before the price moves beyond one of the identified trendlines. A break below the lower trendline is used by technical traders to signal a move lower, while a break above the upper trendline signals the beginning of a move upward.”[my emphasis]
Also from Investopedia: “An ascending triangle is generally considered to be a CONTINUATION pattern, meaning that it is usually found amid a period of consolidation within an uptrend.”
A triangle can be either a continuation or a consolidation. You only know which to call it after it’s broken out.
Joe and Danny
Consolidation , continuation, whatever.
Technical analysis is for donkeys, See you.
So technically, the grass is green, but we all differ on the shade.
The Mexican, you seem fascinated with donkeys.
Good times.