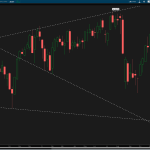
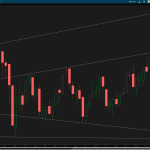
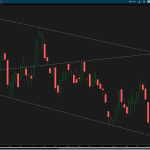
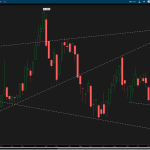
iBankCoin
Objective/Quantifiable Technical Analysis
Joined Nov 23, 2015
41 Blog Posts

Changing of the Guard on Wall Street

Over the last 5 years I have analyzed every single movement of price action in the stock market that I could get my hands on. Every minute, every hour, every day, every week. I have dissected thousands of trading days like it was a kid with lice, strand by strand picking out the eggs with a fine-tooth comb. Thousands of stocks over and over until I couldn’t see straight. Between the equities and options market, I have spent well over 10,000 hours studying price action in the last half-decade.

So, no, I do not mean I watch “Mad Money” when I have free time. I don’t sit around and watch CNBC all day to try and make sense of the global economy. I don’t use old school technical analysis with random moving averages. With the help of mentors, and my own insane work ethic, I have formulated my own strategy based off of price action. Price action is not random and is the only objective measure in the markets.

In the beginning I crunched the numbers, analyzed the data, and ultimately lost a bunch of money. At the end of the day I could not take the overall subjectivity and extreme chaos within the markets. No one could give a straight answer. Further, I was appalled at the fact that every financial pundit on the planet was not held accountable for their less than miraculous stock picking skills and “professional” advice. It was like Shaq giving advice on making free-throws.

Yes the market is this gargantuan, almost mythical, creature — moving trillions of dollars every single day. Even then, though, how can it be that so many individuals can be so wrong every day. Every. Single. Day.

If you turn on the news after the market closes, no one ever has a clue why things are happening. Markets go up because of China, go down because of Interest Rate worries, go up because it’s Tuesday and then go down because Oil was up but then went down. Wait what? In the public eye, the scene from Wolf of Wall Street is accurate. If the public thinks that the market is so overly complex, it opens the doors to those with the intellectual know-how a platform to not only sell services, but charge outrageous fees without repercussions due to lack of performance. The market, after all, cannot be beaten…right?

The fact of the matter is that we have accepted this as fact as a society. We turn on the news and are offered horrendous Options Trading products, a “Professional Stock Tip” of the day, and then they are never heard from again. The financial news outlets are no more than an infomercial peddling their own agenda. The worst part, 60-year old men in their underwear are using their retirement money to trade off these ideas.

We currently live in an era where it’s not about being profitable, it’s about getting the most clients, charging your management fee, and letting the chips fall where they may. The overall benchmark is to “beat” the market, but over the last decade that has gone by the way-side. The mantra “no one can beat the market” has been spread by Fund Managers who can’t beat the market, of course that is a self-fulfilling prophecy and of course they would believe that (and subsequently sell that pitch to their clients).

‘Wall Street’ is old money.

There I said it.

It is a bunch of old white dudes sitting around in neck-ties with advanced degrees talking over and talking down to the average investor. It’s an “Old Boys Club.” Don’t get me wrong, some of the brightest minds on the planet are working in Finance. Never in a million years would I put down the Hedge Fund industry’s talent pool. Every Hedge Fund manger out there has better test scores than me, every Asset Manager has a higher degree than I do. But you know what, it doesn’t matter on Wall Street. The markets do not care about your Wharton MBA, your CFA Certification, or the $10B in Assets Under Management that you control. At any one point in time, the market can, with one fell swoop, destroy everything you have ever created.

Hedge Funds, a necessary evil, sell the ambiance of fake security to high net-worth individuals. Total industry assets are at record highs, testing almost $3 trillion dollars. Better yet, on average, hedge funds returned only 2% in 2014 (net of fees, the average return was negative) – compared to an industry return of almost 14%. While I understand that Hedge Fund performance is often strangled by its own risk metrics (i.e. Sharpe Ratio), it comes to be stood yet again that our end goal has changed into “preservation of capital at all cost.” In 2008 Hedge Fund returns were only -25%, compared to -37% of the S&P — congratulations?

Furthermore, let’s assume we have a fund with a 2% Management Fee and a 20% Performance Fee (the standard within the business). A hedge fund would have to make 15% to achieve the same returns as someone making 10% investing their own money. That’s a 50% greater return in one year. Is the value proposition here that much higher?

Here’s the thing, with everything I have mentioned above, Hedge Funds are still the angels dressed in white. High Frequency Trading is apparently the villain in this mythical world. Ever since “Flash Boys” came out, everyone wants to start pointing that direction. After all, if we don’t understand it that has to be a problem, right? Don’t get me wrong, the High Frequency Trading world is arbitraging millions of dollars every day out of the market. However, if you think this is any different than market making in the early 2000s, you are quite naive (not to say that it is acceptable, but at a certain point, someone will always be the fastest to market). My point here, High Frequency Traders change their business model based on opportunity – so in the end, they are taking the risk. But for some reason Hedge Funds get a pass as they consistently under-perform.

It’s time to update our business model, the outdated 2/20 Fundamental Model is causing more harm than good. Below-average Analysts and Fund Managers are facing increasing pressure to perform in this environment, as it seems Hedges Funds are closing their doors almost weekly. And when compensation is highly correlated to performance, it poses giant vulnerabilities on the risk-taking front. Further, the market is so over-saturated with Hedge Funds right now, it’s beginning to be a joke. Any 22 year-old with a Finance degree and a rich uncle can start a 10M shop, it’s ridiculous. As we see an increase in the Hedge Fund pool, we are also seeing an increase in market illiquidity. Positively correlated with negative returns? You betcha.

So what does that mean for investors and traders alike?

First off, the market is not rational and those investors that try and rationalize market mechanics in the midst of the extreme volatility we are seeing, are merely the most stubborn mule in the room. While I understand that fundamentals are what drive the economics on a global scale, what’s more important is the timing of when these events effect market price. For example, in 2015 the writing had been on the wall that the global economy was slowing to a screeching halt.  However, the market did not budge, down less than 1% on the year. As we turn the calendar into 2016, the market drops 10% in the first two weeks. Risk happens fast, as they say. Hope you didn’t take vacation.

The worst part about this is that yet again, financial news streams provide zero value. CNBC airs a “Markets in Turmoil” special session on Sunday January 18 – after an 8% drop in the markets to start the year.  Yet again, thanks for providing such amazing value.

The good news: traders are sick and tired of the game being played and are taking things into their own hands. From an educational perspective many traders like myself have taken this as an opportunity to provide amazing value to potential investors. It is still few and far between, but there are a few amazing educators in this space. In addition, algorithmic traders are the hottest commodity on planet earth right now. These traders are nowhere to be found on mainstream media, except maybe mistakenly grouped together in the High Frequency Trading world. These traders (‘quants’) are developing risk-averse, delta-neutral strategies, that make money virtually in any market condition. Humans are becoming machines, and the idea of “I think the market will go up” does not even exist (as it shouldn’t). In an ever changing environment, the only way to be successful is to be adaptive. Things are happening at record speed, and the fundamental and technical metrics being used by Old Wall Street are going the way of the dodo.

Right now we are on the verge of the biggest paradigm shift in the history of the financial markets. Other than the invention of computerized trading, almost nothing has changed in this industry in the last century. We still use the same metrics and offer the same value propositions. Hedge Funds, as they stand today, will eventually diminish into virtually nothing. The adaptive strategies will take over, which in turn will create a much more level playing field for the individual investor.

So, to the individual investor, it is time to do your research and turn off the TV. The amount of educational content on the internet is unbelievable. The markets are not as crazy as you think they are, you are just fed negative headlines from news stations that are on pace to receive lower Nielsen ratings than ABC’s comedy “Selfie.”

Investment moguls like Warren Buffet and George Soros use strategies that only work for their portfolio types, and should not even remotely be considered by anyone else. Actively managed portfolio’s that use sound, risk-based, strategies will provide far greater opportunity to the individual investor than placing  your funds with an advisor who gets paid based on quantity of clients. Wall Street is the only investment vehicle on the planet where the barrier to entry is zero and your upside wealth generation is infinity. There is no get-rich-quick scheme and it is definitely not easy. However, you owe it to yourself to become educated. Demand performance. Stop painting a broad stroke over “Wall Street” when you yourself have put zero effort into a) being a part of the change or b) educating yourself. We are on the forefront of opportunity, seize it.


“Through every generation of the human race there has been a constant war, a war with fear. Those who have the courage to conquer it are made free and those who are conquered by it are made to suffer until they have the courage to defeat it, or death takes them.” Alexander The Great

Comments »

The Resurrection of TWTR

Unlike most, I am a huge Jack Dorsey fan. I think the guy is an absolute genius and is in the beginning stages of doing some awesome things at Twitter and Square.

To say that Twitter’s management and business model are/were a wreck may quite possibly the understatement of the century, though.

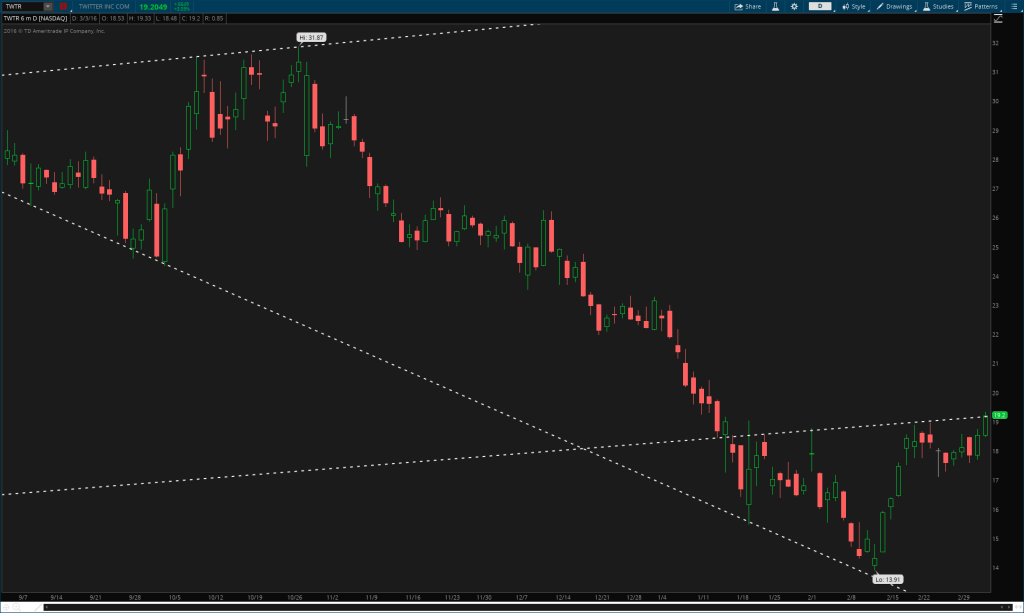
However, the charts are pointing to higher and I’m a buyer for the long term.

Unfortunately I am a little late to this, after the first bounce I was still weary. As you can see on the daily chart we are running into resistance up here. I am currently long, small, and will add on the pull backs.

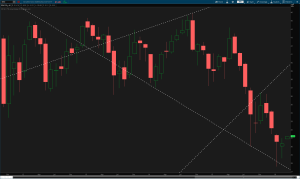
TWTR Daily Chart
TWTR Daily Chart

The monthly and weekly charts look great here if they can hold up here above 17 or so. The high-end target is the low 30s into the end of 2016:

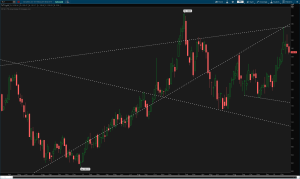
TWTR Monthly Chart

TWTR Monthly Chart

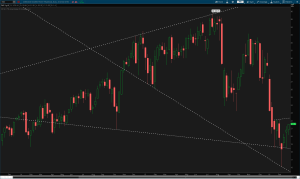
TWTR Weekly Chart
TWTR Weekly Chart

Comments »
The VRX Gamble: Zero or Hero

William Wadsworth Ackman is feeling the pain.

The money I’d pay to be a fly on the wall during his VRX conversations. I picture the Mr. Robot scene where the Evil Corp executive pays a homeless man to let him beat the shit out of him.

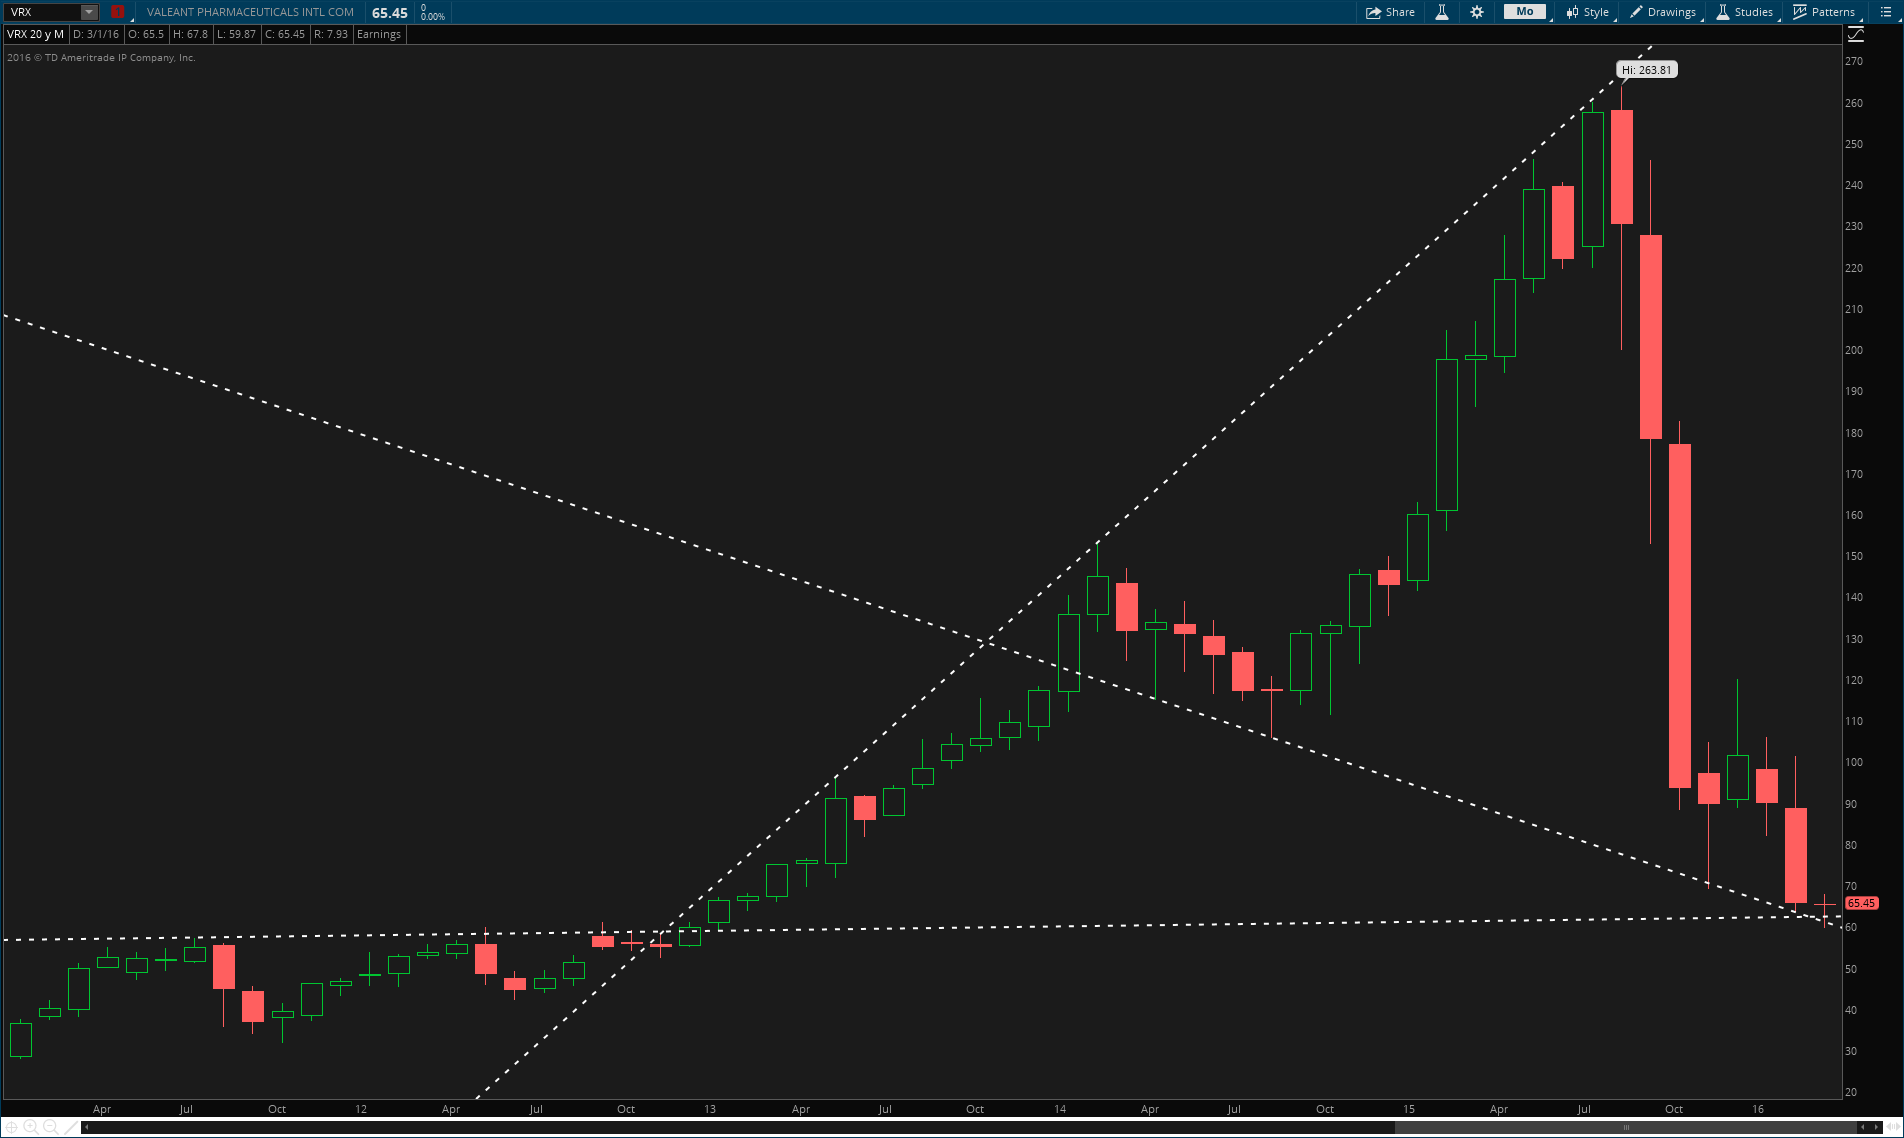
From a charts perspective, a little gamble may be worth the shot down here.

For the love of God do not buy this stock, or sell any options — if this thing is a zero I wouldn’t be surprised.

However, long-term calls may be a decent play down here.

Check out the monthly chart, as we converge into support.

Could it be, could Father Bill be resurrected?

VRX Monthly Chart
VRX Monthly Chart

Comments »

Don’t Be That Guy

Yesterday was a face-ripping rally that carried out the shorts in body-bags three times over.

If you missed it, I’m truly sorry.

As you probably know, I have been the biggest bull in the room ever since the infamous OPEC Rally of 1812.

However, going forward…DON’T BE THAT GUY.

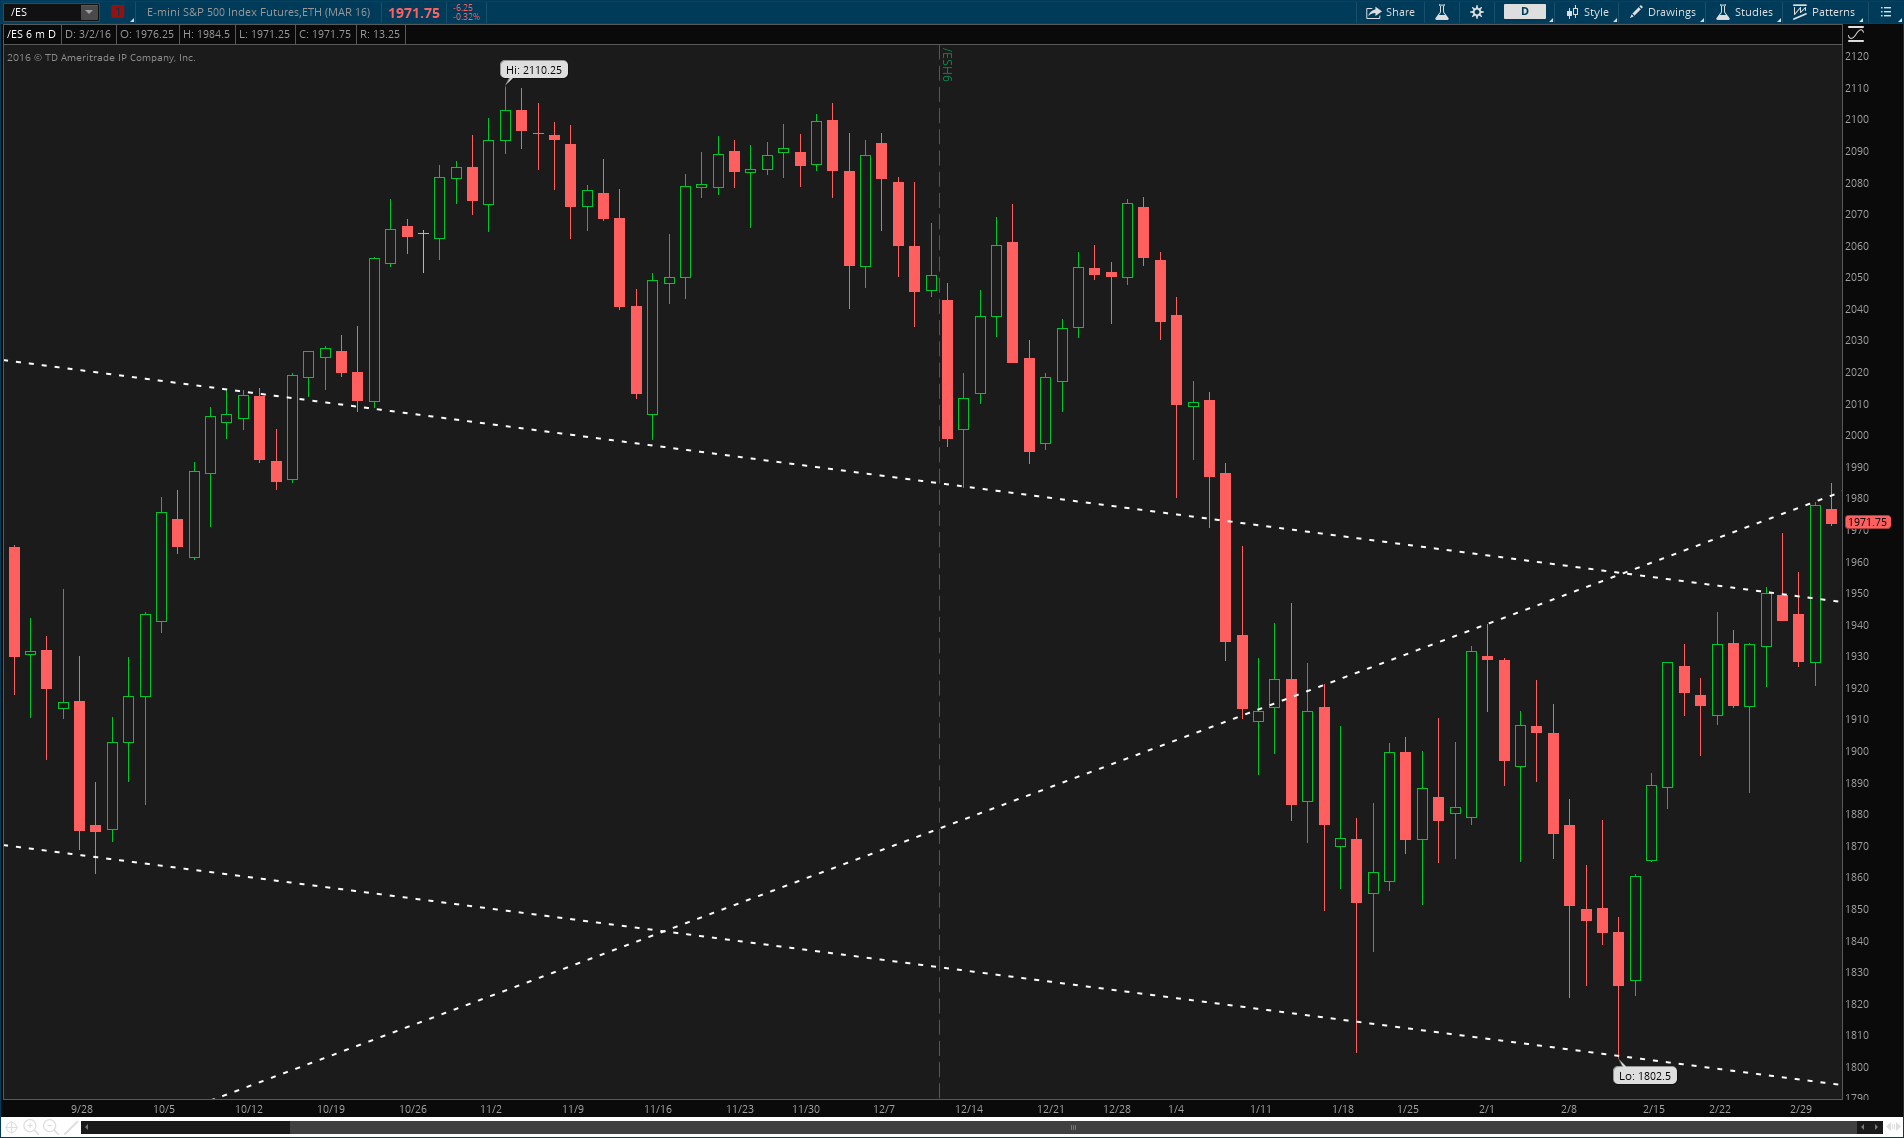
You can’t be that guy hating the rally at 1850 and now loving it at 1970, it doesn’t work like that. If you aren’t already long, you’re going to have to sit this one out and wait for the next move. Yesterday’s move was monstrous and will take a few days to set back up. Relax, the market will provide another entry either direction. Patience pays here.

ES Futures Daily Chart

Comments »
Are you long yet?

Still think I’m crazy?

Crude is holding 32-33, financials are leading the charge, and the emerging markets are catching a bid. I mean….c’mon. Doesn’t make any sense right?


We are getting a simultaneous break and confirmation of long bias across major indices into the new month. While it’s very important to hold this move, don’t be shy and get in there and press. All of the signals I posted about over the weekend are triggering, tough to hold down a market when that all happens at once.

Here’s the just of what’s happened today so far: 

1.) Financials triggered the outside-week, weekly hammer signal and are leading the charge today.

2.) Emerging markets triggered the inside month signal above 31.

3.) TLT bonds triggered short below last weeks sell-signal.

Emerging Markets Monthly Chart
FAS Weekly Chart
FAS Weekly Chart
TLT Bonds Weekly Chart


Everything is now right in the world, chaos has been restored. 

Comments »
No Chance

Stay with me on this, it’s going to come off as flippant and senseless to most of you.

There is NO CHANCE this market is going down soon.

Guys, I know everyone is losing their shit about how the US economy is garbage, the possible “Brexit,” Chinese PMI, and the ever-present Oil fiasco. I get all of that. But if you think the market owes you a bear market right this moment, you’ve got it all wrong. I agree, the outlook is anything but exciting, but the amount of people trying to rationalize the next move is absolutely insane. If you haven’t figured it out by now, this market does not move on “common sense.” The second that we held 1800, sentiment changed. Believe me, I thought we were doomed as well.

In volatile markets fundamentals are thrown out the window, as markets take time to normalize and adjust to fierce swings in supply and demand. Price action is the only way to navigate these markets.

We need to step back and look at longer-term charts and look at the damage that has been done.

Even considering our rally in late February, we still have a ton of stocks that are setting up for another relief rally.

All in all, if we do go up, we want to see all of the signals (below) trigger at the same time and push with authority. We want to see the bonds break lower with gold, financials push us higher, and then have a global push overseas. Yeah, this may be a tall order, but these charts are pointing to at least the possibility. Don’t count it out just yet .

If we take a look across the world into some of the foreign markets, the commodities, and then the US markets, it seems that the only way we go down in the short-term is if we have some disastrous event.

In the charts below we have a series of events lining up that not only show that we are not going down, but that this could potentially be the beginning of an epic bull run:

USO Oil: Monthly Hammer signal into support. USO has also now completed it’s measured move down – dropped from 40 to 20 (50% down move), then dropped from 20 to 10 (another 50% down move). Even the slightest short-covering rally in the oil patch will be a catalyst for this market.

FXI: China has been killed and has made a slight lower-low off of the October 2011 lows. At this point even a rest in the selling would be great for China.

GLD: Gold had an amazing February, but is putting in a reversal-setup on the weekly chart right into resistance. Inside week last week, countered with shooting-star sell signal could be putting the hurt on some longs below 115.

XLU: Utilities have been the safe play into 2016. But, similar to Gold, are going reversal-setup into resistance. Below 46 utilities could see some pretty quick profit-taking up here.

TLT: Bonds have also had an amazing run in 2016, a the risk-off assets poured in to start the year. However, coming into resistance we are seeing some selling pressure.

FAS: Financials are so frustrating intra-day, but the weekly chart is showing some promise with a weekly hammer into support.

EEM: The emerging markets have been a horrible investment for the last 5 years. However, they are inside month into support. A break above 31 could spark a rally most definitely.


Comments »

A Garbage Trade

It’s not often that I recommend some shit chart to my friends, but as it’s coming close to 10AM CST here in the Windy City and I’m about 1/2 a bottle of Jack in, I figured I’d share this glimmer of hope for my dumpster diving traders.

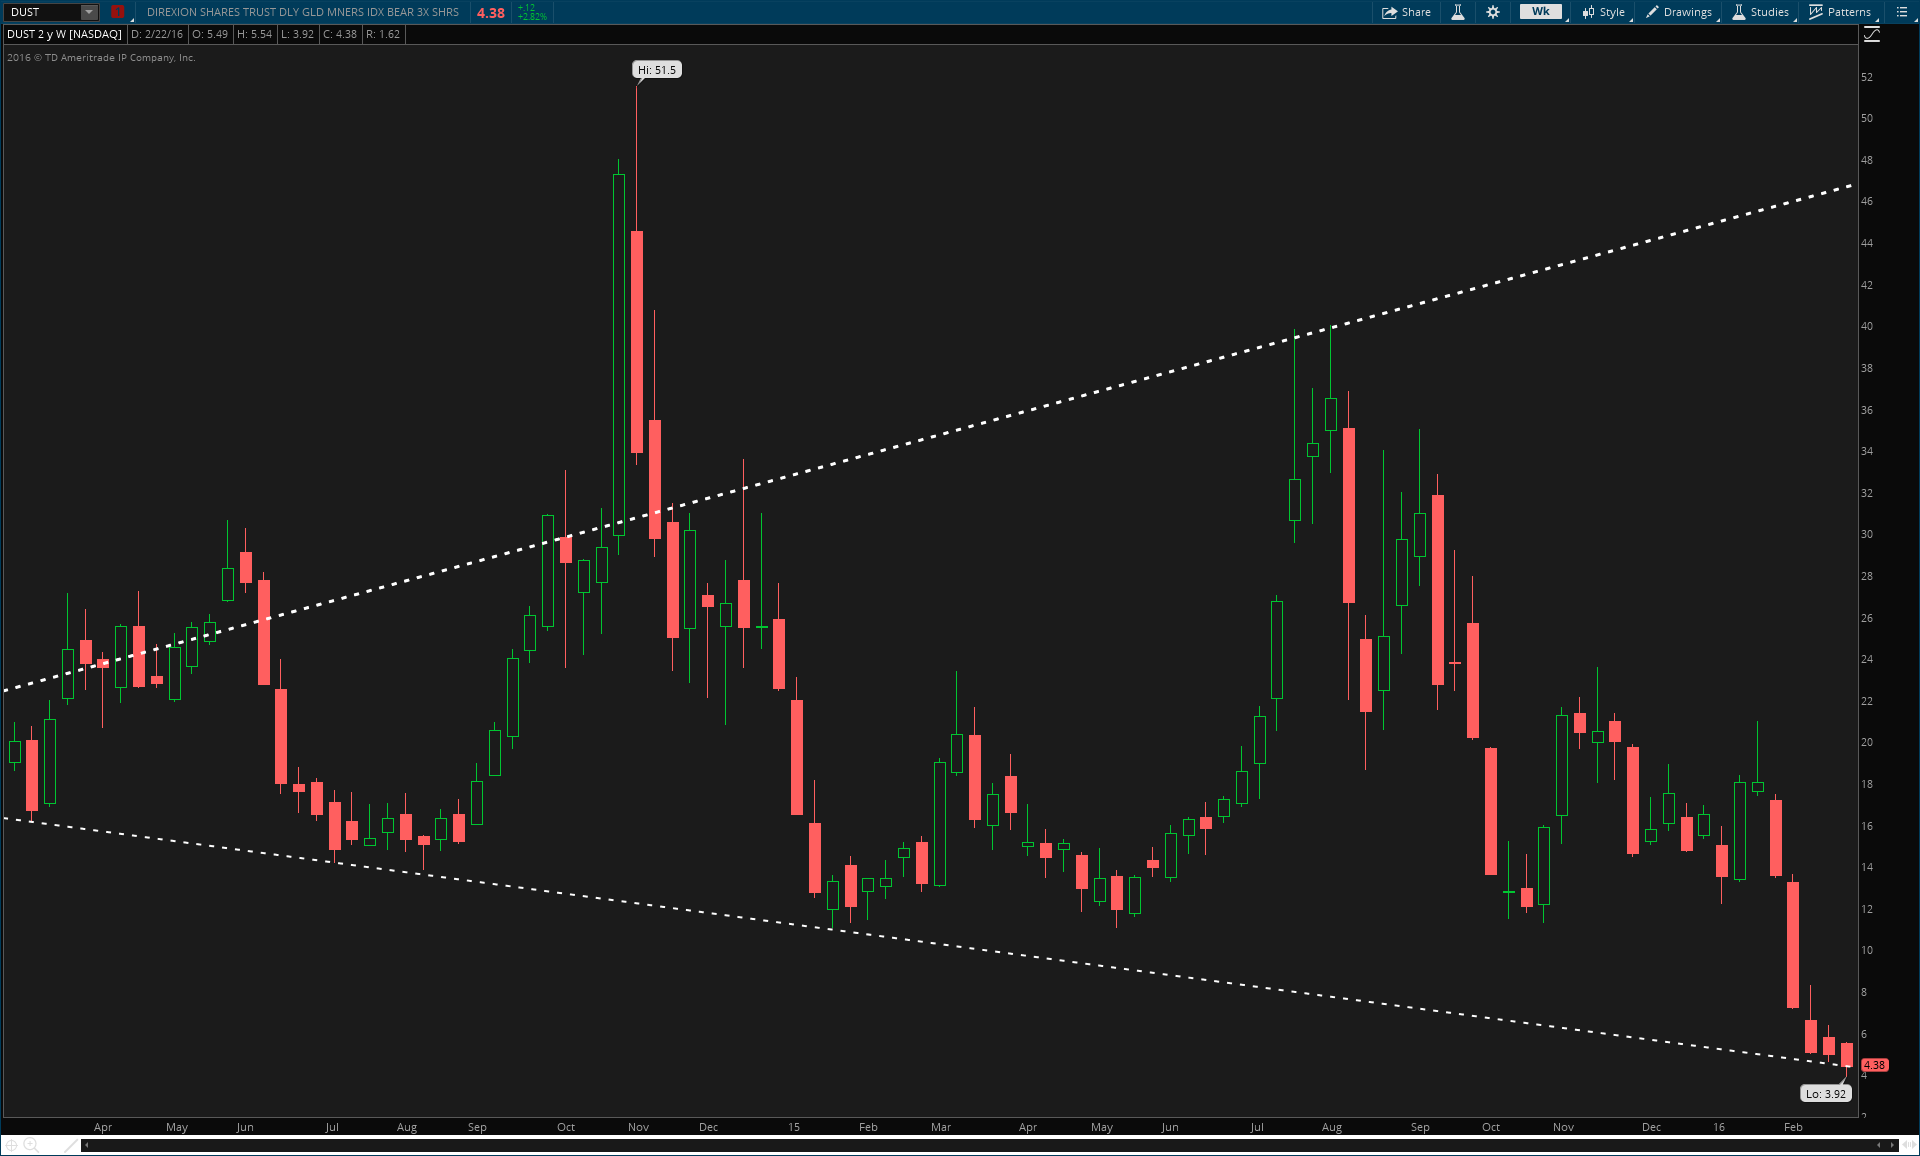
Here we have the DUST chart and as you can see we are setting up off of Broadening Formation support on the weekly chart. Personally I hate buying crap like that, but I am on “risk-on” mode right now and furiously have hated on this Gold rally. So, I bought some down here at 4.50. If we hold 4.25 or so, I think this can be a quick 50% gain in the next two weeks or so.

DUST Weekly Chart
DUST Weekly Chart


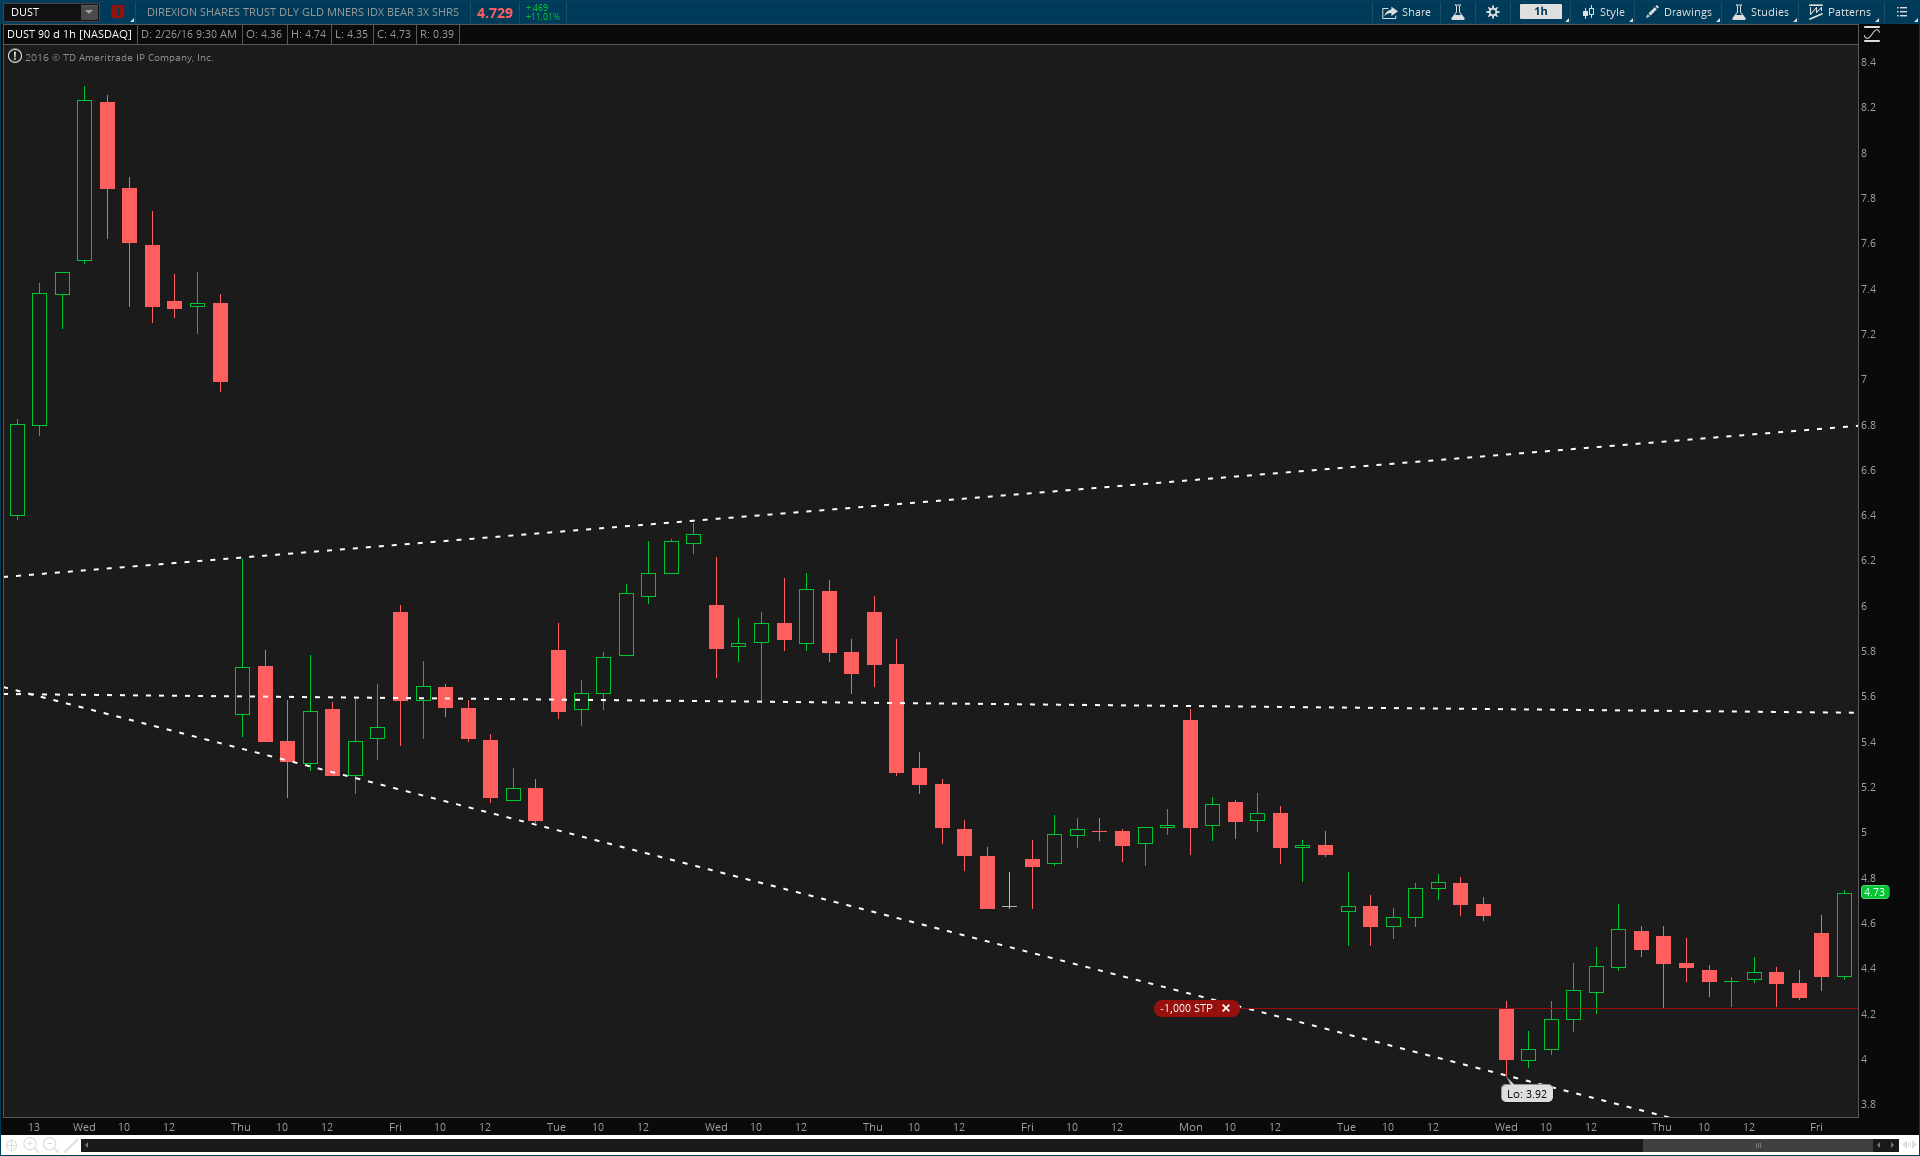
A quick update now that we’ve popped a nice .40 cents since I have saved the previous chart. Our first target for DUST is 5.50. Then, we’ll push up to $7.

DUST 60-Min Chart
DUST 60-Min Chart

Comments »
Bodybags are Needed

As we’ve suggested, this market is going to carry out the shorty’s in body bags. Until every last one suffers pain and anguish, and the pajama futures traders run it straight up their colon.

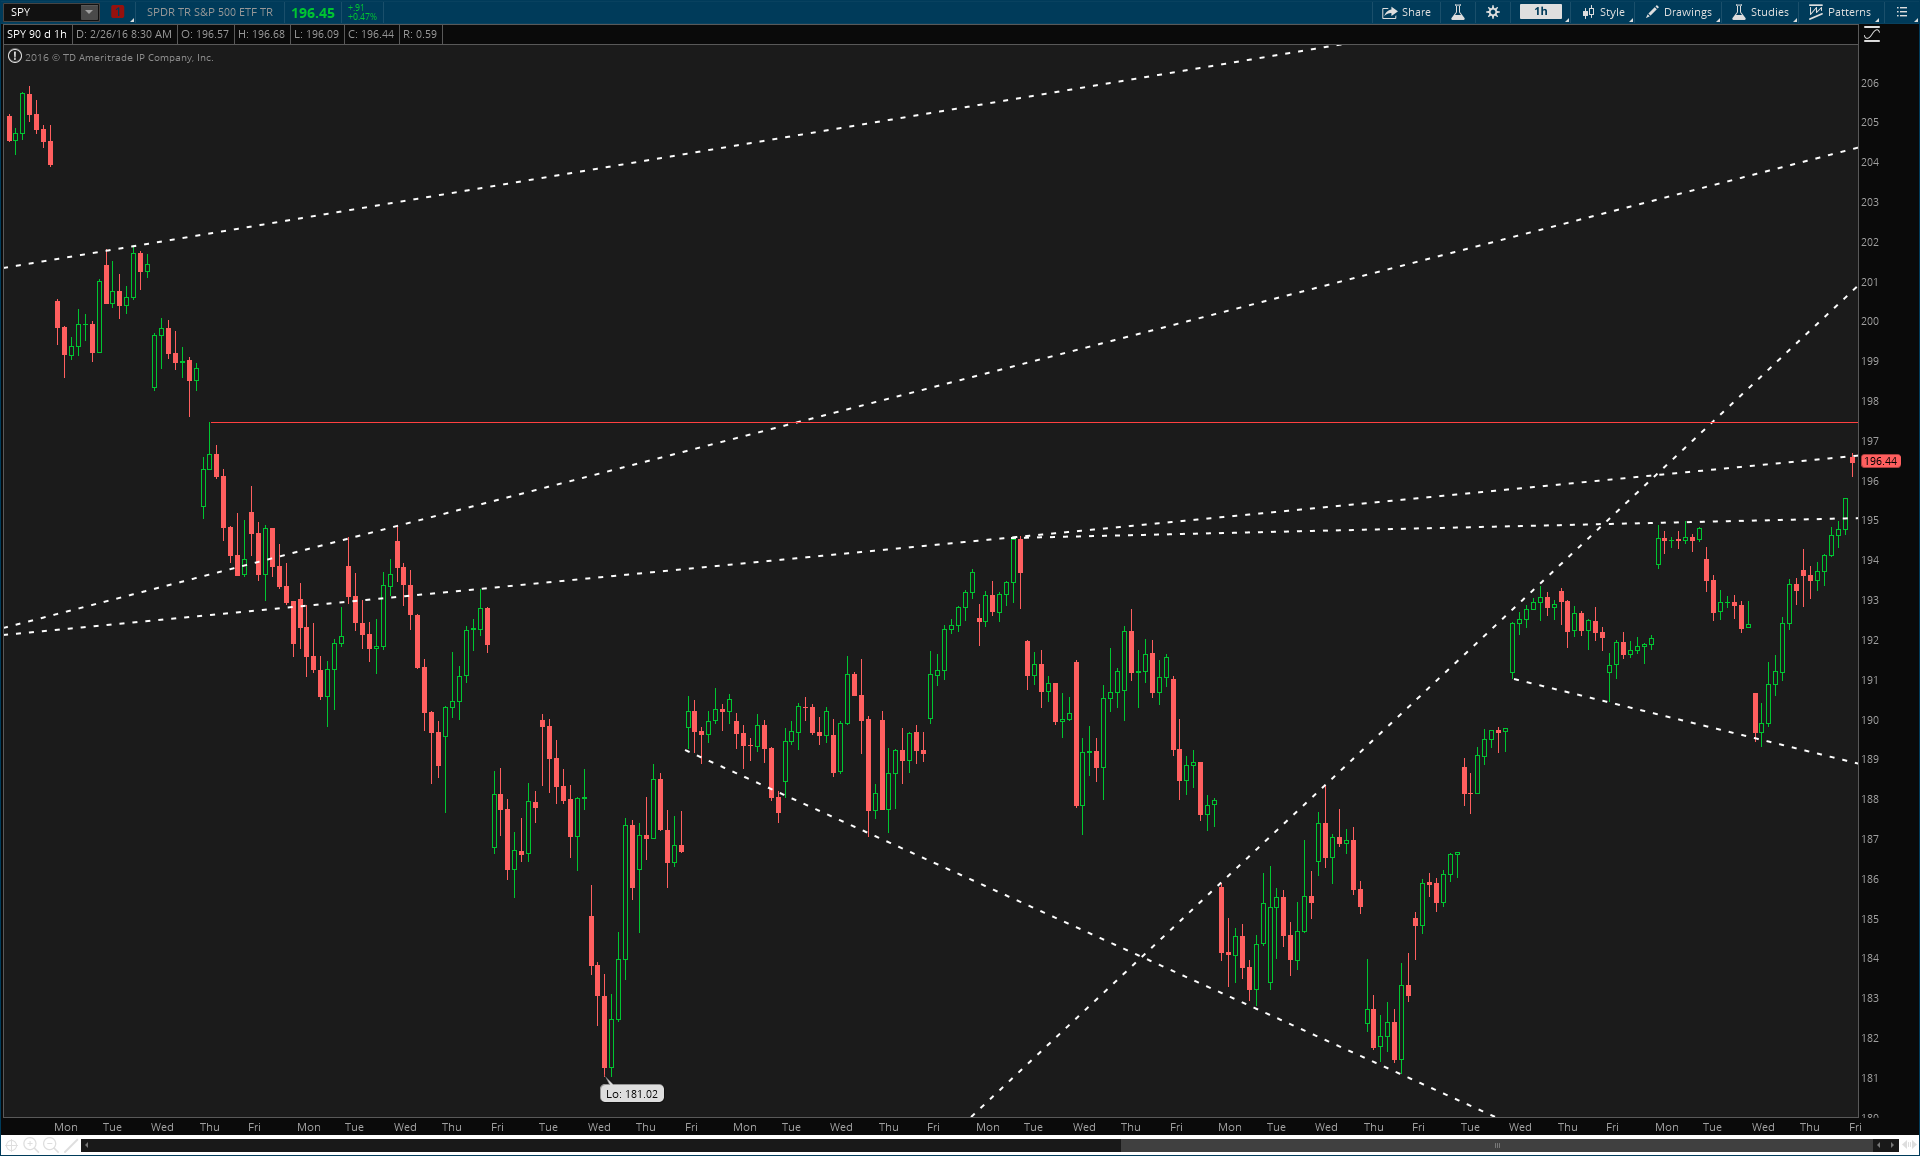
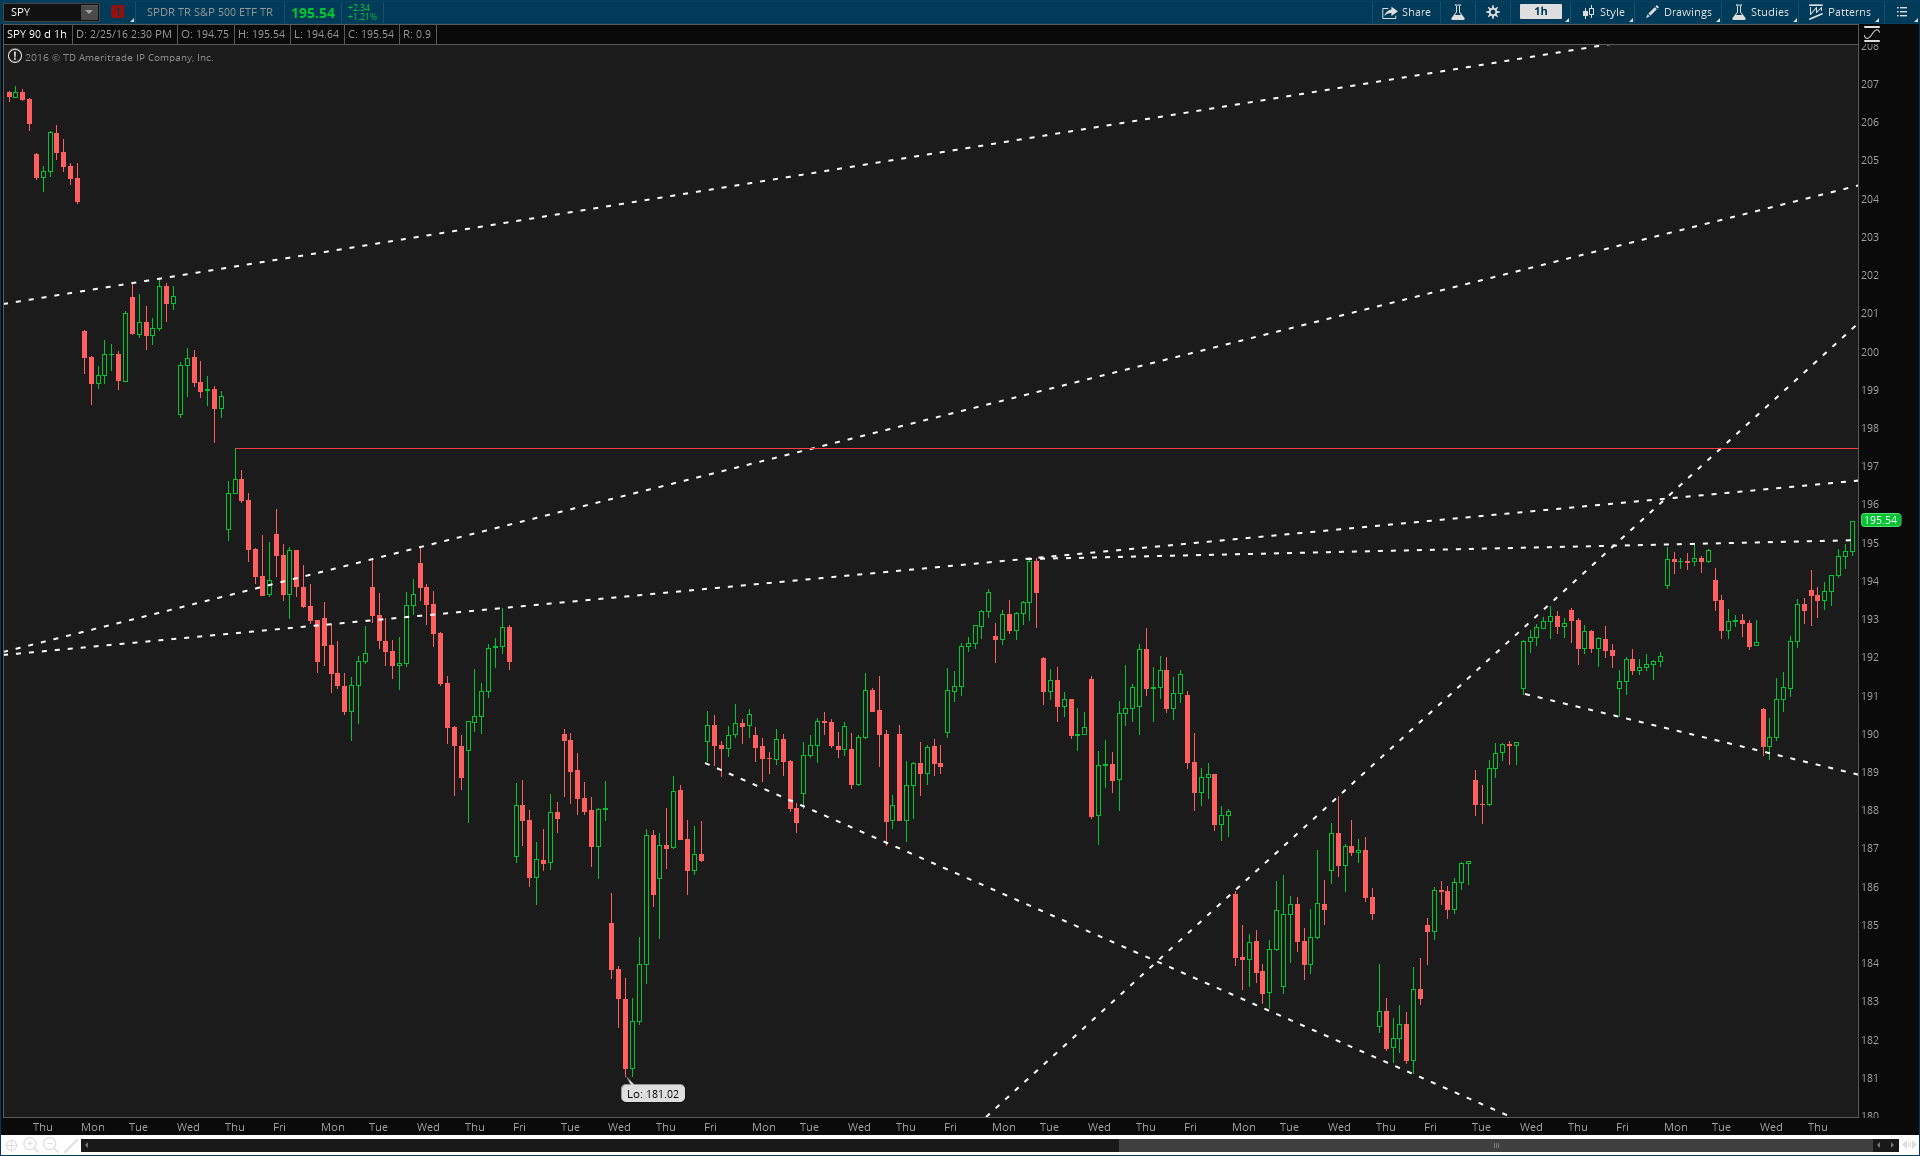
As you can see in the 60-minute chart, we are gapping up right into resistance at 196.50. I have trimmed the majority of my long exposure here, seeing as we’ve got about 6 points in 3 days on this. Heading into the weekend, I don’t want to be even thinking about the markets – as I’ll be drowning myself in Bourbon.

SPY 60-Min Chart
SPY 60-Min Chart

Going forward we are going to wait for this to re-setup. I’d love a dip back to 193-194 but I am not sure we get this. If we do go higher without a dip, do not be afraid to get back in. At this point though, as the markets slow down, it’s best to take some profit and see what the market gives us.

Comments »

Is Thou Boat Loaded?

Listen, I’ve been pounding the damn table for THREE DAYS now that you should have been buying any and all dips. Yesterday’s call was EPICLY timed, not to toot my own horn or anything.

Today we muddled around, holding yesterday’s gains nefariously so, pissing off any and all short sellers.

At 12:30 CST we see a momentum hammer on the 60-min chart, the nail in the coffin for hopeful bears.

SPY 60-Min Chart
SPY 60-Min Chart


So what does this mean going forward?

Well, for starters you can see clear resistance at 196.50-197.50 as our next top-end target.

If and when we break out of this, we are destined for 200 in the SPY, with a push to 202 most likely. As far as the timing goes, it is still hard to tell, but price is not letting up. We could see this in two weeks at this rate.

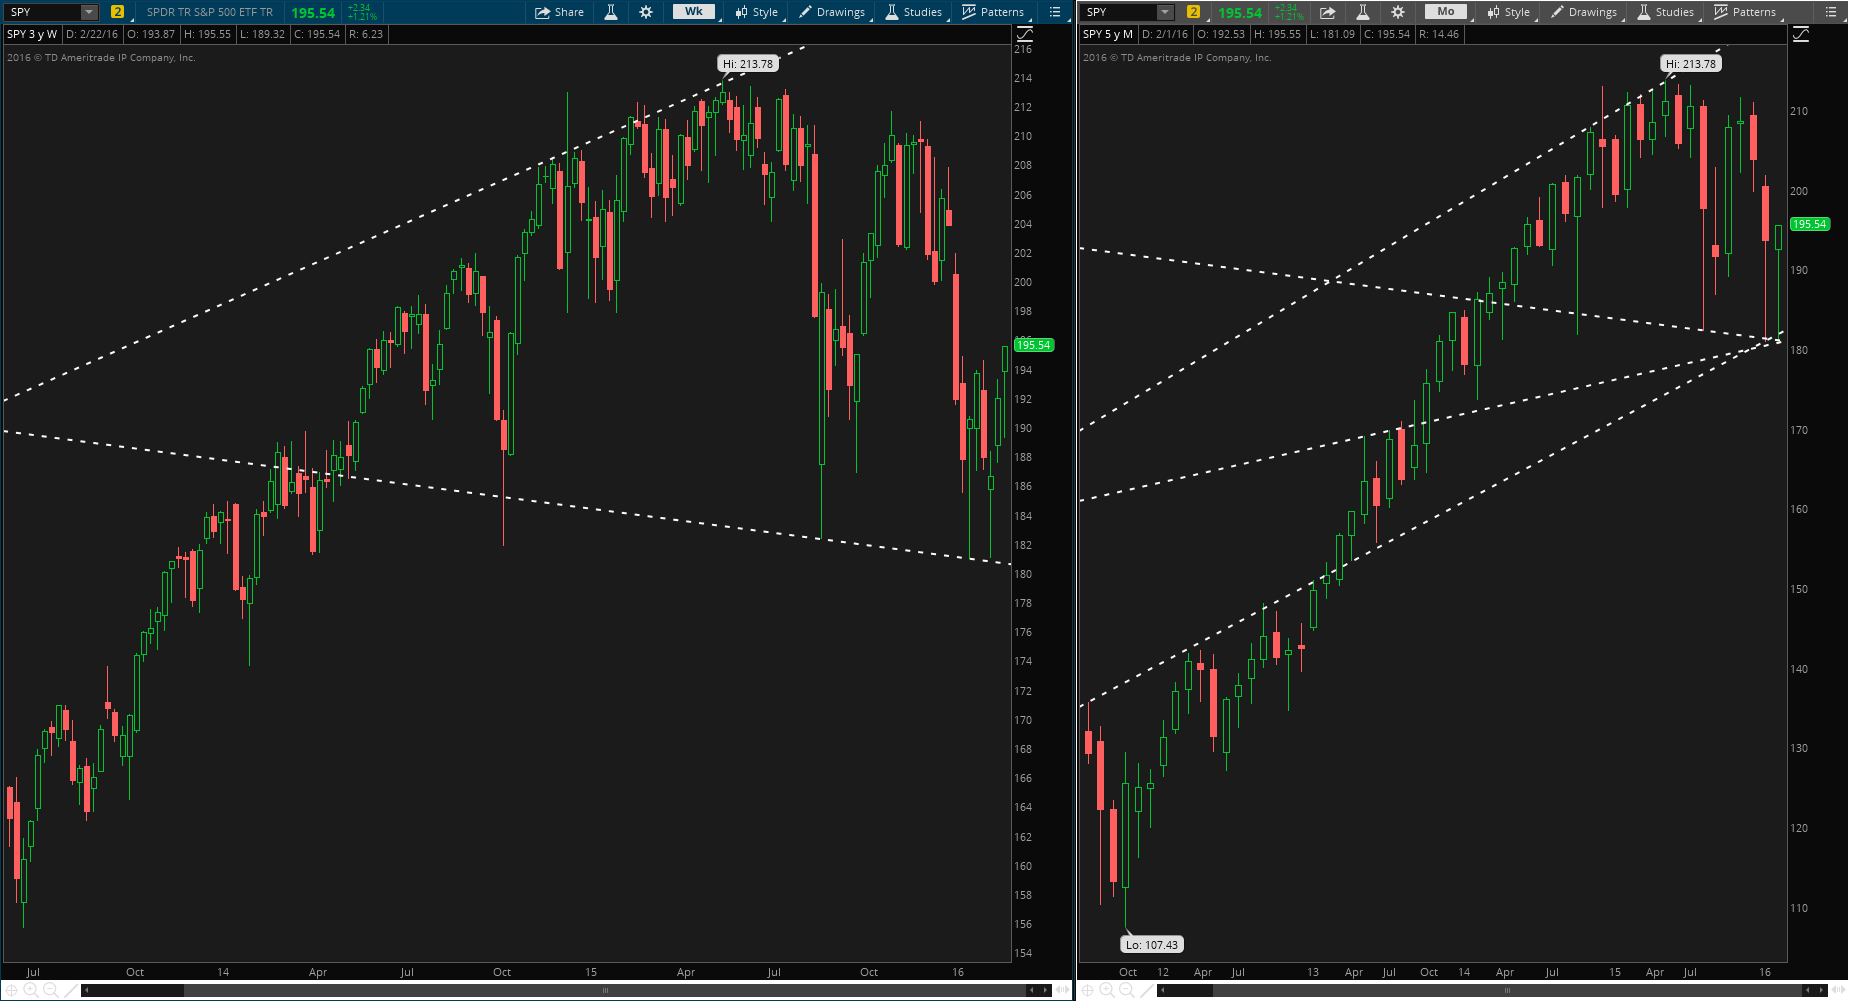
Let’s look at the weekly and monthly charts for SPY and take a little longer-term thesis approach:

SPY Weekly/Monthly Chart
SPY Weekly/Monthly Chart.

As you can see we’ve got a weekly hammer and an inside monthly hammer. Two extreme buy signals (upon confirmation) into a new month. If and when these signals confirm as we go into March, we then also have full time frame continuity (green day, week, month) – adding to our long-term conviction bias.

We have zero sell signals at the moment. ZERO.

As much as everyone wants to complain about low-volume and how the market does not make sense. We still have to trade what price is telling us, and until we get even the slightest short-term sell signal, I am pressing longs until my fingers fall off. I added more today from yesterday’s buy, and will press and press until I see something change.

Load the boat.


Comments »

Fools Gold

The gold market has everyone so turned around it’s not even funny. One week we’re telling clients to buy all the gold you can, and the next week we’re shorting it. Quite the shit-show, eh Goldman (thanks Zerohedge)?

Now that the gold rally is in full swoon and everyone thinks the world is ending and safe assets are miraculously going to preserve capital, it’s time short the hell out of the commodities. Goldman tells its clients to get long, and 5 days later they themselves are getting short. What the hell is going on here? A disaster of sorts, I tell ya.

Today’s candle is setting us up for  EPIC destruction for the gold bugs.

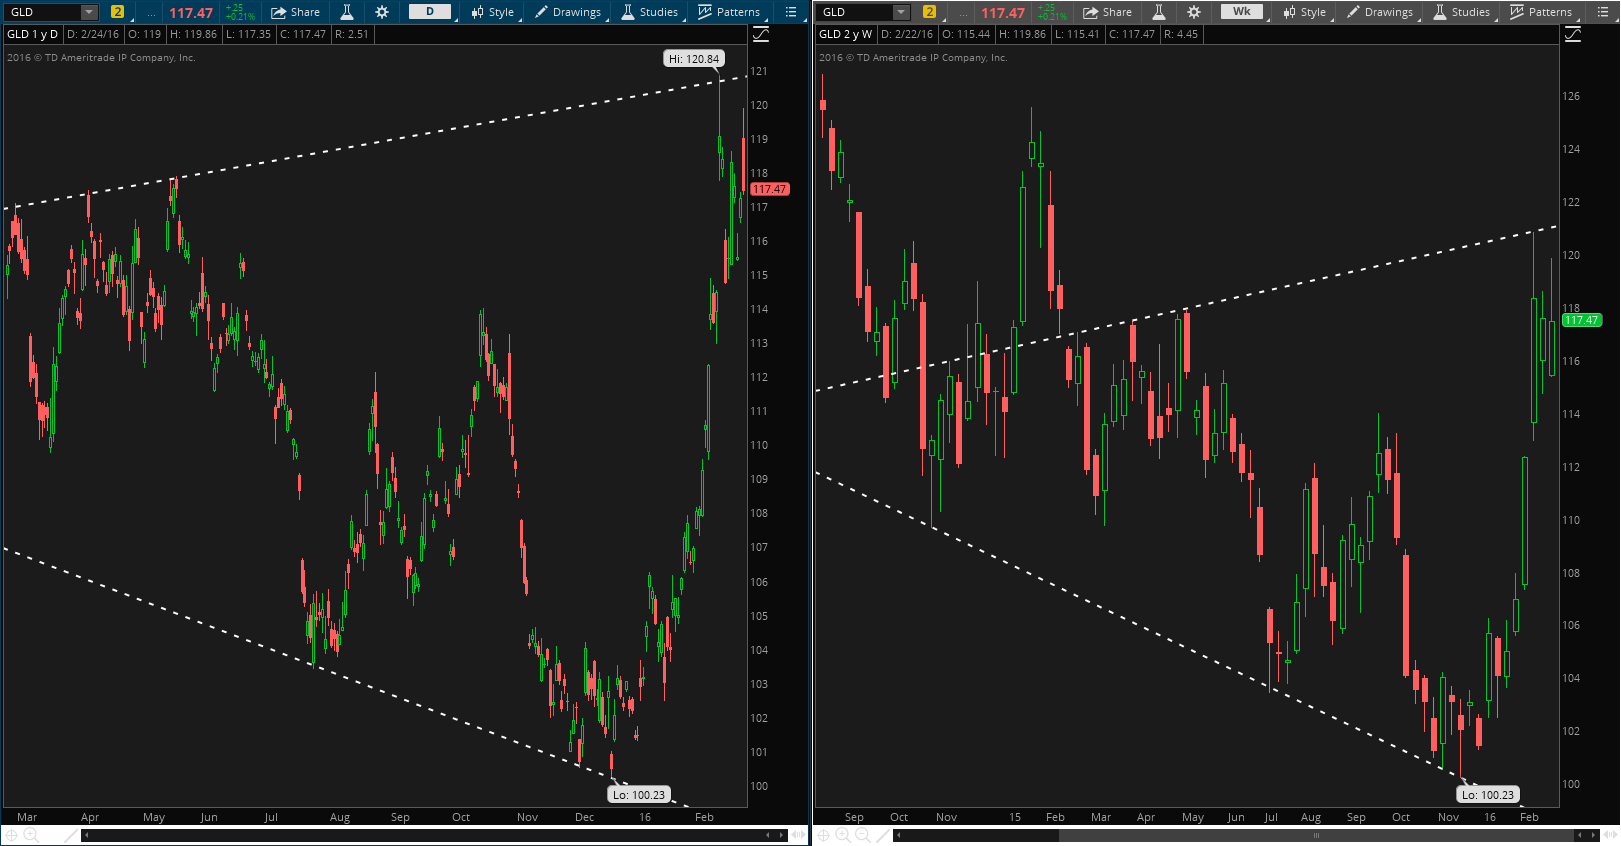
The daily chart shows a shooting-star candle, with extreme downside momentum. On the weekly chart (right) we have a reversal-setup brewing. After going inside week and up, we have sharply reversed back into last weeks range — surely setting up the late gold buyers to get obliterated. I started a short position this afternoon, and will look to fully punish them next week upon further confirmation.

GLD Daily/Weekly Charts


Sorry Cuban, even though you’ve got that cash money, doesn’t mean you know what the hell is going on in the markets.


Comments »