I gotta admit, I’m really having a hard time with this today.
Thanks guys.
The $TICK has been very benign today, really not confirming of this downside move. I can’t get over that.
Too many divergences today. Feels more like a trap here than a reversal, but I’ll review all the reasons why after the bell.
As discussed this morning, free After Hours with Option Addict trials this week.
OA
If you enjoy the content at iBankCoin, please follow us on Twitter


Gonna be a great boot camp. Tickets go on sale this weekend.
Jeff, post a link to After Hours. Free trials all week.
When you say a trap more so than a reversal, does that mean you view this move down today as more of a bear trap? Thanks in advance, and looking forward to After Hours. Appreciate all the work OA.
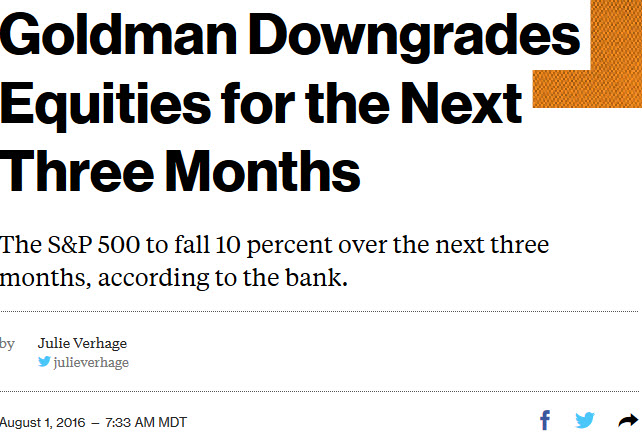
Yeah, sorry. Tried to make the article imply that, with the Goldman call and non confirmation via TICK.
Never any reason to say sorry my man, especially with all the work you do. Makes sense, I was able to grasp it. Thanks for confirming.
Thanks OA, appreciate the offer for the free trial to After Hours.
Does feel like a trap as there doesnt seem to be any conviction from the sellers, feels like more of a buyers strike.
Able to get a nice long entry on crude here under $40 tho…
Interesting. Tick seems to be holding under 0 all day. Although not a ton of extreme ticks down. Interested to hear your thoughts.
Negative tick implies direction. With how extreme this move was, there were no extremes to support it. Felt like all retail scrambling out of longs and into the nearest downside bet.
Thanks, I was reading it more in a consistent pressure sort of way. I’ll go have a look back at some similar moves…. Appreciate it.
Well, yeah…but market down. Just a reflection of what’s happening. That’s always going to be the case.
Look at it from the standpoint of what isn’t happening.
Good point. I’m going to look back with a different perspective.
Interesting comment OA. Check this chart out, mine help confirm your feelings.
http://www.charthub.com/charts/2016/08/03/ct_160802181949
Split chart, bottom is obviously $tick but top is cumulative tick – sum of all 1 minute tick bars over the day. -50,000 is my personal “trend day down” number based on back testing. Today was actually close…. I was surprised when I looked, kind of a sneaky amount of selling was going on, I think….
Sneaky selling? As I tried to state, yes, the market was down. This implies selling took place. Not debating that.
Big players move this needle, small ones don’t.
Rather than suggest sneaky selling was here, which I don’t totally understand, I’m saying there was enough accumulation here to absorb the little ones that stopped and reversed today.
You cats see that reversal in biotech, $IBB?
holy hell what happened there?
$BIIB
Amazing.
Holy cow. Love it.
$IBB erect, fake out to shake out. Looking for a strong close.
A move like that in biotech, was that clearly a bear trap?
The timing off the retest was very interesting. Either way, that’s why I bought $GILD here. I think it’s obviously actionable as a long.
Looking like the new bid in the market will be mergers and acquisitions and the bullshit stock buy backs may be taking a break
Great technical setup on $FEYE prior to earnings.
I was hoping not to have to ask but how do I sign in for hefree webinar, sir?
Top of page, Member Login, AH w/OA. Create account, choose free trial.
Thanks for the webinar
I am prepared for a >= 5% correction.
Look at VDC or VCR compared to XRT