“As most of you know I’ve been bullish on the stock markets for quite sometime now. I know there are a lot of investors that are bearish on the US markets and are looking for them to crash on burn. From my perspective nothing is broken that would tell me at this point in time to expect a major correction. So far the charts have been playing out beautifully and if nothing is broken there is no need to fix it.
The first chart I would like to show you is a very long term monthly look at the INDU that seems to be repeating a pattern that formed back in 2002 to 2007 rally phase. I’ve shown this chart several times in the past that shows the bullish rising wedge that formed as a halfway pattern in the middle of the 2002 to 2007 rally. No one at the time recognized this pattern, the bullish rising wedge, because everyone always considers these patterns as bearish. Nothing could be further from the truth as I have shown many times they act and perform just as any other consolidation if the price action breaks out through the top rail. The chart below shows the bullish rising wedge that formed in 2002 to 2007 as a halfway pattern that measured out perfectly in time and price to the 2007 high just before the crash. You can see our current bullish rising wedge that I’ve been showing since the breakout about 6 months or so ago.
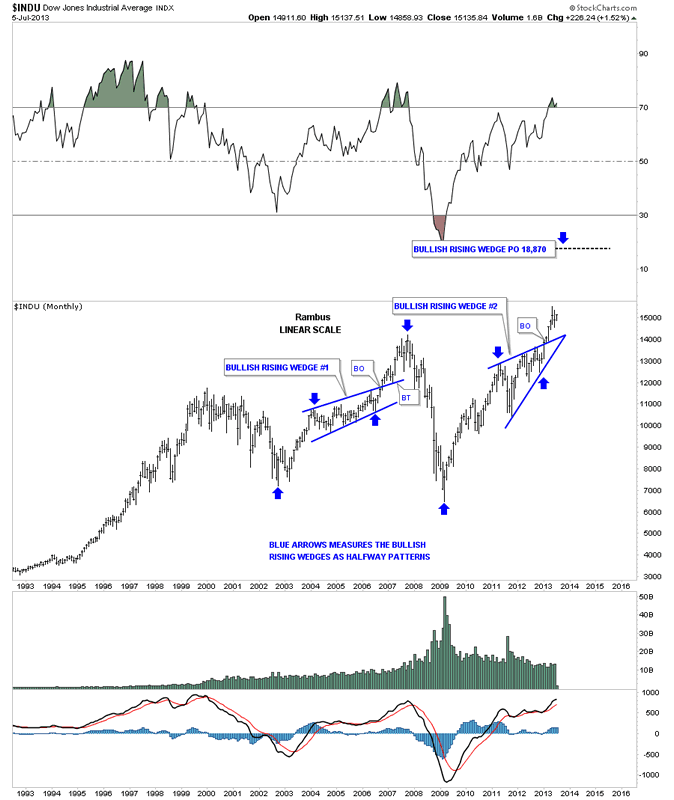
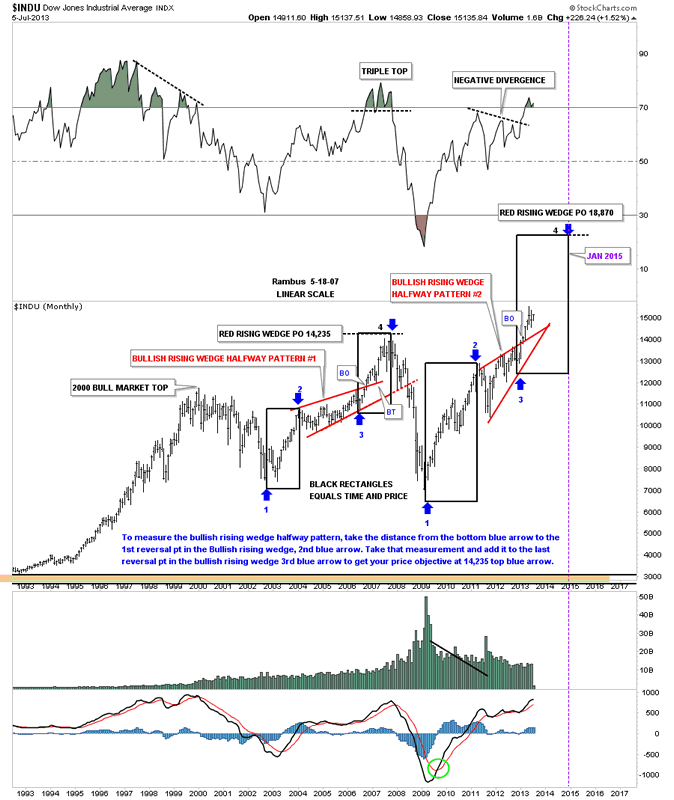
This next chart is the exact same chart as shown above. It may look a little busy but it shows you what I’m look for with our current bullish rising wedge #2. Note the two black rectangles from 2002 to 2007 that measured out the bullish rising wedge #1 as a halfway pattern in time and price. Now look at our current bullish rising wedge #2 that is showing a price objective up to 18,870 as measured by the blue arrows with a time frame in January of 2015 or so. You will only see a chart like this at Rambus Chartology and nowhere else because no one is looking for this pattern. The bears were all over the bullish rising wedge before it broke out to the upside. Its now been about 6 months and nothing is broken.
This next chart is a closeup look at the 2002 to 2007 price action….”
If you enjoy the content at iBankCoin, please follow us on Twitter
