iBankCoin
Home / 2013 / April (page 21)

Monthly Archives: April 2013

Tailored Advertising Comes to $FB via Datalogix

“Last fall, a source close to Yahoo told us that Facebook was working on an advertising product that “kills us.”

He said:

“There’s a story brewing about a next very big business it’s building—one that competes with one of Yahoo’s flagship ad products and would kill us.”

That product is finally here.

It’s called “partner categories.”

It allows Facebook advertisers to show ads to people who have purchased, or have shown interest in purchasing, specific categories of products offline – from consumer packaged goods to cars and more.

Facebook can do this thanks to a partnership with a firm called Datalogix.

Datalogix tracks usage of loyalty cards in offline retail stores.

Facebook can, in an privacy-sensitive way, tell who purchased about 50% of all consumer-packaged goods sold in the US.

Datalogix can also track people who have given over identifying information to merchants, asking for more information about their products.

So, for example, Facebook knows which of its users have asked Chevy for brochures on its new Camero.

The implications of this capability are obviously huge.

Imagine how valuable it will be for Gillette to put ads in front of men who bought new razors, or for Ford to stick a Mustang ad in front of those Camero shoppers.

That kind of targeting – based on a consumer’s signalled intent – is nearly as valuable as Google search targeting, where a consumer has told Google exactly what he or she is looking to buy.

No wonder our Yahoo source was so nervous.

Here’s Facebook’s blog post announcing the feature…”

Full article

Comments »

No March Madness For Retailers, More Like Across the Board Sadness

“Retailers broadly missed analysts’ estimates for same-store sales in March, a month that typically sees cold weather and slow hiring in the early weeks.

So far, 63 percent of retailers who reported results fell short of Wall Street’s estimates for sales at stores open at least a year, a key industry metric, according to the Thomson Reuters same-sales index, released Thursday. Excluding Walgreen and Rite Aid, whose results are heavily skewed by prescription drug sales, forecasters were expecting a jump in same-store sales of 2.2 percent, slowing from the blistering pace of 7.1 percent in March of last year.

Costco Wholesale reported a slightly smaller-than-expected rise in same-store sales, hurt by weak international results and lower gas prices, while Victoria’s Secret parent L Brands posted better-than-expected sales at all of its chains.

Costco fared better in the U.S., where sales at stores open at least a year rose 5 percent, largely in line with expectations. Small appliances, jewelry and fresh food logged some of the biggest gains.

L Brands saw continued improvement at its La Senza chain, as well as an unexpected rise in same-store sales at Bath & Body Works. Company-wide, same-store sales rose 3 percent; Wall Street had been expected flat results, according to Thomson Reuters.

Analysts had been expecting 13 top U.S. retailers, including Gap, to post a 1.8 percent rise in same-store sales for March, according to Thomson Reuters, down from a rise of 2.9 percent in March 2012….”

Full article

Comments »

Tech Insiders Sell Large Positions Over the Past Six Months

“Insider selling at the biggest technology companies hit a record pace over the last six months even as investors snatched up shares, pushing the Nasdaq CompositeIndex to a 12-year high.

More than 55 million shares were sold versus 1,780 shares bought for a sell-buy ratio of an eye-popping 31,109 to 1 at the 10 biggest tech companies, includingMicrosoftOracle and Qualcomm, according to Alan Newman, editor of the Crosscurrents newsletter and market analyst for 49 years.

“Insider activity confirms the rosy scenario indicated by prices is only an illusion,” wrote Newman in his latest letter. “Insiders have no confidence in their own companies. While prices appear to be indicating an all clear, we remain in one of the most egregiously speculative phases ever seen.”

In fact, insider selling‘s track record as a leading indicator has been mixed. Large amounts of selling by executives have taken place during long and vigorous rallies in the past. Plus, tech companies pay a lot of employees in options or stock grants, skewing the selling numbers for that sector in particular.

Still, should the numbers getting this massive raise red flags for new tech investors?

Those new investors were burned Thursday as Microsoft and Intel got slammed after research firm Gartner said that PC shipments fell 11 percent last quarter. The Nasdaq retreated from its high as the rest of the market held firm….”

Full article

Comments »

SEC Asks Five Big Banks to Disclose Risks Associated With “Principal Protected” Structured Notes

“NEW YORK (Reuters) – The Securities and Exchange Commission told five big Wall Street banks last year to improve disclosures about structured notes that are mostly sold to retail investors, and criticized use of the term “principal protected” in marketing materials.

The SEC sent letters to JPMorgan Chase & Co , Bank of America Corp , Citigroup Inc , Goldman Sachs Group Inc and Morgan Stanley on April 12, 2012, with 14 comments about their marketing, pricing and distribution practices for structured notes that the banks issued from April 2009 through March 2012.

SEC staff said that using the term “principal protected” for structured notes should also come with disclosures about risk.

The correspondence between the banks and the SEC were released this week.

Structured notes are unsecured bonds that are paired with derivatives, which guarantee the return of an initial investment, as well as some portion of any profits that come from the derivatives trade. However, the investments are not entirely risk-free: repayment of the bond is based on the credit-worthiness of the note issuer.

For instance, when Lehman Brothers filed for bankruptcy, holders of its “100 percent principal-protected notes” were treated like other unsecured creditors. UBS AG , which sold those notes to its brokerage clients, lost a series of related arbitration cases before the Financial Industry Regulatory Authority.

“Note titles using the term ‘principal protected’ should also include balanced information about limitations to the principal protection feature,” the SEC said, adding that issuers should “clearly describe the product in a balanced manner and avoid titles that stress positive features without also identifying limiting or negative features.”

In responses to the SEC, all five banks said they do not currently use the term “principal protected” and will continue to review titles of structured notes to ensure they reflect risks as well as positive attributes….”

Full article

Comments »

Why Bank Bail in and Bail out Wont Work. Case study Iceland and Greece

“As most of us can remember that Iceland was the first country that went down during the last Global Financial Crisis in 2008. During that time Iceland had done something remarkable and that is during the five years prior to the crisis, managed to transform its economy from a fishing industry to a mega hedge fund country. Many of its citizens left their traditional trade which is fishing to become fund managers and salesman. As a result Iceland’s banking assets (physical assets + Loans + Reserves + Investment securities) grown to more than 10x its GDP of $14 billion.  With such high leverage, when the financial crisis struck it is unable to defend its economy and hence its house of cards collapsed.

The purpose of this article is a post-event analysis of the performance of the Icelandic economy that refuses a bailout as compared to Greece which went for a bailout with the injection of funds from Troika. To simplify matters, we shall coin the bail-in and bail-out as (BIBO)for short. Of course in the short term it helped stabilized the Greek economy for a while but we want to know to what extent it had transformed the Greek economy in the long run with the accompanying terms and conditions and austerity measures. In this article we shall compare the performance of both the economies of Iceland and Greece with the economic indicators or metrics below from the year 2002 to the present. We believed we have been fed with too much toxics by the mainstream medias which are also own by them that capitalized on the age old investment axiom of good-to-good.

Does Government do what’s right for us?

We have led to believed or should we say brought up with the perception that when someone does well then he/she will be blessed in return. Hence it gave rise to an old age investment axiom of good-to-good and bad-to-bad reaction which can be translate to good action leads to good reaction. So we always believed that whatever our Government does it will be for the better of us. So when they bailed out the banks, we believed that they are doing the right thing and we should leave everything in their good hands and expect good reaction. Right? WRONG ! We shall show you on our analysis below that whatever our Government does is not necessary the right thing to do. We have based our analysis on the following indicators or metrics.

  1. GDP per Capita
  2. Inflation rate
  3. Balance of Trade
  4. Government Debt to GDP
  5. Government 10Y bond
  6. Government Spending
  7. Consumer Spending

The following is a review of the Icelandic economy which not only refuses a bailout of its banks but instead bankrupting them. They are taking a big risk to take things into their own hands instead of letting the bankers running their country. They are going off the beaten path and from our analysis we reckoned that they have done the right thing. Below we compare the economies of two different countries that have taken different paths – one that receive bailouts (Greece) and the other (Iceland) refuses bailouts. The first metric we are using is the GDP per Capita.

  1. GDP Per Capita ratio

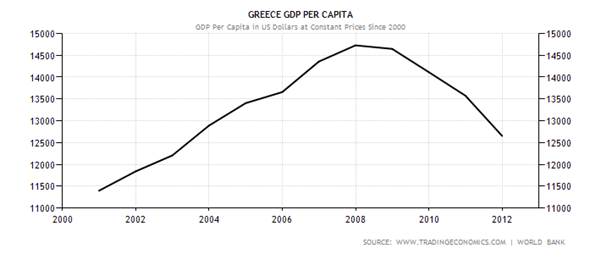
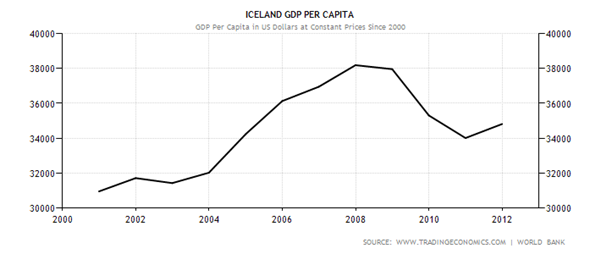
The first metric that we are going to compare is the GDP/Capita ratio. GDP/Capita also shows the standard of living of a particular country and a higher ratio normally denotes a higher standard of living. As you can see from the charts 1a & 1b below Greece seems still to be on the plunging mode and somehow there seems to be no slowing down in sight and hence a floor has yet to be set. Whereas Iceland seem to be going on a firmer footing when its GDP/Capita ratio seems to be stabilizing around 2011 and it seems to be on the uptrend. Iceland’s current (2012) ratio seems to be heading back towards the 2006 level whereas Greece’s is heading backwards to the 2003 level.

Chart 1a & 1b (GDP Per Capita)

Historical Data Chart

Historical Data Chart

  1. Inflation Rate

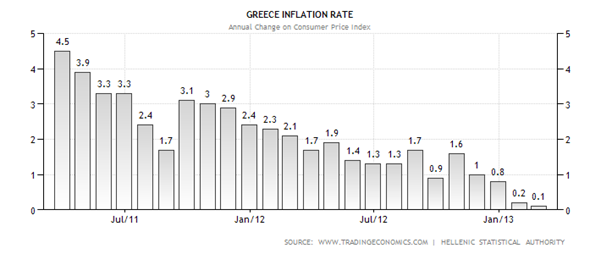
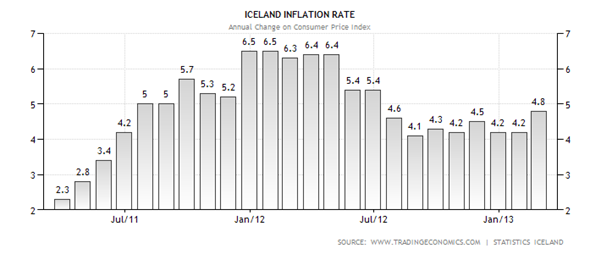
The second metric is the Inflation rate. From Chart 2a below it seems like Greece’s might be facing the risk of a deflationary spiral as happened to Japan in the 1990s.  Its inflation rate has fallen from 4.5% in April 2011 to 0.1% in February 2013. Once the economy sets it path on a deflationary mode it is very difficult to reflate it back to the preferred long term inflation rate of 1-2 % above zero. Japan will be a good example when its economy was gripped by the deflationary forces since the 1990s, eventually it ended with 2 lost decades of growth. Only recently newly elected Prime Minister Mr Shinzo Abe is committed to reflate Japan’s economy at any cost.  On the other hand Iceland’s inflation rate is now at 4.8% which is hovering around the mean of (4.7%) for the past three years and considered to be manageable and essential for economic growth.

Chart 2a & 2b (Inflation Rate)

Greece Inflation Rate

Iceland Inflation Rate

  1.  Balance of Trade

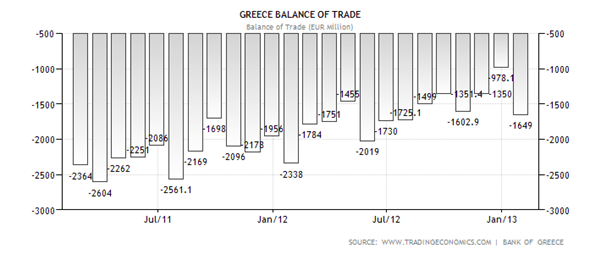
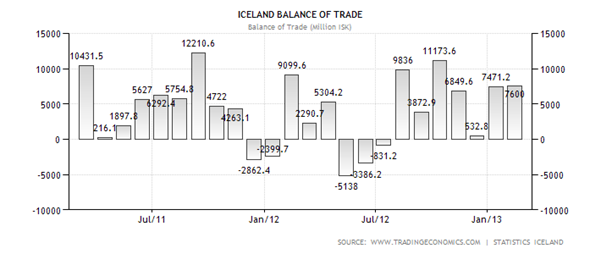
The third metric is the Balance of Trade which is also can be defined as difference between the exports and imports in monetary terms. From Chart 3a it is very obvious that Greece has been running trade deficits for the past 24 months consecutively. Negative trade deficits means there is a net outflow of money from Greece. This means that Greece may need to borrow more in future in order to finance its government expenditure and hence will incur more debts in its coffer. As for Iceland it is a different story where out of the 24 months 19 of them are experiencing positive balance of trade. Positive balance of trade means positive net inflow of funds and hence it enable the Icelandic government either quicken their repayment of debts or embark on new government fiscal expenditures without resorting to more borrowing.

Chart 3a & 3b (Balance of Trade)

Greece Balance of Trade

Iceland Balance of Trade

  1. Government Debt/GDP

Next is the Government Debt/GDP ratio or the total amount a country has as in percentage of its GDP. It seems that Greece’s Debt/GDP ratio is currently way above 100% and as of end of 2012 it at 161.6%. A high Debt/GDP means more funds are needed for interest payments and hence less will be available for development. We will foresee this trend will extend much further into the future because 1) its ratio is still considered dangerously high and 2) many of its economic indicators are still recording negative readings and hence may dampen its ability to quicken its repayment schedule….”

Full article

Comments »

Corporate Profits Mirror S&P Performance or Vice Versa

“I’ve made a big fuss over QE in recent years and yet the market continues to plough higher.  I often have people ask me:

“Why does QE make stock prices go higher if there’s no fundamental impact?

My answer is always the same.  First, look at Europe where QE has also been implemented and stock markets like Greece, Italy and Spain have been decimated.  Then look at a country like the USA where QE has been implemented and yet stocks soar.  Then ask yourself what the big difference is between these countries?  The answer: austerity versus massive deficit spending.

It might be easy to scoff at such an observation, but the reality of the picture is that corporate profits have been largely driven by the deficit in this cycle.  As net investment collapsed the traditional driver of profits was overtaken by government spending (see figure 1).  This makes sense if you’re familiar with Kalecki and his profits equation.  It makes even more sense if you’d been working under Richard Koo’s balance sheet recession theory in recent years.  The impact of government deficit spending in such an environment has been massive.  All those people screaming about the ill effects of deficit spending and hyperinflation in recent years missed the very explainable and fundamental driver of the profits momentum…..”

Full article and charts

Comments »

$FB Acquires Mobile Software Startup Osmeta

“While Facebook is building out a bolder role in mobile in the form of Facebook Home, it looks like it is also continuing to make acquisitions that will help bolster that strategy overall. We have learned that in the lead-up to the launch last week, the social network appears to have quietly picked up Osmeta, a Mountain View-based mobile software startup. Osmeta had yet to launch a commercial product, and it is not completely clear at this point if this is an acqui-hire or a technology deal as well.

We have reached out to Facebook for a comment and will update this post if we hear back. Update: A Facebook spokesperson has now confirmed the acquisition, with no further comment. Original story continues below.

This is what we’ve been able to piece together:

– Osmeta has been around since August 2011. It was co-founded by Google/IBM alum Amit Singh, and IBM alum Mark Smith, and it had 17 employees — all engineers. It’s “about” page describes a team of “world-renowned hackers and highly accomplished researchers capable of herculean software engineering.” In addition to Google and IBM Research, other past employers included Yahoo Research, VMware and Facebook.

– A number of employees who had listed Osmeta as a place of employment are now indicating that they work at Facebook on their LinkedIn profiles. One of them specifically notes that he moved to Facebook after it acquired Osmeta in March 2013.

osmeta to facebook linkedin

– The company had yet to publicly launch a product, but….”

Full article

Comments »

VC Investments Up 17% in Q1, Highest Since Halcion Dotcom Days

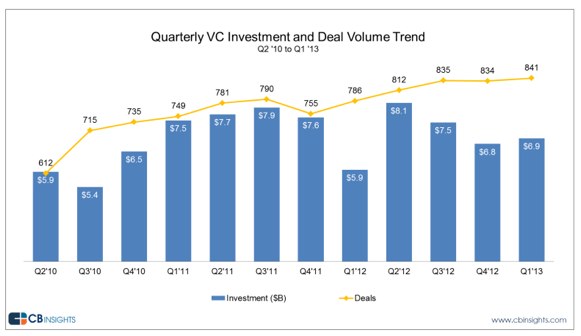
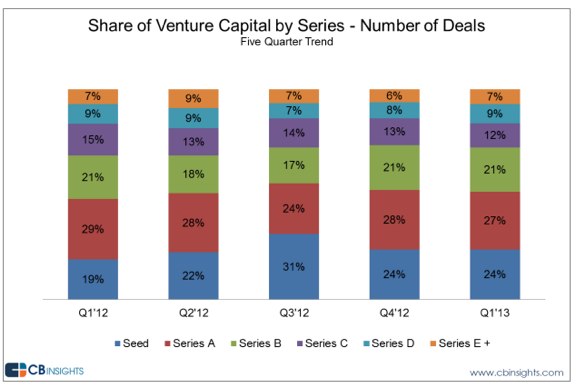
“Private company M&A and venture capital database CB Insights has issued its Q1 2013 report on venture capital and deals. According to the report, VCs invested $6.9 billion across 841 deals (eclipsing a Q3 2012 high), which is the highest level since dot-com days, says CB Insight. You can find a full copy of the report here.

One of the most interesting data points noted by CB Insights was that Series C, D and E all saw an increase in shares of funding dollars while Series A and B both saw declines. Consistent with the reports we’ve seen over the past few months, seed funding continued relatively the same despite concerns about a Series A crunch.

Deal volume was up 7 percent from last year, and funding, relative to Q1 2012, was up 17 percent. Seed VC activity was fairly flat on a sequential basis (194 seed VC deals in Q1 2013 vs. 190 in Q4 2012) but year-over-year VC seed deals are up 31 percent (148 in Q1 2012). Internet deal activity climbed to multi-year highs hitting 379 deals (best since Q1 200), but social as a category made up only 4 percent of deals. CB Insights attributes this jump to the boom in enterprise deals. Clean-tech deals and dollars also hit multi-year lows.

mobile

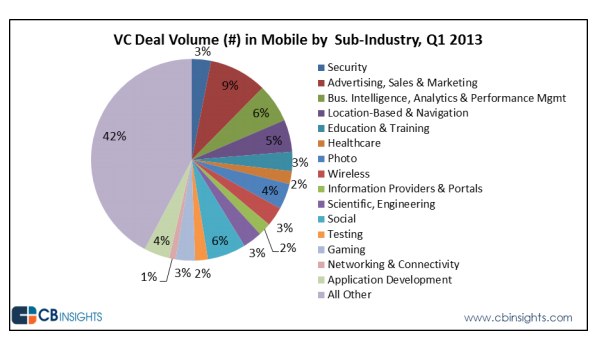
Investment dollars within mobile hit $718 million in Q1, a high beat only by Q3 2012, which saw $968 million in investment. The actual amount of deals dipped to 106 from 122. As a sub-industry in mobile, security is seeing a boom, with over 30 percent of funding dollars for the quarter.

cb1

cb3

Specifically for Internet companies, deal activity and funding to Internet companies increased 10 percent and 12 percent from Q4 2012, respectively, and climbed 16 percent and 35 percent on a year-over-year basis.

In terms of states for the second time in the last two years….”

Full article

Comments »

Bitcoin Meltdown Caused by Massive Interest in the Digital Currency

“The Bitcoin correction we wrote aboutyesterday was not caused by a DDOS attack on one of the largest Bitcoin exchanges, Mt.Gox, but rather by a massive spike in interest in the crypto currency, according to Mt.Gox.

During trading yesterday the value of Bitcoin plummet by 60%, dropping from a high of $265 to around $150 (at the time of writing it has climbed back up slightly, to around $180). As the value of Bitcoin dropped, San Francisco-based exchange called TradeHill claimed the fall was a result of distributed denial of service attacks on Mt. Gox and Bitstamp.

But Mt.Gox has now posted a notice on its Facebook page explaining the dramatic dive as the result of too much interest in Bitcoin. As its infrastructure slowed down under the volume of new users crowding in, it said the resulting lag then caused traders to panic and sell off currency — triggering the drop.

Earlier this month the Tokyo-based exchange was hit by a DDOS attack — which it said had caused its “worst trading lag ever“. But this time the lag was caused by the Bitcoin goldrush, and existing investors’ fearing a Bitcoin bubble….”

Full article

Comments »

IEA Lowers Expectations for Global Oil Demand

“In its market report for April, the International Energy Agency (IEA) has once again lowered its expectation for global oil demand this year. In theory, that should keep the price of gasoline down.

The International Energy Agency expects 2013 to be the third consecutive year of weak growth in demand, adding only 795 000 barrels per day (795 kb/d), according to the April Oil Market Report (OMR) published today.

Relatively strong demand growth among non-OECD countries of 1.28 million barrels a day (mb/d) will be tempered by a contraction of 480 kb/d in OECD consumption, particularly in Europe, where it will shrink by 340 kb/d. European demand has not been this weak since 1985.”

Source

Comments »

Is $MSFT’s Vision an $AAPL Killer ?

“For the first time in many years, Microsoft has a vision.

In November 2012, CEO Steve Ballmer proclaimed that Microsoft (MSFTFortune 500)is no longer just a software company that licensed its operating system to PC makers to use as they pleased. Instead, Microsoft is now a devices and services company that develops its own end-to-end experience for consumers. Ballmer said Microsoft wants to maintain firm control over how its products are used.

Microsoft provided the first glimpse of how that plan might come together two weeks ago, when it unveiled its new strategy codenamed “Blue.” The company promises to roll out more frequent and more incremental updates of Windows, Windows Phone,Office and Xbox software. More than that, those updates will be coordinated across Microsoft’s multiple platforms, to get all customers’ “devices, apps and services working together.”

Instead of a mishmash of systems out there using outdated Microsoft software with glaring compatibility issues, “Blue” could ensure that Microsoft’s own products evolve at the same rate as the rest of the tech world.

If this is starting to sounds a lot like how Apple (AAPLFortune 500) and Google(GOOGFortune 500) do business, that’s intentional.

But Microsoft’s plan may be even better than anything Apple or Google currently have to offer. If — and it’s still a lofty if — there’s a shred of validity to rumors that Microsoft will merge the Windows and Windows Phone platforms, “Blue” could end up being a huge deal. Dissolving the barrier between mobile and desktop would be nothing short of impressive.

That would mean the main difference between Microsoft’s products would be the size of the hardware they run on. It’s the post-PC concept at its ideal peak….”

Full article

Comments »

Disability Claims Melt Up 44%

“The number of Americans getting some type of disability check from the federal government is soaring.
Since 2003, there’s been a 29% jump in Americans with little or no work experience getting disability payments, according to the Social Security Administration. Over the same time, there’s been a 44% increase in disability claims by people formerly in the workplace.

Disability claims among veterans are up 28% since 2008, according to the Department of Veterans Affairs.

All told, the federal government spent nearly $250 billion in 2011 paying more than 23 million Americans some type of disability claim. That’s about 7% of the overall population, and 16% of the workforce.

Those numbers don’t even include people out on worker compensation claims — which are mostly paid for by private companies. Five states also offer short term disability, and there are nearly 1 million workers receiving private disability insurance.

But the Social Security-administered program that pays disability claims will likely run out of money by 2016, forcing politicians to either cut Social Security benefits, raise taxes or, most likely, dip into general Social Security funds for the money.

There are many reasons for the increase in disability claims, most notably the recession, an aging population, advances in medical technology and a decade of war.

The recession: The economic downturn in 2008 and early 2009 is thought to be the major reason for the jump in disability payments to people who were formerly working….”

Full article

Comments »

Expert: Fed Creating New Housing Bubble

“The rebound in the housing market is “eerily familiar to the previous government policy-induced boom that went bust in 2006, and from which the country is still struggling to recover,” says Edward Pinto, who was the chief credit officer at Fannie Mae from 1987 to 1989.

In an opinion article in The Wall Street Journal, Pinto notes that the Federal Reserve’s aggressive policy of quantitative easing has lifted the stock market to record highs and supported strong bond prices. Moreover, he says, housing prices have jumped 8%, the biggest annual gain since 2006.

Pinto, now a resident fellow at the American Enterprise Institute, says that the market value of single-family homes has risen by more than $1 trillion. That “wealth effect” should empower homeowners to spend more, thus boosting the economy….”

Full article

Comments »

Marc Faber: The S&P 500 Could Easily Decline 40%

“The Standard & Poor’s 500 Index could drop 40 percent, according to contrarion investor Marc Faber.

“There are some people now calling for Dow Jones 18,000 or 20,000 by year end,” Faber told Newsmax TV in an exclusive interview. “The S&P could then easily drop by 40 percent.”

The editor and publisher of “The Gloom, Boom & Doom Report” said the market “needed the correction” starting in February or March….”

Watch our exclusive video. Article continues below….

Comments »

Sam Zell: “The Stock Market Feels Like The Housing Market Of 2006”


“Instead of the endless procession of “different this time”, “buy-the-dip”, “money-on-the-sidelines” asset-gathering, Muppet-fleecers that CNBC so typically trots out, Sam Zell graced them with his presence and the truth was allowed a voice for a few minutes. Joined by David Rosenberg, who clarifies the insanity that engulfs US equities, explaining in wonderment that it is “not surprising the market rises even in the face of bad ISMs, worse jobs, and worst NFIB data, because Japan and the US are embarking on a gargantuan quantitative easing that is the lynchpin behind the stock market.” It is not about being bullish, or bearish, or agnostic, it is understanding the driver of this market – and that is not the economy, not earnings, “it is the mother of all liquidity-driven rallies.” Maria B, soundbite in hand, is slammed for her “glibness” at not fighting the Fed but it is Sam Zell’s brutal honesty that shocks even the money-honey. “This is a very treacherous market,” Zell explains – thanks to the giant tsunami of liquidity, “the problems of 2007 haven’t been dealt with,” and given the poor macro data and earnings, “we are suffering through another irrational exuberance,” leaving the entire CNBC audience speechless when he concludes, “the stock market feels like the housing market of 2006.”

Maria B:

So don’t fight the Fed?

Rosenberg:

That’s a pretty glib comment for what is going on. You could have fought the Fed in 2000 and 2009 and done quite well… [thanks to the Fed] the market will tend to drift up – until something breaks.”

Zell:

“We’re debasing our currencies around the world.. which ultimately translates into a lot of inflation.”


“What we are seeing here is like a giant tsunami of liquidity.”


People look at the market and think things are better. The level of uncertainty has reached a point where people are just throwing money [at risky assets] because they don’t know what else to do with it.”


“I would not be adding money to the stock market. This is a very treacherous market.”


“Yes, it’s gone up every day. Yes, you’re not supposed to fight the Fed, but sitting on the sidelines is preferable.”


“In our businesses, we are not seeing strong conditions.”


“The problems leading up to 2007 haven’t been dealt with.” …”

Full video interview & article

Comments »

A Closer Look at the Preliminary Results of Samurai Abenomics

images (32)


“(Reuters) – Feeling bolder after a 50 percent jump in Tokyo share prices inflated his stock portfolio in recent months, Akira Otomo surprised his wife with a new kimono and matching traditional obi belt costing more than $8,000.

After a decade and a half of self-imposed austerity, there are signs that wealthier Japanese shoppers are spending more. Confidence is rising, and with it sales of high-end goods and clothes, giving retailers a boost.

“I’d given up on my stock portfolio, but I’m happy prices are finally getting back to where they were before the Lehman crisis,” said Otomo, 56, who runs a human resources training company. “I’m looking to sell, and I’m sure I’ll spend some of the profits,” he added as he left an apparel shop in Tokyo’s upscale Omotesando district.

The trigger has been Japan’s radical gamble to end deflation under Prime Minister Shinzo Abe – a combination of aggressive monetary easing, currency devaluation and promises of reform dubbed “Abenomics.”

Many retailers forecast higher profits for this year on improved sales of luxury goods and clothing. But some retailers and shoppers are unsure if spending will continue once the feel-good factor of higher stock prices fades. For many Japanese, wages remain depressed and employment prospects uncertain.

“The rich have money, but I don’t feel the economy’s getting better,” said Eri Mori, a 42-year-old Osaka housewife. “I don’t see salaries rising.”

PORTFOLIO EFFECT

The stock market rally .T that has given Otomo the confidence to splurge was sparked by Abe’s pledge to overhaul the Bank of Japan so it would ease monetary policy more aggressively. The BOJ delivered last week, agreeing to double the amount of government debt it holds over the next two years.

Abe is counting on the wealth effect from further gains in stock prices, encouraging investors to cash in and spend more.

“The sudden improvement in the stock market has led to a big rise in sales at our department stores for luxury brands and high-end goods like jewelry, precious metals and watches,” said Ryoichi Yamamoto, president of J.Front Retailing Co (3086.T), which operates store chains like Daimaru and Matsuzakaya that do more business in Osaka and Nagoya.

The company sees that higher demand acting as a “tailwind” to drive up operating profit by close to a third to a record 40 billion yen ($404 million) in the year to next February….”

Full article

Comments »

Gapping Up and Down This Morning

SOURCE
NYSE

GAINERS

Symb Last Change Chg %
SSNI.N 19.93 +1.48 +8.02
ERA.N 24.05 +1.30 +5.71
SUSS.N 53.00 +2.69 +5.35
TMHC.N 23.04 +1.04 +4.73
APAM.N 38.92 +1.24 +3.29

LOSERS

Symb Last Change Chg %
KNOP.N 21.79 -1.21 -5.26
AGI.N 12.35 -0.45 -3.52
SBY.N 20.62 -0.72 -3.37
BCC.N 30.87 -0.75 -2.37
PF.N 23.57 -0.53 -2.20

NASDAQ

GAINERS

Symb Last Change Chg %
ROYL.OQ 3.40 +1.40 +70.00
HOTR.OQ 2.40 +0.41 +20.60
MARK.OQ 2.38 +0.37 +18.41
TTPH.OQ 8.39 +1.13 +15.56
PZZI.OQ 5.85 +0.77 +15.16

LOSERS

Symb Last Change Chg %
SGYP.OQ 6.01 -1.23 -16.99
TITN.OQ 22.45 -3.71 -14.18
HBIO.OQ 4.84 -0.76 -13.57
VBFC.OQ 2.00 -0.22 -9.91
INFI.OQ 42.47 -4.19 -8.98

AMEX

GAINERS

Symb Last Change Chg %
REED.A 4.34 +0.22 +5.34
EOX.A 6.77 +0.32 +4.96
BXE.A 6.60 +0.27 +4.27
NML.A 21.12 +0.49 +2.38
ORC.A 13.95 +0.27 +1.97

LOSERS

Symb Last Change Chg %
AKG.A 2.75 -0.26 -8.64
SAND.A 9.04 -0.24 -2.59
FU.A 3.70 -0.06 -1.60

Comments »