iBankCoin
Home / chessNwine (page 116)

chessNwine

Full-time stock trader. Follow me here and on 12631

Five Tasty Stocks to Stuff in Your Lunch Pineapple

Pw7v5HR

Courtesy of The PPT algorithm, here are the most current top five readings from my “12631 RELATIVE STRENGTH” custom-made screen, identifying which stocks are exuding some of the best performances to the market at-large at any given moment.

I look for stocks whose Daily PPT Hybrid Score surges, while the Weekly Hybrid has been negative over the past week. This can often yield stocks which are emerging from consolidations.

Members can click here to view and save the screen.

Sorted for at least 500,000 shares of daily average volume to ensure liquidity.

Please click on image to enlarge.

________________________________________________________

2014-08-05_1237


Comments »

Holding Their Ground

xaojBFb

Despite how heavy the SPY looks to me on the 30-minute timeframe, first chart below, I am still laying off the short side for now due to the small caps and regional banks holding their ground and snapping back to outperform so far today. If that changes this afternoon and the selling intensifies I will shift gears and re-short.

But I am focused on whether natural gas sees some upside follow-through, preferably over $21.50 on the natural gas ETF, second chart below.

Overall, this market smacks of being high risk/fairly low reward, not to mention high summer churn.

Keep an eye on the VXX 30-minute chart to see which way that tight consolidation breaks.

_____________________________________________________

SPY

_____________________________________________________

UNG

Comments »

When the Hurricanes Go Marching In

weather-channel

I am long some natural gas here, a chart I have previously discussed on this blog and in my videos. I took the trade inside the 12631 Trading Service, looking for a snapback rally to play out in front of the heart of hurricane season.

More on this in a bit, with chart included.

Drop me your top trades this morning.

Comments »

This Chart is My Secret Stash

Bt5NMu4IYAAVHRP.jpg-large

Well, perhaps not to secret.

But the 30-minute timeframe of the S&P 500 Index, as discussed yesterday, is an excellent reference for this market.

On the one hand, the declining 50-period moving average (on this timeframe, darker blue line) acted as resistance to price on this morning’s weak open.

On the other hand, the 20-period moving average (orange line) is now trying to act as support.

But the main thing is that the rising wedge we have seen form from the grinding bounce yesterday (light blue line) is in jeopardy of breaking down to see price make fresh lows–At least that is the risk to dip-buyers.

As I noted yesterday, I am back to full cash and waiting for a better entry. I may get a short entry if we see dip-buyers fail this morning at the orange line. And I probably will not take on longs until the S&P clears 1942.

Similar comments apply to the IWM QQQ 30-minute charts.

_______________________________________________________________________

SPX


Comments »

Cover and Reassess

The following is just a small excerpt from my latest Weekly Strategy Session (please click on that hyperlink for details about trying it out). which I published for members and 12631 subscribers this past Sunday. 

Short-Term Oversold; Cover Shorts Into Any Weakness Early This Week and Reevaluate 

According to a variety of indicators, the broad market is now oversold after the abrupt sell-off we saw late-last week. In support of that statement, let us look at two indicators. 

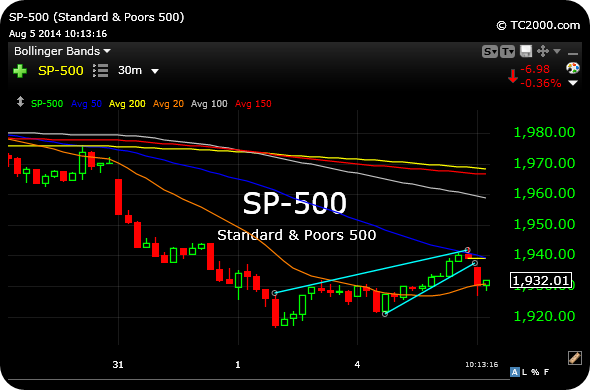
First, all major averages closed the week out below their respective lower daily chart Bollinger Bands. 

For reference, Bollinger Bands are useful technical indicators for measuring relative short-term tops and bottoms, among other aspects, including volatility compression and explosion. 

Here, the Dow Jones Industrial Average saw price slice down through and close below the lower Bollinger Band, typically a sign of short-term oversold conditions. It is therefore likely that a temporary bounce can ensue this week. 

In addition, the NYSE McClellan Oscillator (“NYMO”), which is a simple market breadth indicator tool, finished last week at -89.39. 

Generally speaking, when NYMO is above zero it tends to indicate bullishness for stocks, and below zero, bearishness. However, extreme readings can indicate overbought or oversold conditions. Above 50 is considered to be overbought, while below -50 is considered oversold.

Here, you can see NYMO closing in deeply oversold territory by the end of last week. 

As a result, the market is plainly oversold on daily timeframes headed into next week. Of course, oversold can certainly become more oversold in corrective markets (e.g. summer 2011), particularly corrective markets which reek of complacency and a general lack of panic. 

So, the issue then becomes what this oversold condition means to us given the current backdrop of this particular market.

In prior instances during this bull market, abruptly oversold conditions presented an excellent buying opportunity to spring price back to fresh highs in a V-shaped manner.

Nonetheless, the argument in these Strategy Sessions is that we are dealing with a…

Please click here to continue reading

Comments »

Night Owl Titanic Snobbiness

qu3k11wataqmatm1

Here are some actionable short ideas on this list.

Courtesy of The PPT algorithm, here are some very aggressive ideas for short trades headed into Tuesday. If you are not comfortable shorting (especially in a bull market), there is nothing wrong with taking a pass. Keep those cover-stops in place. Nonetheless, a good chunk of readers are always looking for short ideas.

Members of The PPT can click here to view and save this “Titanic” Screen, as I named it when I created it a few years back. The screen isolates stocks vulnerable to further weakness.

Please click on image to enlarge 

________________________________________________________

2014-08-04_2349


Comments »