
Well, perhaps not to secret.
But the 30-minute timeframe of the S&P 500 Index, as discussed yesterday, is an excellent reference for this market.
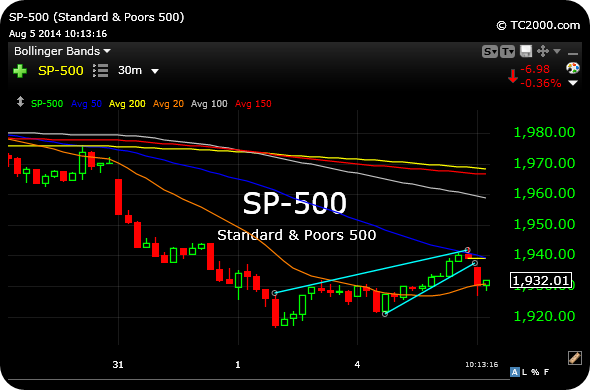
On the one hand, the declining 50-period moving average (on this timeframe, darker blue line) acted as resistance to price on this morning’s weak open.
On the other hand, the 20-period moving average (orange line) is now trying to act as support.
But the main thing is that the rising wedge we have seen form from the grinding bounce yesterday (light blue line) is in jeopardy of breaking down to see price make fresh lows–At least that is the risk to dip-buyers.
As I noted yesterday, I am back to full cash and waiting for a better entry. I may get a short entry if we see dip-buyers fail this morning at the orange line. And I probably will not take on longs until the S&P clears 1942.
Similar comments apply to the IWM QQQ 30-minute charts.
_______________________________________________________________________


it’s the first time since months that IWM is “less weak” than others ….what do U think pls
So far
I was seeing the same thing. I bought TNA at 66.70.